 |
| Market Cap | 3.02B | EPS (ttm) | 6.13 |
| P/E | 14.95 | EPS this Y | -8.52% |
| Forward P/E | 16.40 | EPS next Y | -3.75% |
| PEG | 2.14 | EPS past 5Y | 11.01% |
| P/S | 4.02 | EPS next 5Y | 7.00% |
| P/B | 2.05 | EPS Q/Q | -12.76% |
| Dividend | 1.93% | Sales Q/Q | -21.98% |
| Insider Own | 40.05% | Inst Own | 45.54% |
| Insider Trans | -0.31% | Inst Trans | -3.37% |
| Short Float | 2.79% | Earnings | Apr 18/a |
| Analyst Recom | 3.50 | Target Price | 91.62 |
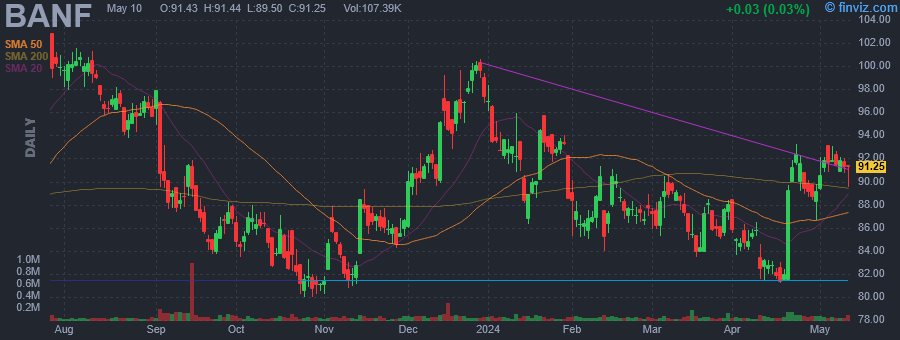
| Avg Volume | 62.57K | 52W Range | 68.44 - 104.00 |
|
|
|
Apr-23-24 12:20PM
|
Can BancFirst (BANF) Run Higher on Rising Earnings Estimates?
(Zacks) |
|
Apr-22-24 01:17PM
|
Bancfirst Insider Sold Shares Worth $900,723, According to a Recent SEC Filing
(MT Newswires) |
|
Apr-18-24 09:52PM
|
BANF Stock Earnings: BancFirst Beats EPS, Beats Revenue for Q1 2024
(InvestorPlace) |
|
07:00PM
|
BancFirst (BANF) Reports Q1 Earnings: What Key Metrics Have to Say
(Zacks) |
|
06:40PM
|
BancFirst (BANF) Q1 Earnings and Revenues Beat Estimates
(Zacks) |
|
05:37PM
|
BancFirst: Q1 Earnings Snapshot
(Associated Press Finance) |
|
05:30PM
|
BANCFIRST CORPORATION REPORTS FIRST QUARTER EARNINGS
(PR Newswire) |
|
Mar-04-24 11:26PM
|
Director Dave Lopez Sells 3,000 Shares of BancFirst Corp (BANF)
(GuruFocus.com) |
|
Jan-25-24 01:03PM
|
Hedge Fund and Insider Trading News: David Einhorn, Alden Global Capital, Ridge Capital, Aspect Capital, BancFirst Corp (BANF), Zoom Video Communications Inc (ZM), and More
(Insider Monkey) |
|
Jan-18-24 06:30PM
|
BancFirst (BANF) Reports Q4 Earnings: What Key Metrics Have to Say
(Zacks) |
|
BancFirst Corp. is a bank holding company, which provides retail and commercial banking services. Its services include commercial, real estate, agricultural and consumer lending, depository and funds transfer services, collections, safe deposit boxes, cash management services, retail brokerage services, and other services tailored for both individual and corporate customers. The firm operates through the following business segments: Metropolitan Banks, Community Banks, Pegasus, Worthington, and Other Financial Services, and Executive Operations and Support. The Metropolitan Banks segment consists of banking locations in the metropolitan Oklahoma City and Tulsa areas. The Community Banks segment consists of banking locations in communities throughout Oklahoma. The Pegasus Bank segment consists of banking locations in the Dallas metropolitan area. The Other Financial Services segment refers to specialty product business units, including guaranteed small business lending, residential mortgage lending, trust services, securities brokerage, electronic banking, and insurance. The Executive Operations and Support segment represents executive management, operational support, and corporate functions that are not allocated to the other business units. BancFirst was founded in July 1984 and is headquartered in Oklahoma City, OK. |
| Insider Trading |
Relationship |
Date |
Transaction |
Cost |
#Shares |
Value ($) |
#Shares Total |
SEC Form 4 |
| Lawrence Kevin | Executive Vice President | Apr 22 '24 | Option Exercise | 32.30 | 10,000 | 323,000 | 20,000 | Apr 22 01:11 PM | | SCHMIDT DARRYL | Executive Vice President | Apr 22 '24 | Buy | 89.71 | 232 | 20,812 | 48,939 | Apr 22 11:11 AM | | SCHMIDT DARRYL | Executive Vice President | Apr 22 '24 | Buy | 89.71 | 24 | 2,153 | 5,122 | Apr 22 11:11 AM | | Lawrence Kevin | Executive Vice President | Apr 22 '24 | Sale | 90.07 | 10,000 | 900,723 | 10,000 | Apr 22 01:11 PM | | Hannah Dennis Jay | Executive Vice President | Mar 07 '24 | Sale | 90.03 | 1,000 | 90,034 | 18,714 | Mar 07 04:38 PM |
|
|
 |
 |
| Market Cap | 363.15M | EPS (ttm) | -0.75 |
| P/E | - | EPS this Y | 57.00% |
| Forward P/E | 17.31 | EPS next Y | 283.98% |
| PEG | - | EPS past 5Y | - |
| P/S | 2.79 | EPS next 5Y | 15.00% |
| P/B | 5.13 | EPS Q/Q | -822.91% |
| Dividend | - | Sales Q/Q | 78.83% |
| Insider Own | 14.99% | Inst Own | 65.26% |
| Insider Trans | 3.34% | Inst Trans | -4.54% |
| Short Float | 20.36% | Earnings | Mar 19/a |
| Analyst Recom | 1.00 | Target Price | 25.65 |
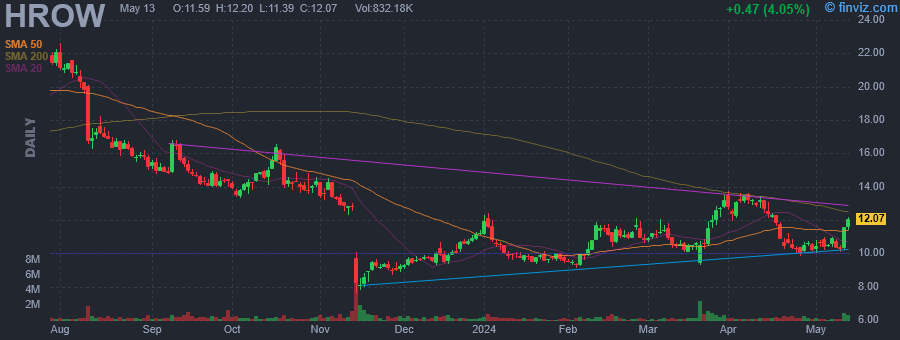
| Avg Volume | 452.40K | 52W Range | 7.60 - 28.25 |
|
|
|
|
Harrow, Inc. engages in the development, production, and sale of innovative medications. It operates through the following segments: Pharmaceutical Compounding and Pharmaceutical Drug Development. The Pharmaceutical Compounding segment focuses on the operations of the ImprimisRx business. The company was founded by Mark L. Baum and Robert J. Kammer in January 2006 and is headquartered in Nashville, TN. |
| Insider Trading |
Relationship |
Date |
Transaction |
Cost |
#Shares |
Value ($) |
#Shares Total |
SEC Form 4 |
| Opaleye Management Inc. | 10% Owner | Apr 19 '24 | Buy | 10.56 | 29,400 | 310,390 | 3,775,000 | Apr 19 06:24 PM | | Opaleye Management Inc. | 10% Owner | Mar 28 '24 | Buy | 12.82 | 50,000 | 641,000 | 3,745,600 | Mar 28 06:07 PM | | BAUM MARK L | CHIEF EXECUTIVE OFFICER | Mar 22 '24 | Buy | 11.59 | 9,000 | 104,310 | 2,137,525 | Mar 25 07:00 AM | | Opaleye Management Inc. | 10% Owner | Mar 20 '24 | Buy | 9.65 | 50,600 | 488,290 | 3,695,600 | Mar 22 11:52 AM | | SAHAREK JOHN P. | CEO of ImprimisRx | Mar 01 '24 | Option Exercise | 8.75 | 5,000 | 43,750 | 254,803 | Mar 06 06:06 AM |
|
|
|
 |
| Market Cap | 1.74B | EPS (ttm) | -0.15 |
| P/E | - | EPS this Y | 548.41% |
| Forward P/E | 22.02 | EPS next Y | 81.59% |
| PEG | - | EPS past 5Y | - |
| P/S | 0.49 | EPS next 5Y | - |
| P/B | 2.73 | EPS Q/Q | 37.98% |
| Dividend | - | Sales Q/Q | 34.43% |
| Insider Own | 12.41% | Inst Own | 61.45% |
| Insider Trans | 0.05% | Inst Trans | -0.23% |
| Short Float | 16.56% | Earnings | May 02/a |
| Analyst Recom | 3.60 | Target Price | 11.29 |
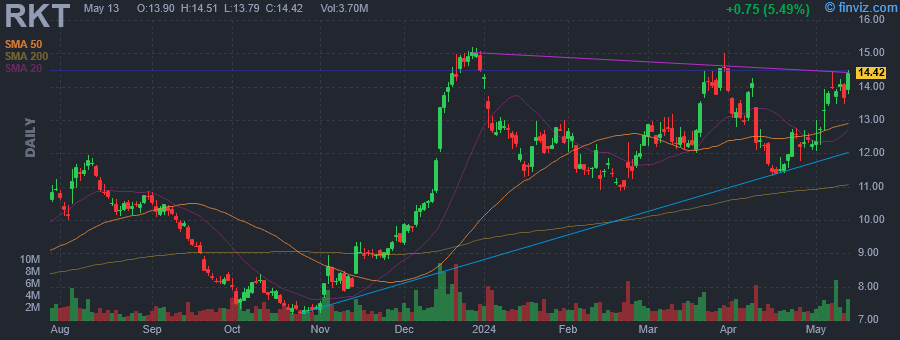
| Avg Volume | 2.43M | 52W Range | 7.17 - 15.19 |
|
|
|
|
Rocket Cos., Inc. engages in the provision of a suite of services related to homeownership and other personal financial transactions. It operates through the following segments: Direct to Consumer and Partner Network. The Direct to Consumer segment consists of performance marketing and direct engagement through the Rocket Mortgage App. The Partner Network Segment focuses on partnerships with premier consumer-focused organizations, brokers and mortgage professionals who leverage the platform and scale to provide mortgage solutions to clients. The company was founded by Daniel Gilbert in 1985 and is headquartered in Detroit, MI. |
| Insider Trading |
Relationship |
Date |
Transaction |
Cost |
#Shares |
Value ($) |
#Shares Total |
SEC Form 4 |
| Rizik Matthew | Director | Apr 19 '24 | Buy | 11.53 | 380 | 4,381 | 697,133 | Apr 19 06:01 PM | | Rizik Matthew | Director | Apr 17 '24 | Buy | 11.44 | 383 | 4,382 | 696,753 | Apr 17 06:14 PM | | Rizik Matthew | Director | Apr 16 '24 | Buy | 11.46 | 375 | 4,298 | 696,370 | Apr 17 06:14 PM | | Rizik Matthew | Director | Apr 15 '24 | Buy | 12.21 | 358 | 4,371 | 695,995 | Apr 17 06:14 PM | | Rizik Matthew | Director | Apr 12 '24 | Buy | 12.20 | 353 | 4,307 | 695,637 | Apr 12 05:04 PM |
|
|
| |
 |
| Market Cap | 10.20M | EPS (ttm) | -0.55 |
| P/E | - | EPS this Y | - |
| Forward P/E | - | EPS next Y | - |
| PEG | - | EPS past 5Y | 30.13% |
| P/S | 21.24 | EPS next 5Y | - |
| P/B | - | EPS Q/Q | 46.97% |
| Dividend | - | Sales Q/Q | -87.74% |
| Insider Own | 35.69% | Inst Own | 7.71% |
| Insider Trans | -0.19% | Inst Trans | -11.46% |
| Short Float | 3.10% | Earnings | Mar 27/a |
| Analyst Recom | 2.00 | Target Price | 4.00 |
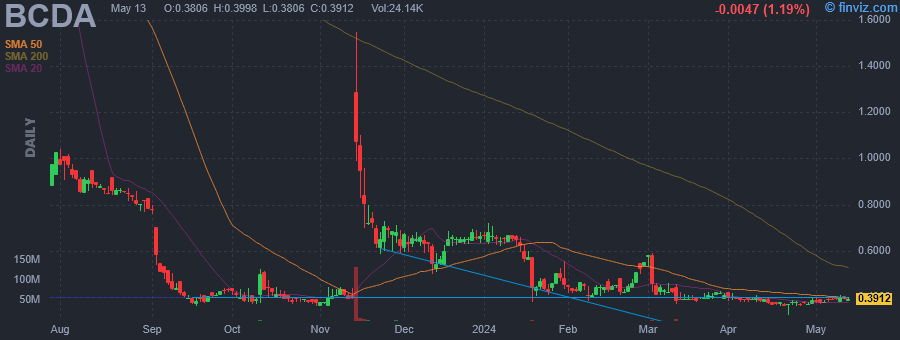
| Avg Volume | 353.64K | 52W Range | 0.32 - 2.92 |
|
|
|
|
BioCardia, Inc. is a clinical-stage biotherapeutic company. It engages in the business of developing cellular and cell-derived therapeutics for the treatment of cardiovascular and pulmonary diseases with significant unmet medical needs. The company was founded on January 12, 1994 and is headquartered in Sunnyvale, CA. |
| Insider Trading |
Relationship |
Date |
Transaction |
Cost |
#Shares |
Value ($) |
#Shares Total |
SEC Form 4 |
| Altman Peter | President and CEO | Apr 19 '24 | Buy | 0.37 | 2,750 | 1,013 | 558,697 | Apr 19 05:38 PM | | Altman Peter | President and CEO | Mar 28 '24 | Buy | 0.39 | 500 | 195 | 555,947 | Mar 28 07:33 PM | | Altman Peter | President and CEO | Feb 13 '24 | Buy | 0.46 | 108,108 | 50,000 | 555,447 | Feb 15 07:00 AM | | FROST PHILLIP MD ET AL | 10% Owner | Jan 19 '24 | Sale | 0.43 | 129,802 | 55,815 | 1,896,025 | Jan 22 08:38 PM | | Altman Peter | President and CEO | May 26 '23 | Buy | 1.60 | 6,200 | 9,920 | 469,239 | May 30 05:01 PM |
|
|
|
 |
| Market Cap | 140.65M | EPS (ttm) | -0.51 |
| P/E | - | EPS this Y | 2941.09% |
| Forward P/E | 8.17 | EPS next Y | 11.06% |
| PEG | - | EPS past 5Y | - |
| P/S | 0.93 | EPS next 5Y | - |
| P/B | 1.40 | EPS Q/Q | -115.14% |
| Dividend | - | Sales Q/Q | -19.00% |
| Insider Own | 48.17% | Inst Own | 39.24% |
| Insider Trans | 0.83% | Inst Trans | -1.53% |
| Short Float | 3.85% | Earnings | Feb 22/a |
| Analyst Recom | 2.67 | Target Price | 2.75 |
| Avg Volume | 655.99K | 52W Range | 1.40 - 8.47 |
|
|
|
|
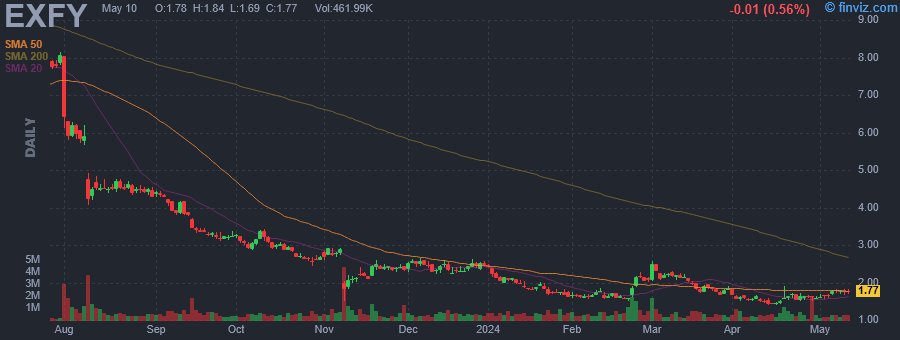
Expensify, Inc. engages in the provision of a cloud-based expense management software platform that helps the smallest to the largest businesses simplify the way they manage money. It operates under the United States and All Other Locations geographical segments. The company was founded by David Barrett and Witold Stankiewicz on May 1, 2008 and is headquartered in Portland, OR. |
| Insider Trading |
Relationship |
Date |
Transaction |
Cost |
#Shares |
Value ($) |
#Shares Total |
SEC Form 4 |
| Barrett David Michael | Chief Executive Officer | Apr 22 '24 | Sale | 1.68 | 14,844 | 24,938 | 1,086,605 | Apr 22 06:45 PM | | Barrett David Michael | Chief Executive Officer | Apr 19 '24 | Sale | 1.57 | 15,800 | 24,806 | 1,101,449 | Apr 22 06:45 PM | | McLaughlin Steven J. | 10% Owner | Apr 18 '24 | Buy | 1.59 | 8,481 | 13,485 | 8,998,125 | Apr 19 04:15 PM | | Barrett David Michael | Chief Executive Officer | Apr 18 '24 | Sale | 1.66 | 15,000 | 24,900 | 1,117,249 | Apr 22 06:45 PM | | McLaughlin Steven J. | 10% Owner | Apr 17 '24 | Buy | 1.50 | 135,158 | 202,737 | 8,989,644 | Apr 19 04:15 PM |
|
|
| |
 |
| Market Cap | 4.76B | EPS (ttm) | 3.64 |
| P/E | 15.49 | EPS this Y | 46.93% |
| Forward P/E | 8.38 | EPS next Y | 8.92% |
| PEG | - | EPS past 5Y | - |
| P/S | 0.21 | EPS next 5Y | -0.20% |
| P/B | 4.87 | EPS Q/Q | -453.27% |
| Dividend | 6.13% | Sales Q/Q | -4.68% |
| Insider Own | 35.14% | Inst Own | 28.16% |
| Insider Trans | -0.02% | Inst Trans | -3.76% |
| Short Float | 5.25% | Earnings | May 08/b |
| Analyst Recom | 2.57 | Target Price | 62.00 |
| Avg Volume | 454.90K | 52W Range | 41.95 - 64.89 |
|
|
|
Apr-22-24 02:07PM
|
Hedge Fund and Insider Trading News: Stan Druckenmiller, Ken Griffin, Larry Robbins, Ray Dalio, Baupost Group, Elliott Management, Aspect Capital, RXO, Inc. (RXO), Sunoco LP (SUN), and More
(Insider Monkey) |
|
Apr-18-24 05:50PM
|
Sunoco LP (SUN) Rises As Market Takes a Dip: Key Facts
(Zacks) |
|
12:13PM
|
Sunoco (SUN) Proceeds With Strategic Portfolio Optimization
(Zacks) |
|
Apr-17-24 07:00AM
|
Sunoco LP Completes Acquisition of European Liquid Fuels Terminals and Divestiture of West Texas Assets; Reaffirms 2024 Adjusted EBITDA Guidance Range
(PR Newswire) +5.61% |
|
Apr-16-24 05:37PM
|
Sunoco LP Announces Pricing of Private Offering of Senior Notes
(PR Newswire) |
|
08:30AM
|
Sunoco LP Announces Private Offering of Senior Notes
(PR Newswire) |
|
Apr-12-24 05:50PM
|
Sunoco LP (SUN) Stock Moves -1.4%: What You Should Know
(Zacks) |
|
09:40AM
|
Is Sunoco (SUN) Stock Undervalued Right Now?
(Zacks) |
|
Apr-10-24 09:35AM
|
Sunoco LP (SUN) Loses -9.91% in 4 Weeks, Here's Why a Trend Reversal May be Around the Corner
(Zacks) |
|
Apr-09-24 06:00PM
|
Sunoco LP (SUN) Stock Declines While Market Improves: Some Information for Investors
(Zacks) |
|
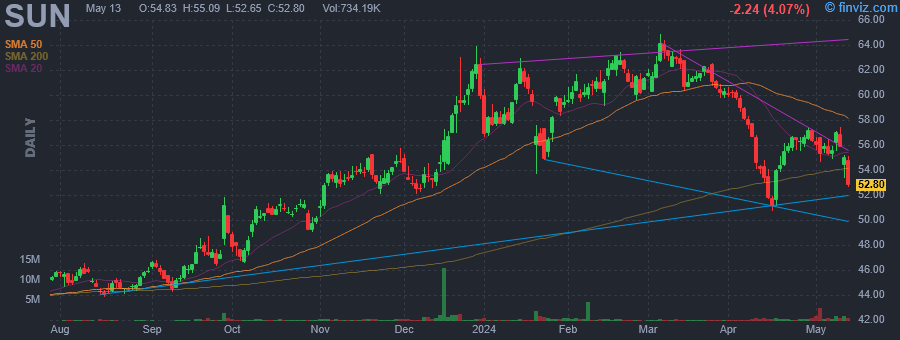
Sunoco LP engages in the management and distribution of fuel products. It operates through Fuel Distribution and Marketing and All Other segments. The Fuel Distribution and Marketing segment supplies fuels and other petroleum products, which it supplies to third-party dealers and distributors, independent operators of commission agent, other commercial consumers of motor fuel and to retail locations. The All Other segment refers to motor fuel sales, non-motor fuel sales, and lease income. The company was founded in 1886 and is headquartered in Dallas, TX. |
| Insider Trading |
Relationship |
Date |
Transaction |
Cost |
#Shares |
Value ($) |
#Shares Total |
SEC Form 4 |
| Skidmore David K | Director | Apr 17 '24 | Buy | 52.10 | 1,500 | 78,144 | 14,608 | Apr 19 04:10 PM | | Dodderer Arnold | GC & Asst. Sec. | Dec 05 '23 | Sale | 53.20 | 7,832 | 416,623 | 77,890 | Dec 07 06:17 PM |
|
|
|
 |
| Market Cap | 91.48M | EPS (ttm) | 0.34 |
| P/E | 28.15 | EPS this Y | - |
| Forward P/E | - | EPS next Y | - |
| PEG | 1.88 | EPS past 5Y | 25.97% |
| P/S | 1.74 | EPS next 5Y | 15.00% |
| P/B | 2.49 | EPS Q/Q | 140.83% |
| Dividend | - | Sales Q/Q | 29.13% |
| Insider Own | 10.71% | Inst Own | 58.63% |
| Insider Trans | 1.06% | Inst Trans | -1.15% |
| Short Float | 0.49% | Earnings | Mar 14/a |
| Analyst Recom | 1.00 | Target Price | 17.00 |
| Avg Volume | 27.48K | 52W Range | 6.22 - 11.41 |
|
|
|
|
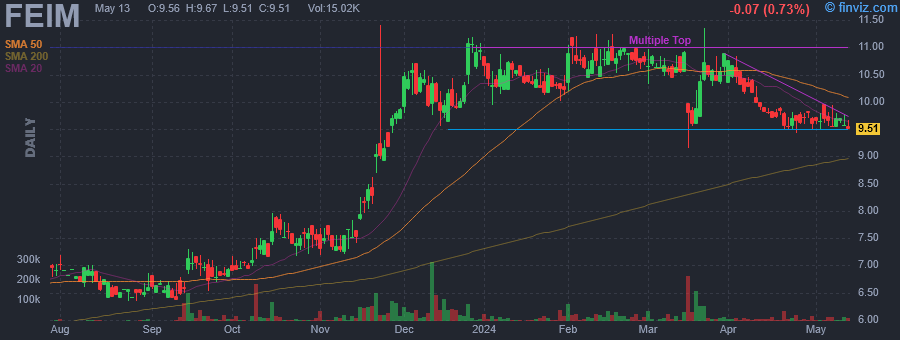
Frequency Electronics, Inc. engages in the design, development, and manufacture of precision time and frequency generation technology. It operates through the FEI-NY and FEI-Zyfer business segments. The FEI-NY segment provides precision time, frequency generation, and synchronization products and subsystems that are found on-board satellites, in ground-based communication stations, and imbedded in moving platforms. The FEI-Zyfer segment designs, develops, and manufactures products for precision time and frequency generation and synchronization, primarily incorporating GPS technology. The company was founded by Martin B. Bloch on August 25, 1961 and is headquartered in Mitchel Field, NY. |
| Insider Trading |
Relationship |
Date |
Transaction |
Cost |
#Shares |
Value ($) |
#Shares Total |
SEC Form 4 |
| Sarachek Russell M | Director | Apr 15 '24 | Buy | 9.77 | 658 | 6,429 | 433,745 | Apr 19 03:03 PM | | Edenbrook Capital, LLC | Director | Mar 20 '24 | Buy | 9.94 | 10,000 | 99,400 | 1,602,306 | Mar 22 04:54 PM | | Sarachek Russell M | Director | Sep 22 '23 | Buy | 6.73 | 4,928 | 33,165 | 433,087 | Sep 27 01:35 PM | | Sarachek Russell M | Director | Sep 19 '23 | Buy | 6.96 | 5,163 | 35,934 | 428,159 | Sep 20 06:00 PM |
|
|
| |
 |
| Market Cap | 153.11M | EPS (ttm) | -0.56 |
| P/E | - | EPS this Y | - |
| Forward P/E | - | EPS next Y | - |
| PEG | - | EPS past 5Y | 12.65% |
| P/S | 76.94 | EPS next 5Y | - |
| P/B | 3.79 | EPS Q/Q | 20.97% |
| Dividend | - | Sales Q/Q | 19.16% |
| Insider Own | 41.63% | Inst Own | 36.70% |
| Insider Trans | 0.11% | Inst Trans | 27.76% |
| Short Float | 10.62% | Earnings | - |
| Analyst Recom | 1.00 | Target Price | 15.00 |
| Avg Volume | 204.37K | 52W Range | 2.12 - 5.80 |
|
|
|
|
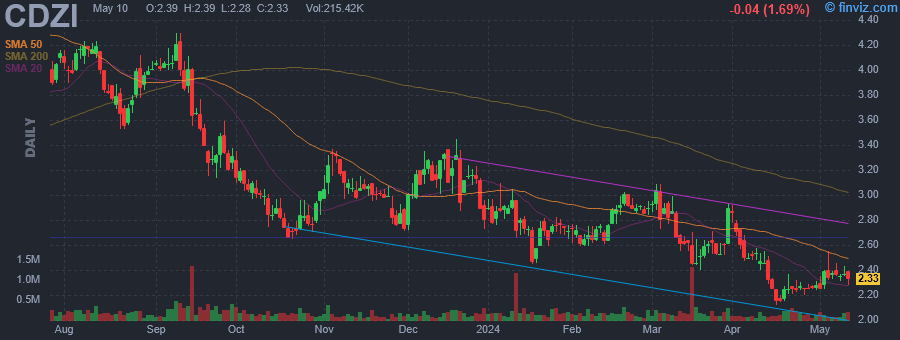
Cadiz, Inc. is a land and water resource development company, which engages in the acquisition and development of land with water resources for various uses such as groundwater supply, groundwater storage, and agriculture. The firm's project includes the Cadiz Valley Water Conservation, Recovery and Storage. The company was founded by Keith Brackpool in 1983 and is headquartered in Los Angeles, CA. |
| Insider Trading |
Relationship |
Date |
Transaction |
Cost |
#Shares |
Value ($) |
#Shares Total |
SEC Form 4 |
| Kennedy Susan P | CEO | Apr 18 '24 | Buy | 2.25 | 25,000 | 56,250 | 966,921 | Apr 19 09:47 AM | | Kennedy Susan P | CEO | Jan 04 '24 | Buy | 2.81 | 6,762 | 18,999 | 91,921 | Jan 04 02:22 PM | | Hickox Winston H | Director | Sep 25 '23 | Buy | 3.30 | 3,030 | 9,999 | 176,685 | Sep 27 07:25 PM | | Kennedy Susan P | Executive Director | Sep 21 '23 | Buy | 3.17 | 15,822 | 50,156 | 85,159 | Sep 21 12:49 PM | | Dreyfus Maria S. | Director | Jul 13 '23 | Buy | 3.50 | 100,000 | 350,000 | 110,791 | Jul 17 08:54 AM |
|
|
|
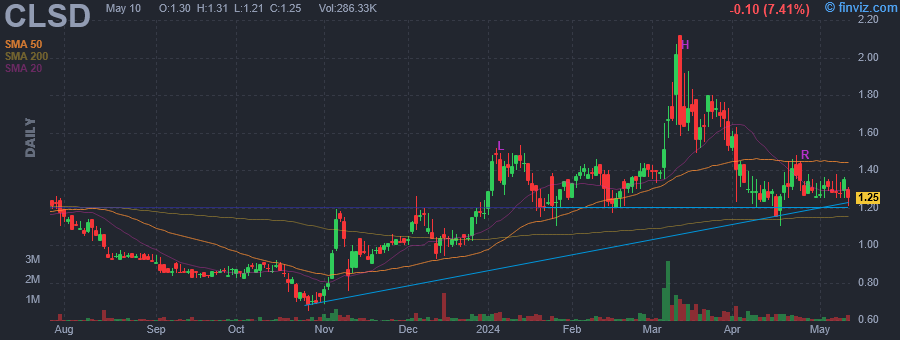 |
| Market Cap | 100.12M | EPS (ttm) | -0.53 |
| P/E | - | EPS this Y | 0.89% |
| Forward P/E | - | EPS next Y | -10.28% |
| PEG | - | EPS past 5Y | 27.88% |
| P/S | 12.17 | EPS next 5Y | - |
| P/B | - | EPS Q/Q | 51.62% |
| Dividend | - | Sales Q/Q | 1822.73% |
| Insider Own | 15.82% | Inst Own | 13.29% |
| Insider Trans | 6.10% | Inst Trans | -7.09% |
| Short Float | 0.36% | Earnings | Mar 12/a |
| Analyst Recom | 1.00 | Target Price | 5.40 |
| Avg Volume | 366.21K | 52W Range | 0.65 - 2.12 |
|
|
|
|
Clearside Biomedical, Inc. is a biopharmaceutical company, which delivers therapies to the back of the eye through the suprachoroidal space. Its pipeline include CLS-AX, Integrin Inhibitor, and gene therapy. The company was founded by Samir Kumar Patel, Vladimir Zarnitsyn, Mark Prausnitz, Daniel H. White, and Henry F. Edelhauser in May 2011 and is headquartered in Alpharetta, GA. |
| Insider Trading |
Relationship |
Date |
Transaction |
Cost |
#Shares |
Value ($) |
#Shares Total |
SEC Form 4 |
| Gibney Anthony S | Director | Apr 18 '24 | Buy | 1.30 | 93,290 | 121,277 | 100,000 | Apr 19 09:45 AM | | Gibney Anthony S | Director | Apr 17 '24 | Buy | 1.25 | 6,710 | 8,388 | 6,710 | Apr 19 09:45 AM | | Chong Ngai Hang Victor | CHIEF MEDICAL OFFICER | Mar 20 '24 | Buy | 1.60 | 30,000 | 48,000 | 30,000 | Mar 20 04:30 PM | | WHITMORE BRADFORD T | 10% Owner | Feb 07 '24 | Buy | 1.35 | 444,444 | 599,999 | 4,495,034 | Feb 09 01:00 PM | | LASEZKAY GEORGE M | CEO | Jan 19 '24 | Sale | 1.27 | 18,000 | 22,860 | 466,577 | Jan 19 06:26 PM |
|
|
|
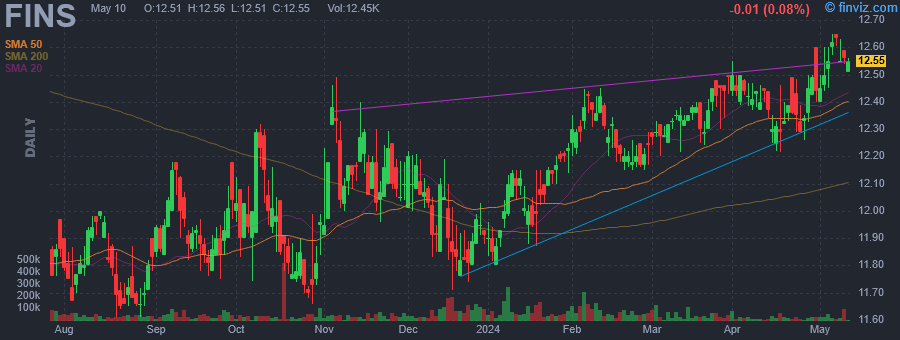 |
| Market Cap | 308.02M | EPS (ttm) | 0.30 |
| P/E | 40.97 | EPS this Y | - |
| Forward P/E | - | EPS next Y | - |
| PEG | - | EPS past 5Y | - |
| P/S | 9.79 | EPS next 5Y | - |
| P/B | 0.89 | EPS Q/Q | - |
| Dividend | 9.35% | Sales Q/Q | -1.50% |
| Insider Own | 6.01% | Inst Own | 48.69% |
| Insider Trans | 0.38% | Inst Trans | - |
| Short Float | 0.08% | Earnings | - |
| Analyst Recom | - | Target Price | - |
| Avg Volume | 56.72K | 52W Range | 11.57 - 12.55 |
|
|
|
|
|
| Insider Trading |
Relationship |
Date |
Transaction |
Cost |
#Shares |
Value ($) |
#Shares Total |
SEC Form 4 |
| Palsson Johannes | Portfolio Manager | Apr 18 '24 | Buy | 12.39 | 5,670 | 70,251 | 46,403 | Apr 19 09:01 AM |
|
|
|
