 |
| Market Cap | 2.94B | EPS (ttm) | -0.23 |
| P/E | - | EPS this Y | 40.16% |
| Forward P/E | 51.45 | EPS next Y | 398.88% |
| PEG | - | EPS past 5Y | - |
| P/S | 17.88 | EPS next 5Y | 20.00% |
| P/B | 5.49 | EPS Q/Q | -85.56% |
| Dividend | - | Sales Q/Q | -2.23% |
| Insider Own | 22.57% | Inst Own | 67.10% |
| Insider Trans | -14.48% | Inst Trans | 54.35% |
| Short Float | 8.73% | Earnings | Feb 27/a |
| Analyst Recom | 1.46 | Target Price | 26.36 |
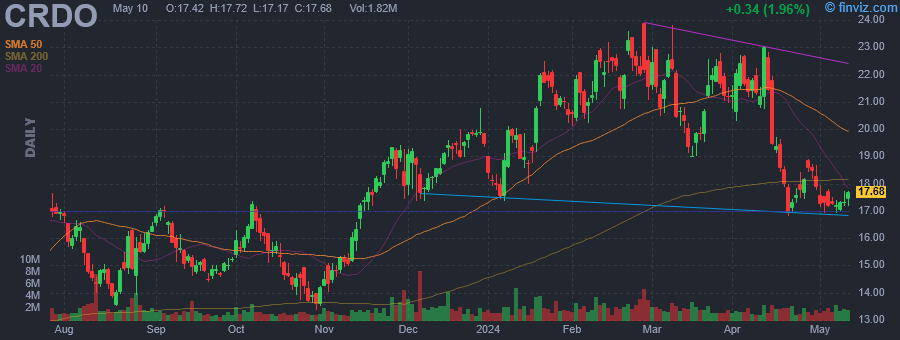
| Avg Volume | 2.20M | 52W Range | 7.20 - 23.90 |
|
|
|
|
Credo Technology Group Holding Ltd. engages in the development of connectivity solutions and products for the data infrastructure market. Its products include integrated circuits, active electrical cables, and SerDes chiplets. The company was founded by Chi Fung Cheng and Yat Tung Lam in September 2014 and is headquartered in George Town, Cayman Islands. |
| Insider Trading |
Relationship |
Date |
Transaction |
Cost |
#Shares |
Value ($) |
#Shares Total |
SEC Form 4 |
| Brennan William Joseph | Pres & Chief Executive Officer | Nov 17 '27 | Sale | 17.71 | 15,000 | 265,662 | 3,867,421 | Nov 17 08:52 PM | | Brennan William Joseph | Pres & Chief Executive Officer | Oct 24 '24 | Sale | 14.45 | 15,000 | 216,762 | 3,927,421 | Oct 24 05:51 PM | | Brennan William Joseph | Pres & Chief Executive Officer | Apr 18 '24 | Sale | 18.14 | 15,000 | 272,054 | 2,977,500 | Apr 18 05:27 PM | | Brennan William Joseph | Pres & Chief Executive Officer | Apr 17 '24 | Sale | 19.16 | 15,000 | 287,421 | 2,992,500 | Apr 18 05:27 PM | | Lam Yat Tung | Chief Operating Officer | Apr 11 '24 | Sale | 22.72 | 78,127 | 1,774,709 | 720,000 | Apr 15 06:18 PM |
|
|
 |
 |
| Market Cap | 1.60B | EPS (ttm) | -1.55 |
| P/E | - | EPS this Y | -9.14% |
| Forward P/E | - | EPS next Y | -7.82% |
| PEG | - | EPS past 5Y | -43.41% |
| P/S | 35.83 | EPS next 5Y | 12.00% |
| P/B | 3.73 | EPS Q/Q | -28.81% |
| Dividend | - | Sales Q/Q | -20.36% |
| Insider Own | 32.04% | Inst Own | 77.36% |
| Insider Trans | -1.60% | Inst Trans | 4.61% |
| Short Float | 27.11% | Earnings | Feb 27/a |
| Analyst Recom | 2.43 | Target Price | 13.00 |
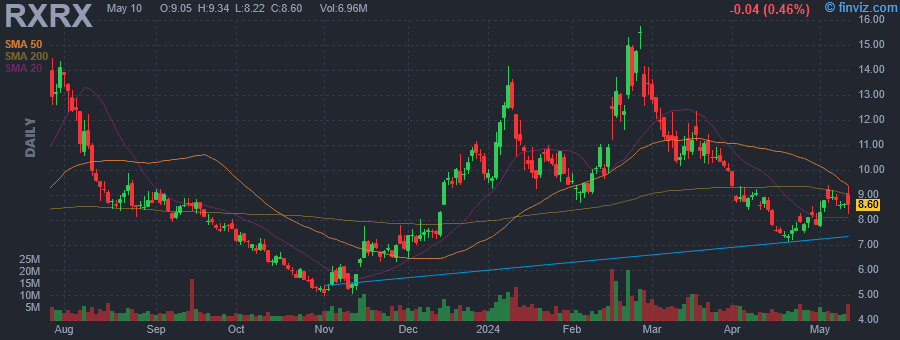
| Avg Volume | 6.33M | 52W Range | 4.54 - 16.75 |
|
|
|
|
Recursion Pharmaceuticals, Inc. is a clinical-stage biotechnology company that combines automation, artificial intelligence, machine learning, and in vivo validation capabilities to discover novel medicines. Its Recursion operating system enables advanced machine learning approaches to reveal drug candidates, mechanisms of action, novel chemistry, and potential toxicity, with the eventual goal of decoding biology and advancing new therapeutics that radically improve people's lives. The company was founded by Blake Borgeson, Christopher C. Gibson, and Dean Y. Li on November 5, 2013 and is headquartered in Salt Lake City, UT. |
| Insider Trading |
Relationship |
Date |
Transaction |
Cost |
#Shares |
Value ($) |
#Shares Total |
SEC Form 4 |
| Secora Michael | Chief Financial Officer | Apr 17 '24 | Option Exercise | 2.22 | 37,500 | 83,250 | 1,254,179 | Apr 18 05:12 PM | | Secora Michael | Chief Financial Officer | Apr 17 '24 | Sale | 7.58 | 23,124 | 175,349 | 1,231,055 | Apr 18 05:12 PM | | Secora Michael | Chief Financial Officer | Apr 16 '24 | Option Exercise | 2.22 | 37,500 | 83,250 | 1,241,679 | Apr 18 05:12 PM | | Secora Michael | Chief Financial Officer | Apr 16 '24 | Sale | 7.67 | 25,000 | 191,658 | 1,216,679 | Apr 18 05:12 PM | | Borgeson Blake | Director | Apr 16 '24 | Sale | 7.66 | 11,447 | 87,725 | 7,229,861 | Apr 18 05:12 PM |
|
|
|
 |
| Market Cap | 7.13B | EPS (ttm) | 1.46 |
| P/E | 19.90 | EPS this Y | 8.08% |
| Forward P/E | 12.41 | EPS next Y | 47.91% |
| PEG | - | EPS past 5Y | 22.39% |
| P/S | 1.10 | EPS next 5Y | -10.85% |
| P/B | 1.80 | EPS Q/Q | -28.60% |
| Dividend | 1.19% | Sales Q/Q | -8.10% |
| Insider Own | 53.37% | Inst Own | 43.33% |
| Insider Trans | -0.11% | Inst Trans | -1.85% |
| Short Float | 2.71% | Earnings | Apr 29/a |
| Analyst Recom | 2.00 | Target Price | 36.34 |
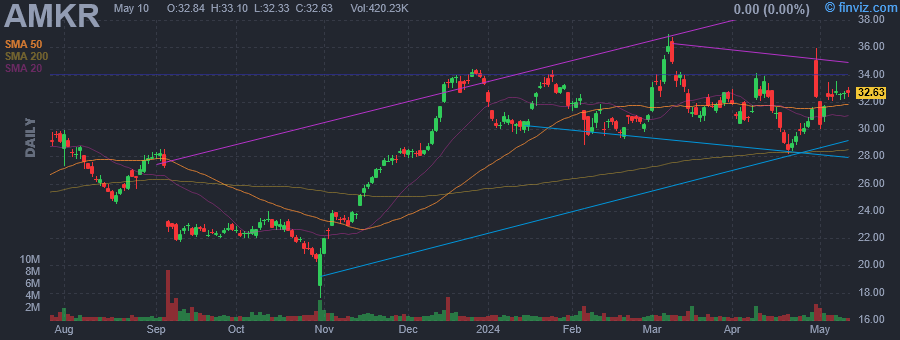
| Avg Volume | 933.36K | 52W Range | 17.58 - 37.00 |
|
|
|
|
Amkor Technology, Inc. engages in the provision of outsourced semiconductor packaging and test services. Its services include design, package characterization, test, and wafer bumping services. The company was founded in 1968 and is headquartered in Tempe, AZ. |
| Insider Trading |
Relationship |
Date |
Transaction |
Cost |
#Shares |
Value ($) |
#Shares Total |
SEC Form 4 |
| Rutten Guillaume Marie Jean | President and CEO | Apr 16 '24 | Option Exercise | 14.17 | 15,000 | 212,550 | 139,476 | Apr 18 05:12 PM | | Rutten Guillaume Marie Jean | President and CEO | Apr 16 '24 | Sale | 31.17 | 25,000 | 779,250 | 114,476 | Apr 18 05:12 PM | | Rutten Guillaume Marie Jean | President and CEO | Mar 15 '24 | Option Exercise | 14.17 | 15,000 | 212,550 | 149,476 | Mar 19 05:46 PM | | Faust Megan | CFO | Mar 15 '24 | Option Exercise | 9.48 | 2,800 | 26,544 | 55,823 | Mar 19 05:43 PM | | Rutten Guillaume Marie Jean | President and CEO | Mar 15 '24 | Sale | 31.23 | 25,000 | 780,750 | 124,476 | Mar 19 05:46 PM |
|
|
| |
 |
| Market Cap | 315.44B | EPS (ttm) | 15.28 |
| P/E | 46.53 | EPS this Y | 13.30% |
| Forward P/E | 40.85 | EPS next Y | 8.52% |
| PEG | 4.68 | EPS past 5Y | 14.83% |
| P/S | 1.27 | EPS next 5Y | 9.95% |
| P/B | 15.20 | EPS Q/Q | 18.82% |
| Dividend | 2.71% | Sales Q/Q | 5.75% |
| Insider Own | 0.47% | Inst Own | 70.02% |
| Insider Trans | -1.58% | Inst Trans | 0.27% |
| Short Float | 1.44% | Earnings | Mar 07/a |
| Analyst Recom | 1.95 | Target Price | 773.78 |
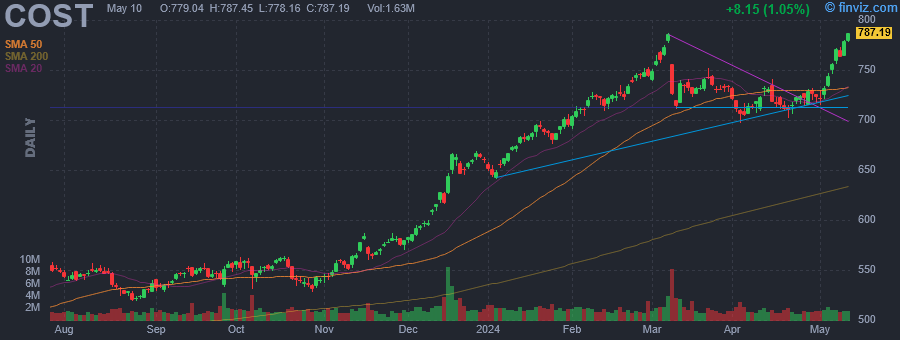
| Avg Volume | 2.10M | 52W Range | 466.15 - 787.08 |
|
|
|
|
Costco Wholesale Corp. engages in the operation of membership warehouses through wholly owned subsidiaries. It operates through the following geographical segments: United States, Canada, and Other International Operations. The company was founded by James D. Sinegal and Jeffrey H. Brotman in 1983 and is headquartered in Issaquah, WA. |
| Insider Trading |
Relationship |
Date |
Transaction |
Cost |
#Shares |
Value ($) |
#Shares Total |
SEC Form 4 |
| Miller Russell D | Senior EVP | Apr 17 '24 | Sale | 722.86 | 785 | 567,443 | 10,000 | Apr 18 05:11 PM | | Callans Patrick J | Executive VP | Mar 11 '24 | Sale | 714.86 | 2,500 | 1,787,150 | 62,895 | Mar 13 04:35 PM | | Adamo Claudine | Executive Vice President | Mar 11 '24 | Sale | 714.83 | 1,500 | 1,072,238 | 6,695 | Mar 13 06:54 PM | | DECKER SUSAN L | Director | Feb 09 '24 | Sale | 723.48 | 1,442 | 1,043,257 | 12,395 | Feb 12 04:37 PM | | JELINEK W CRAIG | Director | Jan 23 '24 | Sale | 685.93 | 8,000 | 5,487,456 | 216,212 | Jan 23 06:55 PM |
|
|
|
 |
| Market Cap | 396.76M | EPS (ttm) | -1.28 |
| P/E | - | EPS this Y | 8.62% |
| Forward P/E | - | EPS next Y | 15.41% |
| PEG | - | EPS past 5Y | -0.33% |
| P/S | 6.06 | EPS next 5Y | - |
| P/B | 18.86 | EPS Q/Q | 48.44% |
| Dividend | - | Sales Q/Q | 40.84% |
| Insider Own | 54.25% | Inst Own | 30.65% |
| Insider Trans | -3.69% | Inst Trans | -1.27% |
| Short Float | 0.66% | Earnings | Mar 05/a |
| Analyst Recom | 1.29 | Target Price | 17.29 |
| Avg Volume | 105.37K | 52W Range | 3.80 - 18.15 |
|
|
|
|
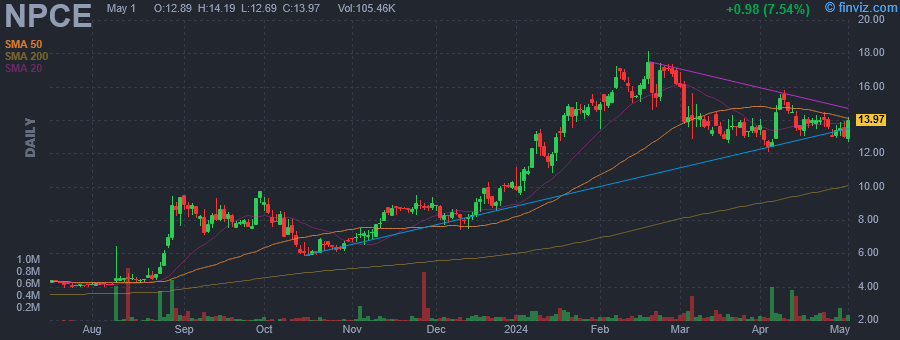
NeuroPace, Inc. develops, manufactures, and markets implantable devices for treating epilepsy and neurological disorders. It offers implantable components, which include the RNS neurostimulator as well as depth and cortical strip leads. The firm's RNS System is designed for the treatment of medically refractory partial epilepsy and includes implantable and external products. The company was founded by Rebecca L. Kuhn, Frank M. Fischer on November 19, 1997 and is headquartered in Mountain View, CA. |
| Insider Trading |
Relationship |
Date |
Transaction |
Cost |
#Shares |
Value ($) |
#Shares Total |
SEC Form 4 |
| ORBIMED ADVISORS LLC | 10% Owner | Apr 18 '24 | Sale | 14.06 | 2,623 | 36,879 | 3,501,975 | Apr 18 05:10 PM | | ORBIMED ADVISORS LLC | 10% Owner | Apr 17 '24 | Sale | 14.15 | 300 | 4,245 | 3,504,598 | Apr 18 05:10 PM | | ORBIMED ADVISORS LLC | 10% Owner | Apr 16 '24 | Sale | 14.01 | 14,069 | 197,107 | 3,504,898 | Apr 18 05:10 PM | | ORBIMED ADVISORS LLC | 10% Owner | Apr 12 '24 | Sale | 14.42 | 23,101 | 333,116 | 3,518,967 | Apr 15 05:25 PM | | ORBIMED ADVISORS LLC | 10% Owner | Apr 11 '24 | Sale | 14.49 | 461,899 | 6,692,917 | 3,542,068 | Apr 15 05:25 PM |
|
|
| |
 |
| Market Cap | 7.14B | EPS (ttm) | 3.79 |
| P/E | 41.74 | EPS this Y | -4.20% |
| Forward P/E | 31.18 | EPS next Y | 17.32% |
| PEG | - | EPS past 5Y | 16.97% |
| P/S | 1.66 | EPS next 5Y | -6.40% |
| P/B | 4.80 | EPS Q/Q | -276.50% |
| Dividend | - | Sales Q/Q | 8.43% |
| Insider Own | 1.59% | Inst Own | 104.18% |
| Insider Trans | -10.09% | Inst Trans | 0.30% |
| Short Float | 5.43% | Earnings | Feb 14/b |
| Analyst Recom | 2.50 | Target Price | 175.33 |
| Avg Volume | 308.05K | 52W Range | 116.81 - 188.01 |
|
|
|
|
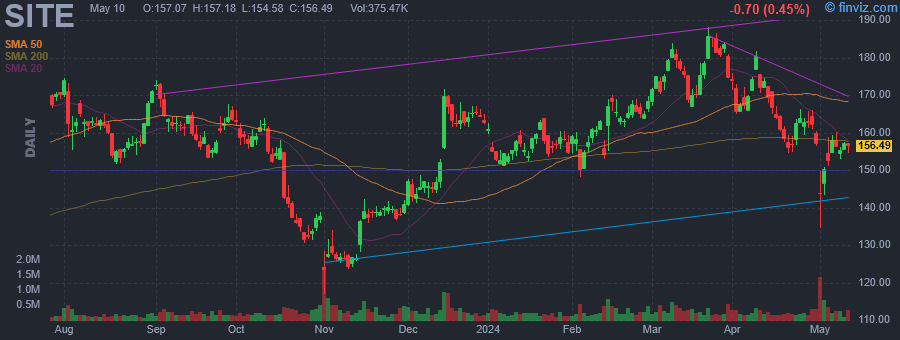
SiteOne Landscape Supply, Inc. engages in the distribution of landscape supplies and residential. Its products include hardscapes, landscape accessories, nursery goods, outdoor lighting, and ice melt products for green industry professionals. The company was founded in 2001 and is headquartered in Roswell, GA. |
| Insider Trading |
Relationship |
Date |
Transaction |
Cost |
#Shares |
Value ($) |
#Shares Total |
SEC Form 4 |
| BLACK DOUG | CEO | Apr 17 '24 | Option Exercise | 38.73 | 10,000 | 387,300 | 584,657 | Apr 18 05:02 PM | | BLACK DOUG | CEO | Apr 17 '24 | Sale | 162.10 | 10,000 | 1,621,000 | 574,657 | Apr 18 05:02 PM | | BLACK DOUG | CEO | Mar 13 '24 | Option Exercise | 38.73 | 10,000 | 387,300 | 584,657 | Mar 14 04:13 PM | | BLACK DOUG | CEO | Mar 13 '24 | Sale | 176.35 | 10,000 | 1,763,500 | 574,657 | Mar 14 04:13 PM | | GUTHRIE JOHN T | EVP, CFO and Assistant Sec. | Mar 08 '24 | Option Exercise | 51.59 | 3,000 | 154,770 | 18,467 | Mar 11 04:05 PM |
|
|
|
 |
| Market Cap | 103.72M | EPS (ttm) | -1.10 |
| P/E | - | EPS this Y | 24.78% |
| Forward P/E | - | EPS next Y | -35.24% |
| PEG | - | EPS past 5Y | -23.84% |
| P/S | 610.11 | EPS next 5Y | - |
| P/B | 5.31 | EPS Q/Q | -77.51% |
| Dividend | - | Sales Q/Q | -100.00% |
| Insider Own | 26.37% | Inst Own | 21.72% |
| Insider Trans | -3.25% | Inst Trans | - |
| Short Float | 9.51% | Earnings | Apr 01/b |
| Analyst Recom | 1.00 | Target Price | 26.00 |
| Avg Volume | 132.91K | 52W Range | 3.42 - 40.98 |
|
|
|
|
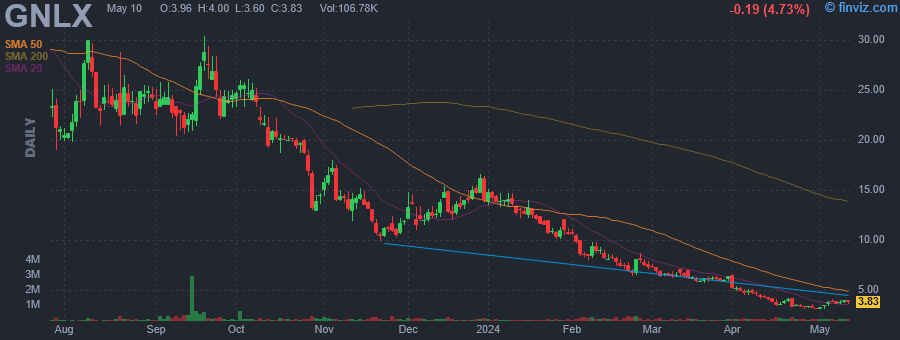
Genelux Corp. manufactures and markets drugs and virus strains solutions. It provides drug research, development, and clinical trial services for the healthcare industry. The company was founded by Aladar Szalay in 2001 and is headquartered in Westlake Village, CA. |
| Insider Trading |
Relationship |
Date |
Transaction |
Cost |
#Shares |
Value ($) |
#Shares Total |
SEC Form 4 |
| Szalay Aladar | 10% Owner | Apr 17 '24 | Sale | 3.71 | 22,737 | 84,425 | 1,300,125 | Apr 18 05:00 PM | | Szalay Aladar | 10% Owner | Apr 16 '24 | Sale | 3.53 | 48,683 | 171,802 | 1,322,862 | Apr 18 05:00 PM | | Yu Yong | VP, Clinical Trial Operations | Dec 15 '23 | Sale | 13.16 | 32,535 | 428,180 | 0 | Dec 18 04:15 PM | | Thomas John | Director | Dec 13 '23 | Sale | 13.38 | 9,000 | 120,387 | 463,460 | Dec 14 08:58 PM | | Tyree James L | Director | Dec 13 '23 | Sale | 13.22 | 9,000 | 118,969 | 3,460 | Dec 14 08:59 PM |
|
|
| |
 |
| Market Cap | 1.66B | EPS (ttm) | -1.04 |
| P/E | - | EPS this Y | 80.49% |
| Forward P/E | 84.48 | EPS next Y | 541.75% |
| PEG | - | EPS past 5Y | -25.28% |
| P/S | 3.28 | EPS next 5Y | 30.00% |
| P/B | 1.68 | EPS Q/Q | 53.01% |
| Dividend | - | Sales Q/Q | 15.47% |
| Insider Own | 8.61% | Inst Own | 70.62% |
| Insider Trans | -7.87% | Inst Trans | -4.62% |
| Short Float | 8.31% | Earnings | May 01/a |
| Analyst Recom | 2.29 | Target Price | 21.28 |
| Avg Volume | 4.23M | 52W Range | 11.61 - 25.87 |
|
|
|
|
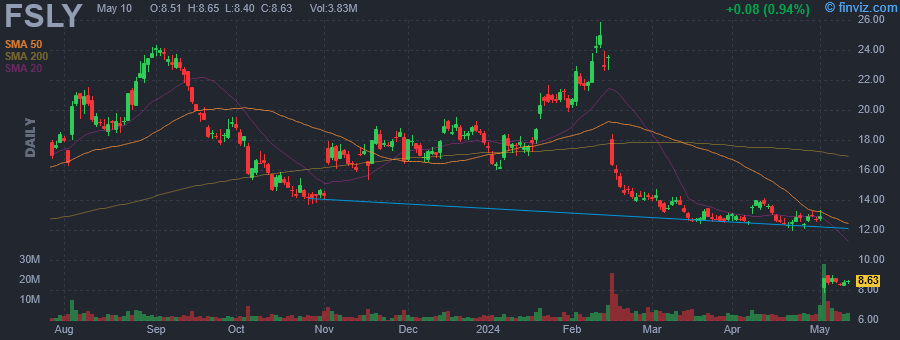
Fastly, Inc. provides real-time content delivery network services. It offers edge compute, edge delivery, edge security, edge applications like load balancing and image optimization, video on demand, and managed edge delivery. The company was founded by Artur Bergman, Tyler McMullen, Simon Wistow, and Gil Penchina in March 2011 and is headquartered in San Francisco, CA. |
| Insider Trading |
Relationship |
Date |
Transaction |
Cost |
#Shares |
Value ($) |
#Shares Total |
SEC Form 4 |
| KISLING RONALD W | Chief Financial Officer | Apr 16 '24 | Sale | 13.00 | 7,486 | 97,318 | 632,736 | Apr 18 05:00 PM | | KISLING RONALD W | Chief Financial Officer | Apr 01 '24 | Sale | 12.92 | 12,000 | 155,040 | 640,222 | Apr 03 05:32 PM | | Daniels Richard Devon | Director | Mar 15 '24 | Sale | 12.66 | 7,766 | 98,318 | 34,328 | Mar 19 05:18 PM | | KISLING RONALD W | Chief Financial Officer | Feb 29 '24 | Sale | 14.33 | 1,192 | 17,081 | 513,057 | Mar 04 06:08 PM | | Nightingale Todd | CEO | Feb 26 '24 | Sale | 13.93 | 48,640 | 677,555 | 1,607,821 | Feb 27 05:42 PM |
|
|
|
 |
| Market Cap | 17.07B | EPS (ttm) | -0.54 |
| P/E | - | EPS this Y | 69.39% |
| Forward P/E | 140.95 | EPS next Y | 85.54% |
| PEG | - | EPS past 5Y | -4.47% |
| P/S | 18.21 | EPS next 5Y | - |
| P/B | 18.50 | EPS Q/Q | -103.02% |
| Dividend | - | Sales Q/Q | 48.08% |
| Insider Own | 66.84% | Inst Own | 26.87% |
| Insider Trans | -1.94% | Inst Trans | 3.63% |
| Short Float | 6.60% | Earnings | Mar 07/a |
| Analyst Recom | 1.86 | Target Price | 41.85 |
| Avg Volume | 3.90M | 52W Range | 16.63 - 40.54 |
|
|
|
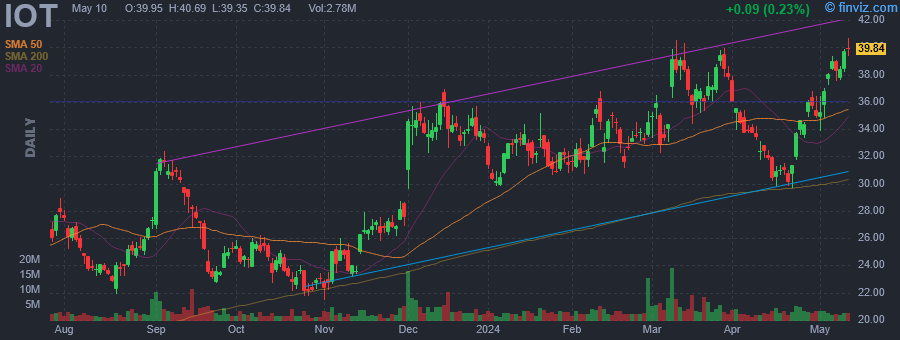
|
Samsara, Inc. develops Internet connected sensor systems. It combines plug-and-play sensors, wireless connectivity, and cloud-hosted software integrated for deployment. The company was founded by John Bicket and Sanjit Biswas in 2015 and is headquartered in San Francisco, CA. |
| Insider Trading |
Relationship |
Date |
Transaction |
Cost |
#Shares |
Value ($) |
#Shares Total |
SEC Form 4 |
| Biswas Sanjit | CHIEF EXECUTIVE OFFICER | Apr 16 '24 | Sale | 30.73 | 96,000 | 2,950,277 | 1,115,921 | Apr 18 04:56 PM | | Bicket John | SEE REMARKS | Apr 16 '24 | Sale | 30.73 | 96,000 | 2,950,268 | 1,019,382 | Apr 18 04:59 PM | | Eltoukhy Adam | SEE REMARKS | Apr 15 '24 | Sale | 30.78 | 10,422 | 320,832 | 535,149 | Apr 17 04:53 PM | | Biswas Sanjit | CHIEF EXECUTIVE OFFICER | Apr 10 '24 | Sale | 32.56 | 38,251 | 1,245,343 | 1,211,921 | Apr 11 05:07 PM | | Bicket John | SEE REMARKS | Apr 10 '24 | Sale | 32.56 | 38,230 | 1,244,750 | 1,115,382 | Apr 11 05:05 PM |
|
|
|
 |
| Market Cap | 50.22B | EPS (ttm) | -1.49 |
| P/E | - | EPS this Y | 33.65% |
| Forward P/E | 63.13 | EPS next Y | 19.52% |
| PEG | - | EPS past 5Y | -31.08% |
| P/S | 12.90 | EPS next 5Y | 23.70% |
| P/B | 55.50 | EPS Q/Q | 59.24% |
| Dividend | - | Sales Q/Q | 21.47% |
| Insider Own | 40.17% | Inst Own | 53.83% |
| Insider Trans | -2.01% | Inst Trans | -4.56% |
| Short Float | 3.32% | Earnings | Apr 25/a |
| Analyst Recom | 2.03 | Target Price | 261.91 |
| Avg Volume | 1.78M | 52W Range | 128.02 - 258.69 |
|
|
|
|
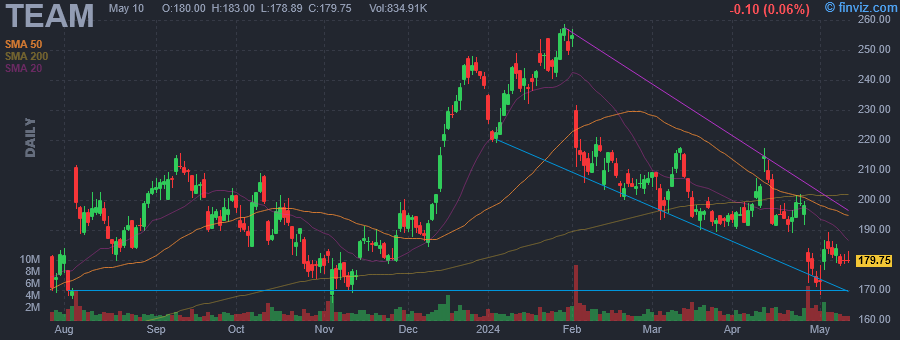
Atlassian Corp. is a holding company, which engages in providing team collaboration and productivity software. Its software helps teams organize, discuss, and complete shared work. Its products include Jira Software, Confluence, Jira Service Management, and Trello. The company was founded by Michael Cannon-Brookes and Scott Farquhar in October 2002 and is headquartered in San Francisco, CA. |
| Insider Trading |
Relationship |
Date |
Transaction |
Cost |
#Shares |
Value ($) |
#Shares Total |
SEC Form 4 |
| Cannon-Brookes Michael | Co-CEO, Co-Founder | Apr 17 '24 | Sale | 196.26 | 8,241 | 1,617,373 | 407,655 | Apr 18 04:58 PM | | Farquhar Scott | Co-CEO, Co-Founder | Apr 17 '24 | Sale | 196.26 | 8,241 | 1,617,372 | 407,655 | Apr 18 04:58 PM | | Cannon-Brookes Michael | Co-CEO, Co-Founder | Apr 16 '24 | Sale | 194.37 | 8,241 | 1,601,833 | 415,896 | Apr 17 05:05 PM | | Farquhar Scott | Co-CEO, Co-Founder | Apr 16 '24 | Sale | 194.37 | 8,241 | 1,601,832 | 415,896 | Apr 17 05:05 PM | | Cannon-Brookes Michael | Co-CEO, Co-Founder | Apr 15 '24 | Sale | 197.46 | 8,241 | 1,627,275 | 424,137 | Apr 16 05:36 PM |
|
|
|
