 |
| Market Cap | 56.03B | EPS (ttm) | 1.34 |
| P/E | 13.42 | EPS this Y | 11.23% |
| Forward P/E | 8.90 | EPS next Y | 25.19% |
| PEG | 1.11 | EPS past 5Y | 10.52% |
| P/S | 1.22 | EPS next 5Y | 12.07% |
| P/B | 2.60 | EPS Q/Q | 50.09% |
| Dividend | 4.30% | Sales Q/Q | 4.13% |
| Insider Own | 0.01% | Inst Own | 6.41% |
| Insider Trans | 0.00% | Inst Trans | -2.41% |
| Short Float | 0.18% | Earnings | Apr 16/a |
| Analyst Recom | 1.71 | Target Price | 22.20 |
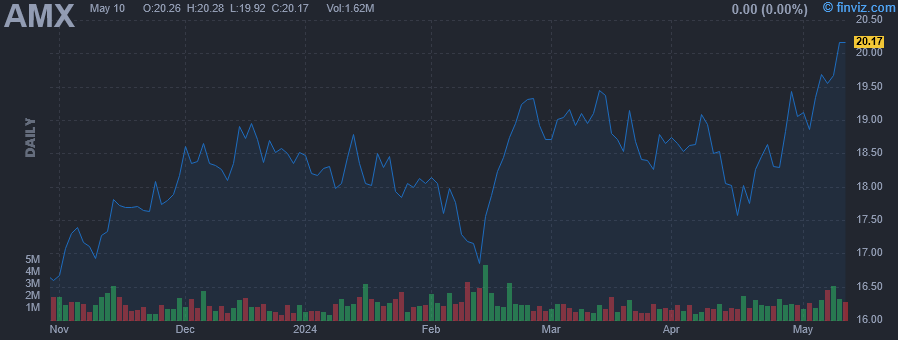
| Avg Volume | 1.44M | 52W Range | 15.99 - 23.07 |
|
|
|
|
America Movil SAB de CV engages in the provision of telecommunications services. The firm operates through the following segments: Mexico Wireless, Mexico Fixed, Brazil, Colombia, Southern Cone (Argentina, Chile, Paraguay and Uruguay), Andean Region (Ecuador and Peru), Central America (Costa Rica, El Salvador, Guatemala, Honduras, Nicaragua and Panama), the Caribbean (the Dominican Republic and Puerto Rico) and Europe (Austria, Belarus, Bulgaria, Croatia, Macedonia, Serbia and Slovenia). Its products and services include wireless voice, wireless data and value-added services, fixed voice, fixed data, broadband and IT services, Pay TV and over-the-top (OTT) services. The company was founded on September 25, 2000 and is headquartered in Mexico City, Mexico. |
|
 |
 |
| Market Cap | 494.85M | EPS (ttm) | 0.47 |
| P/E | 68.84 | EPS this Y | 668.80% |
| Forward P/E | 7.31 | EPS next Y | 14.05% |
| PEG | 6.88 | EPS past 5Y | -26.18% |
| P/S | 2.18 | EPS next 5Y | 10.00% |
| P/B | 1.09 | EPS Q/Q | -356.23% |
| Dividend | 1.52% | Sales Q/Q | -65.56% |
| Insider Own | 14.04% | Inst Own | 60.90% |
| Insider Trans | -0.40% | Inst Trans | -9.61% |
| Short Float | 1.00% | Earnings | Apr 16/a |
| Analyst Recom | 2.20 | Target Price | 38.00 |
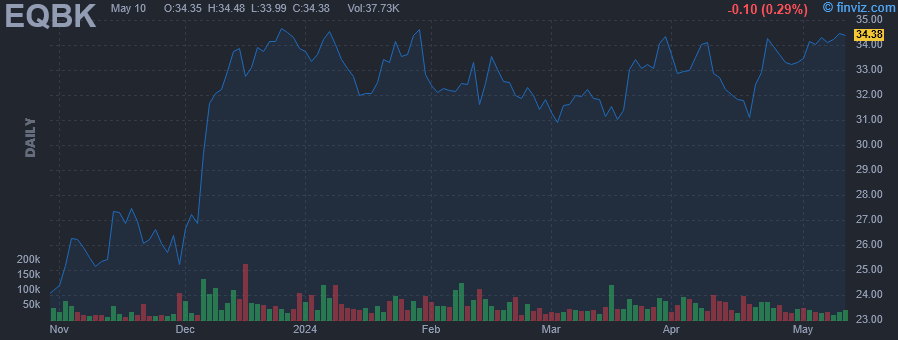
| Avg Volume | 53.88K | 52W Range | 20.50 - 34.99 |
|
|
|
Mar-26-24 07:09PM
|
Equity Bancshares, Inc. Will Announce First Quarter 2024 Results on April 16, 2024
(Business Wire) |
|
Feb-12-24 09:00AM
|
Equity Bancshares, Inc. Completes Merger with Rockhold BanCorp
(Business Wire) |
|
Jan-24-24 05:29PM
|
Equity Bancshares, Inc. Fourth Quarter Results Highlighted by 6.1% Annualized Loan Growth and Strategic Balance Sheet Repositioning
(GlobeNewswire) |
|
Dec-28-23 06:00PM
|
Equity Bancshares, Inc. Will Announce Fourth Quarter 2023 Results on January 24, 2024
(GlobeNewswire) |
|
Dec-06-23 06:30AM
|
Equity Bancshares, Inc. Adds to Missouri Franchise, Will Acquire Bank of Kirksville
(GlobeNewswire) +10.45% |
|
Oct-19-23 08:18AM
|
Equity Bancshares, Inc. (NASDAQ:EQBK) Q3 2023 Earnings Call Transcript
(Insider Monkey) |
|
Oct-17-23 04:46PM
|
Equity Bancshares, Inc. Reports Third Quarter Results; Including Net Interest Margin Growth Driven by Core Deposit Base
(GlobeNewswire) |
|
Sep-28-23 01:56PM
|
Equity Bancshares, Inc. Will Announce Third Quarter 2023 Results on October 17, 2023
(GlobeNewswire) |
|
Sep-22-23 09:40AM
|
Is Equity Bancshares (EQBK) Stock Undervalued Right Now?
(Zacks) |
|
Sep-06-23 09:40AM
|
Should Value Investors Buy Equity Bancshares (EQBK) Stock?
(Zacks) |
|
Equity Bancshares, Inc. is a bank holding company, which engages in the provision of financial services to individuals and businesses. The firm also offers online banking solutions, and commercial and personal banking services such as savings, treasury management, and loans. The company was founded by Brad S. Elliott in November 2002 and is headquartered in Wichita, KS. |
| Insider Trading |
Relationship |
Date |
Transaction |
Cost |
#Shares |
Value ($) |
#Shares Total |
SEC Form 4 |
| Elliott Brad S | Chief Executive Officer | Feb 29 '24 | Sale | 32.02 | 472 | 15,113 | 151,616 | Feb 29 11:16 AM | | Elliott Brad S | Chief Executive Officer | Feb 28 '24 | Sale | 31.57 | 6,290 | 198,575 | 152,088 | Feb 29 11:16 AM | | Huber Julie A | EVP | Feb 08 '24 | Sale | 32.14 | 1,050 | 33,747 | 56,918 | Feb 12 02:19 PM | | Reber Brett A | General Counsel | Feb 08 '24 | Sale | 32.14 | 959 | 30,822 | 29,147 | Feb 12 02:20 PM | | Slupkowski Krzysztof | Chief Credit Officer | Feb 08 '24 | Sale | 32.12 | 179 | 5,750 | 9,808 | Feb 12 02:19 PM |
|
|
|
 |
| Market Cap | 2.40B | EPS (ttm) | 1.64 |
| P/E | 9.01 | EPS this Y | -8.23% |
| Forward P/E | 9.53 | EPS next Y | 3.24% |
| PEG | 1.13 | EPS past 5Y | 6.84% |
| P/S | 1.60 | EPS next 5Y | 8.00% |
| P/B | 0.94 | EPS Q/Q | -20.52% |
| Dividend | 4.80% | Sales Q/Q | 22.75% |
| Insider Own | 1.16% | Inst Own | 72.98% |
| Insider Trans | -0.00% | Inst Trans | 0.12% |
| Short Float | 5.00% | Earnings | Apr 16/a |
| Analyst Recom | 3.00 | Target Price | 16.14 |
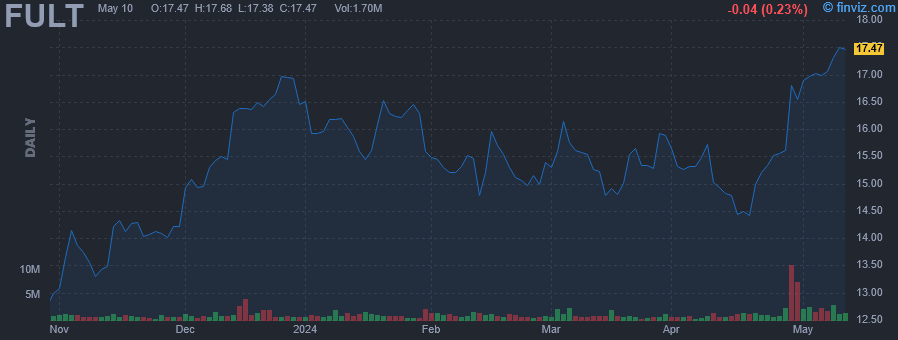
| Avg Volume | 1.09M | 52W Range | 9.64 - 17.06 |
|
|
|
|
Fulton Financial Corp. is financial holding company, which through its subsidiaries, engages in the provision of consumer and commercial banking products and services. It offers checking account and savings deposit products, certificates of deposit and individual retirement accounts. The company also offers investment management, trust, brokerage, insurance and investment advisory services to consumer and commercial banking customers in the market areas serviced by the subsidiary banks. The company was founded on February 8, 1982 and is headquartered in Lancaster, PA. |
| Insider Trading |
Relationship |
Date |
Transaction |
Cost |
#Shares |
Value ($) |
#Shares Total |
SEC Form 4 |
| Wenger E Philip | Director | Nov 07 '23 | Sale | 13.75 | 0 | 4 | 0 | Nov 08 11:52 AM | | MOXLEY JAMES R III | Director | Jun 01 '23 | Option Exercise | 0.00 | 4,661 | 0 | 83,331 | Jun 05 04:31 PM | | Myers Curtis J | Chairman & CEO | May 12 '23 | Buy | 9.81 | 15,000 | 147,156 | 157,044 | May 15 09:05 AM | | MCCOLLOM MARK R | Sr. EVP & CFO | May 11 '23 | Buy | 9.74 | 10,000 | 97,400 | 71,503 | May 15 09:04 AM | | Campbell David M | Sr Executive Vice President | May 03 '23 | Sale | 11.19 | 10,514 | 117,636 | 22,202 | May 03 04:30 PM |
|
|
| |
 |
| Market Cap | 3.68B | EPS (ttm) | 4.50 |
| P/E | 9.47 | EPS this Y | -7.27% |
| Forward P/E | 8.50 | EPS next Y | 4.12% |
| PEG | 1.18 | EPS past 5Y | 3.88% |
| P/S | 1.93 | EPS next 5Y | 8.00% |
| P/B | 0.97 | EPS Q/Q | -64.81% |
| Dividend | 2.86% | Sales Q/Q | 10.21% |
| Insider Own | 1.23% | Inst Own | 82.21% |
| Insider Trans | -3.21% | Inst Trans | 1.10% |
| Short Float | 2.04% | Earnings | Apr 16/a |
| Analyst Recom | 2.30 | Target Price | 51.20 |
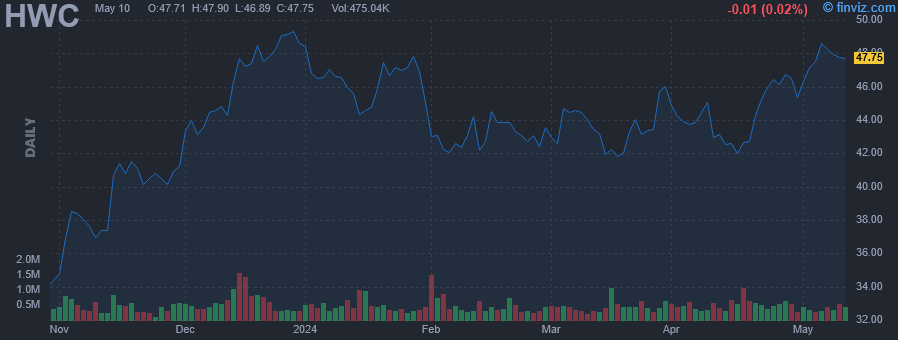
| Avg Volume | 497.99K | 52W Range | 31.02 - 49.65 |
|
|
|
|
Hancock Whitney Corp. operates as a bank holding company, which engages in the provision of financial services. It also offers trust and investment management services to retirement plans, corporations, individuals, brokerage services, annuity products, life insurance, general insurance and agency services, including life, title insurance and consumer financing service. The company was founded in 1984 and is headquartered in Gulfport, MS. |
| Insider Trading |
Relationship |
Date |
Transaction |
Cost |
#Shares |
Value ($) |
#Shares Total |
SEC Form 4 |
| Ziluca Christopher S | Chief Credit Officer | Feb 22 '24 | Sale | 43.50 | 3,636 | 158,166 | 35,285 | Feb 22 05:17 PM | | Loper D Shane | Chief Operating Officer | Jan 25 '24 | Sale | 46.81 | 17,690 | 828,069 | 71,148 | Jan 26 04:09 PM | | Exnicios Joseph S | President-Hancock Whitney Bank | Jan 22 '24 | Sale | 47.15 | 9,857 | 464,758 | 30,159 | Jan 23 04:34 PM | | Exnicios Joseph S | President-Hancock Whitney Bank | Jan 22 '24 | Sale | 46.96 | 37 | 1,724 | 0 | Jan 23 04:34 PM | | Exnicios Joseph S | President-Hancock Whitney Bank | Jan 19 '24 | Sale | 45.28 | 4,042 | 183,022 | 40,016 | Jan 23 04:34 PM |
|
|
|
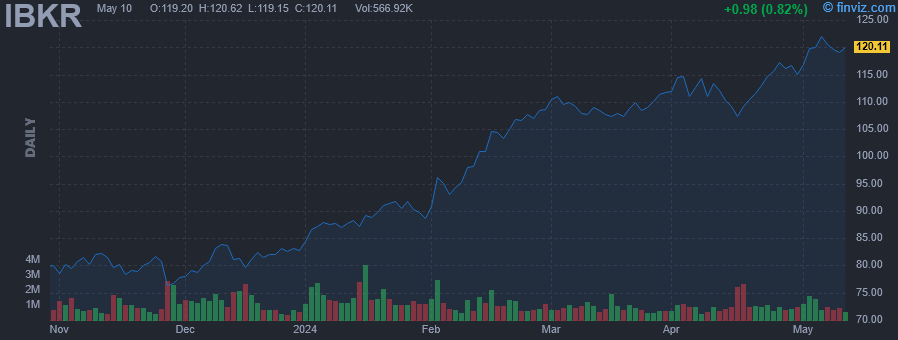 |
| Market Cap | 11.69B | EPS (ttm) | 5.66 |
| P/E | 19.27 | EPS this Y | 14.02% |
| Forward P/E | 16.64 | EPS next Y | 0.08% |
| PEG | 1.29 | EPS past 5Y | 20.03% |
| P/S | 1.49 | EPS next 5Y | 14.90% |
| P/B | 3.26 | EPS Q/Q | 13.12% |
| Dividend | 0.37% | Sales Q/Q | 39.84% |
| Insider Own | 3.26% | Inst Own | 86.84% |
| Insider Trans | -22.63% | Inst Trans | 1.43% |
| Short Float | 2.60% | Earnings | Apr 16/a |
| Analyst Recom | 1.45 | Target Price | 132.00 |
| Avg Volume | 1.10M | 52W Range | 70.83 - 116.92 |
|
|
|
|
Interactive Brokers Group, Inc. operates as an investment holding company, which engages in broker or dealer and proprietary trading businesses. It offers custody and service accounts for hedge and mutual funds, exchange-traded funds, registered investment advisors, proprietary trading groups, introducing brokers, and individual investors. The company was founded by Thomas Pechy Peterffy in 1977 and is headquartered in Greenwich, CT. |
| Insider Trading |
Relationship |
Date |
Transaction |
Cost |
#Shares |
Value ($) |
#Shares Total |
SEC Form 4 |
| Nemser Earl H | Vice Chairman | Feb 22 '24 | Sale | 107.01 | 5,000 | 535,050 | 108,770 | Feb 23 04:18 PM | | Nemser Earl H | Vice Chairman | Feb 21 '24 | Sale | 104.86 | 5,000 | 524,300 | 113,770 | Feb 23 04:18 PM | | Nemser Earl H | Vice Chairman | Feb 16 '24 | Sale | 105.63 | 5,000 | 528,132 | 118,770 | Feb 20 04:55 PM | | Nemser Earl H | Vice Chairman | Feb 15 '24 | Sale | 103.53 | 10,000 | 1,035,329 | 123,770 | Feb 20 04:55 PM | | Nemser Earl H | Vice Chairman | Feb 14 '24 | Sale | 101.74 | 25,000 | 2,543,624 | 133,770 | Feb 15 04:54 PM |
|
|
| |
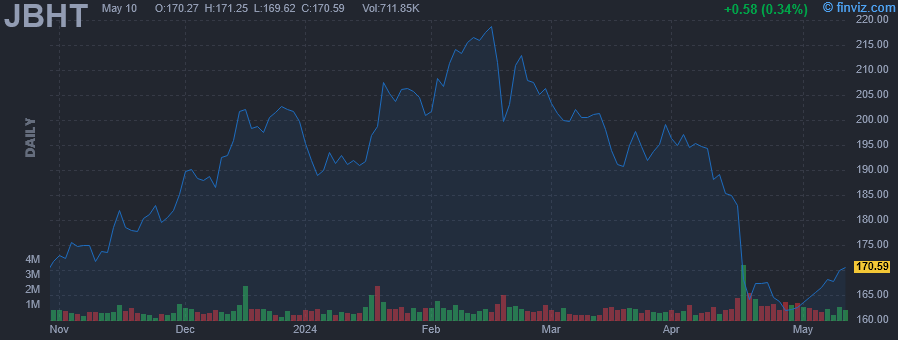 |
| Market Cap | 19.12B | EPS (ttm) | 6.97 |
| P/E | 26.55 | EPS this Y | 6.48% |
| Forward P/E | 19.81 | EPS next Y | 25.92% |
| PEG | 5.90 | EPS past 5Y | 9.50% |
| P/S | 1.49 | EPS next 5Y | 4.50% |
| P/B | 4.66 | EPS Q/Q | -23.28% |
| Dividend | 0.83% | Sales Q/Q | -9.48% |
| Insider Own | 19.96% | Inst Own | 75.87% |
| Insider Trans | -0.14% | Inst Trans | -3.42% |
| Short Float | 3.10% | Earnings | Apr 16/a |
| Analyst Recom | 1.91 | Target Price | 207.65 |
| Avg Volume | 783.92K | 52W Range | 164.39 - 219.51 |
|
|
|
|
J.B. Hunt Transport Services, Inc. engages in the provision of logistics solutions. It operates through the following segments: Intermodal (JBI), Dedicated Contract Services (DCS), Integrated Capacity Solutions (ICS), Final Mile Services (FMS) and Truckload (JBT). The JBI segment offers intermodal freight operations for rail carriers. The DCS segment includes private fleet conversion and final-mile delivery services. The ICS segment provides single-source logistics management for clients who intend to outsource their transportation activities. It offers flatbed, refrigerated, expedited, less-than-truckload, dry-van, and intermodal freight services. The FMS segment provides final-mile delivery services to customers through a nationwide network of cross-dock and other delivery system network locations. The JBT segment is responsible for full-load, dry-van freight that is transported via roads and highways. The company was founded by Johnnie Bryan Hunt, Sr. and Johnelle D. Hunt on August 10, 1961, and is headquartered in Lowell, AR. |
| Insider Trading |
Relationship |
Date |
Transaction |
Cost |
#Shares |
Value ($) |
#Shares Total |
SEC Form 4 |
| Simpson Shelley | President | Mar 31 '24 | Option Exercise | 0.00 | 4,558 | 0 | 90,286 | Apr 02 03:24 PM | | Scott Stuart Lockard | EVP/CIO | Mar 31 '24 | Option Exercise | 0.00 | 3,472 | 0 | 37,371 | Apr 02 03:24 PM | | ROBERTS JOHN N | CEO | Mar 31 '24 | Option Exercise | 0.00 | 13,479 | 0 | 313,733 | Apr 02 03:23 PM | | McGee Eric | EVP Highway Services | Mar 31 '24 | Option Exercise | 0.00 | 868 | 0 | 1,332 | Apr 02 03:23 PM | | Kuhlow John | EVP & CFO | Mar 31 '24 | Option Exercise | 0.00 | 3,799 | 0 | 14,336 | Apr 02 03:23 PM |
|
|
|
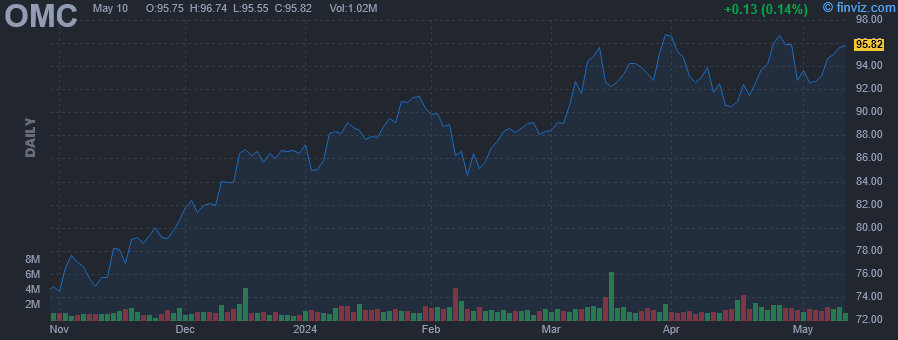 |
| Market Cap | 17.93B | EPS (ttm) | 6.92 |
| P/E | 13.08 | EPS this Y | 5.48% |
| Forward P/E | 10.80 | EPS next Y | 7.25% |
| PEG | 0.98 | EPS past 5Y | 3.46% |
| P/S | 1.22 | EPS next 5Y | 13.40% |
| P/B | 4.96 | EPS Q/Q | 1.88% |
| Dividend | 3.23% | Sales Q/Q | 4.98% |
| Insider Own | 1.08% | Inst Own | 94.76% |
| Insider Trans | -0.27% | Inst Trans | 0.34% |
| Short Float | 4.76% | Earnings | Apr 16/a |
| Analyst Recom | 1.93 | Target Price | 102.33 |
| Avg Volume | 1.62M | 52W Range | 72.20 - 99.23 |
|
|
|
|
Omnicom Group, Inc. is a holding company, which provides advertising, marketing and corporate communications services. The company was founded by Maxwell Dane in 1944 and is headquartered in New York, NY. |
| Insider Trading |
Relationship |
Date |
Transaction |
Cost |
#Shares |
Value ($) |
#Shares Total |
SEC Form 4 |
| Tarlowe Rochelle M. | Senior VP and Treasurer | Mar 13 '24 | Sale | 95.34 | 1,500 | 143,012 | 15,579 | Mar 14 04:30 PM | | RICE LINDA JOHNSON | Director | Feb 09 '24 | Sale | 86.66 | 507 | 43,937 | 9,753 | Feb 13 04:30 PM | | RICE LINDA JOHNSON | Director | Nov 15 '23 | Sale | 78.70 | 587 | 46,200 | 9,664 | Nov 17 04:30 PM | | Castellaneta Andrew | SVP, Chief Accounting Officer | Nov 02 '23 | Sale | 76.57 | 3,300 | 252,683 | 30,014 | Nov 06 04:30 PM | | RICE LINDA JOHNSON | Director | Aug 16 '23 | Sale | 80.24 | 467 | 37,472 | 9,591 | Aug 21 04:31 PM |
|
|
| |
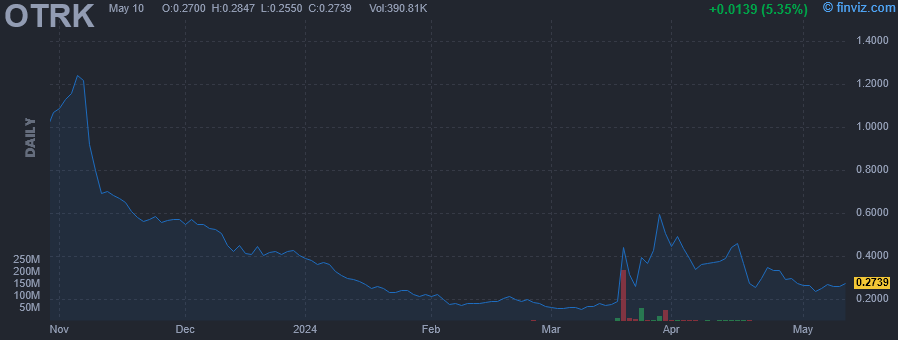 |
| Market Cap | 12.13M | EPS (ttm) | -8.38 |
| P/E | - | EPS this Y | - |
| Forward P/E | - | EPS next Y | - |
| PEG | - | EPS past 5Y | -21.33% |
| P/S | 1.04 | EPS next 5Y | 30.00% |
| P/B | - | EPS Q/Q | 52.28% |
| Dividend | - | Sales Q/Q | 30.67% |
| Insider Own | 76.29% | Inst Own | 12.98% |
| Insider Trans | 0.00% | Inst Trans | -47.21% |
| Short Float | 22.63% | Earnings | Apr 16/a |
| Analyst Recom | 1.00 | Target Price | 4.00 |
| Avg Volume | 6.85M | 52W Range | 0.14 - 4.08 |
|
|
|
|
Ontrak, Inc. engages in the provision of data analytics based behavioral health management and integrated treatment services to health plans. It offers services through its Ontrak platform solution, which is designed to improve member health, and at the same time, lower costs to the insurer for underserved populations where behavioral health conditions cause or exacerbate co-existing medical conditions. The company was founded by Terren S. Peizer in February 2003 and is headquartered in Miami, FL. |
|
|
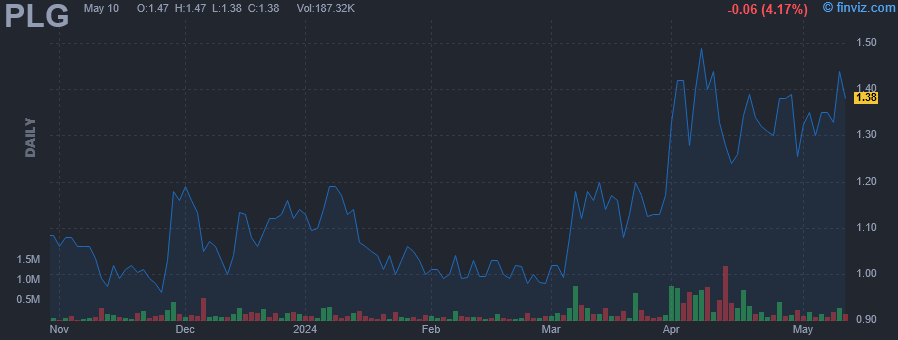 |
| Market Cap | 127.08M | EPS (ttm) | -0.06 |
| P/E | - | EPS this Y | 8.33% |
| Forward P/E | - | EPS next Y | 18.18% |
| PEG | - | EPS past 5Y | 51.11% |
| P/S | - | EPS next 5Y | - |
| P/B | 4.73 | EPS Q/Q | 6.13% |
| Dividend | - | Sales Q/Q | - |
| Insider Own | 26.61% | Inst Own | 20.28% |
| Insider Trans | 0.00% | Inst Trans | 29.12% |
| Short Float | 1.41% | Earnings | Apr 16/a |
| Analyst Recom | 2.50 | Target Price | 1.42 |
| Avg Volume | 257.25K | 52W Range | 0.94 - 1.78 |
|
|
|
|
Platinum Group Metals Ltd. engages in the acquisition, exploration, and development of platinum and palladium properties. It operates through Canada and South Africa geographical segment. The company was founded by R. Michael Jones on January 10, 2000 and is headquartered in Vancouver, Canada. |
|
|
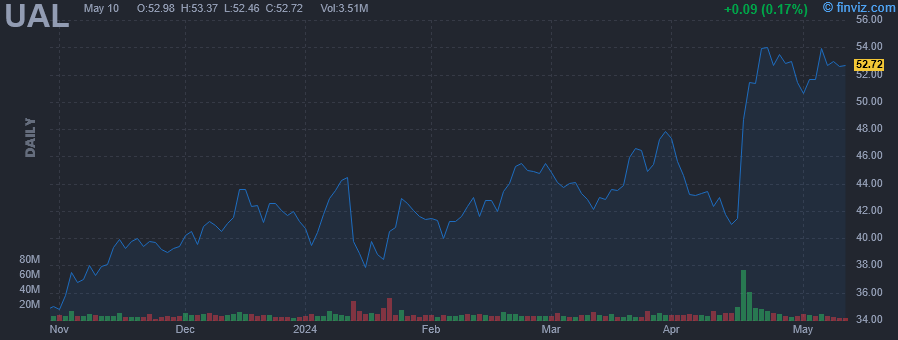 |
| Market Cap | 13.46B | EPS (ttm) | 7.88 |
| P/E | 5.21 | EPS this Y | -6.18% |
| Forward P/E | 3.59 | EPS next Y | 21.23% |
| PEG | 0.11 | EPS past 5Y | 0.56% |
| P/S | 0.25 | EPS next 5Y | 48.62% |
| P/B | 1.44 | EPS Q/Q | -29.02% |
| Dividend | - | Sales Q/Q | 9.89% |
| Insider Own | 0.52% | Inst Own | 70.23% |
| Insider Trans | 0.35% | Inst Trans | -5.74% |
| Short Float | 5.15% | Earnings | Apr 16/a |
| Analyst Recom | 1.59 | Target Price | 63.60 |
| Avg Volume | 8.81M | 52W Range | 33.68 - 58.23 |
|
|
|
|
United Airlines Holdings, Inc. is a holding company, which engages in the provision of transportation services. It operates through the following geographical segments: Domestic, Atlantic, Pacific, and Latin America. The company was founded on December 30, 1968 and is headquartered in Chicago, IL. |
| Insider Trading |
Relationship |
Date |
Transaction |
Cost |
#Shares |
Value ($) |
#Shares Total |
SEC Form 4 |
| Nocella Andrew P | EVP & Chief Commercial Officer | Feb 21 '24 | Option Exercise | 0.00 | 8,546 | 0 | 96,060 | Feb 23 05:21 PM | | Jojo Linda P | EVP & Chief Customer Officer | Feb 21 '24 | Option Exercise | 0.00 | 4,273 | 0 | 106,635 | Feb 23 05:21 PM | | KENNEDY JAMES A C | Director | Nov 07 '23 | Buy | 36.67 | 1,500 | 55,005 | 29,363 | Nov 08 07:42 PM | | KENNEDY JAMES A C | Director | Nov 06 '23 | Buy | 36.43 | 4,500 | 163,922 | 27,863 | Nov 08 07:42 PM | | LADERMAN GERALD | EVP and CFO | Jul 24 '23 | Sale | 57.05 | 4,491 | 256,212 | 133,213 | Jul 26 05:07 PM |
|
|
|
