 |
| Market Cap | 76.54B | EPS (ttm) | 8.86 |
| P/E | 23.99 | EPS this Y | 3.02% |
| Forward P/E | 21.56 | EPS next Y | 2.48% |
| PEG | 6.93 | EPS past 5Y | 9.19% |
| P/S | 13.72 | EPS next 5Y | 3.46% |
| P/B | 2.86 | EPS Q/Q | 27.49% |
| Dividend | 4.58% | Sales Q/Q | 19.17% |
| Insider Own | 0.36% | Inst Own | 89.07% |
| Insider Trans | -1.61% | Inst Trans | 0.50% |
| Short Float | 1.23% | Earnings | Apr 24/b |
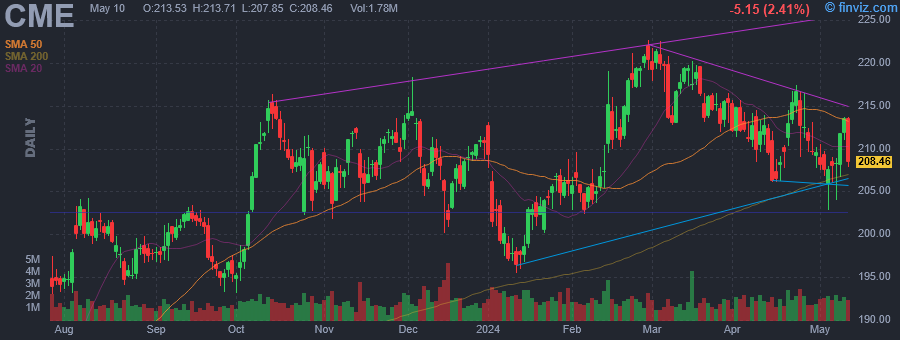
| Analyst Recom | 2.53 | Target Price | 222.20 |
| Avg Volume | 1.70M | 52W Range | 171.43 - 222.63 |
|
|
|
|
CME Group, Inc. operates a derivatives marketplace, which offers a range of futures and options products for risk management. Its exchanges offer a range of global benchmark products across all major asset classes based on interest rates, equity indexes, foreign exchange (FX), energy, agricultural commodities and metals. It offers futures and options on futures trading across asset classes through the CME Globex platform, fixed income trading via BrokerTec and FX trading on the EBS platform. In addition, it also operates CME Clearing, a central counterparty clearing provider. The company was founded in 1898 and is headquartered in Chicago, IL. |
| Insider Trading |
Relationship |
Date |
Transaction |
Cost |
#Shares |
Value ($) |
#Shares Total |
SEC Form 4 |
| SHEPARD WILLIAM R | Director | Mar 26 '24 | Buy | 214.71 | 282 | 60,561 | 253,343 | Mar 27 12:49 PM | | SHEPARD WILLIAM R | Director | Mar 26 '24 | Buy | 214.71 | 12 | 2,670 | 2,334 | Mar 27 12:49 PM | | McCourt Timothy Francis | Sr MD Global Head Equity & FX | Jan 31 '24 | Sale | 206.78 | 35 | 7,237 | 6,447 | Mar 22 04:02 PM | | SHEPARD WILLIAM R | Director | Jan 18 '24 | Buy | 202.44 | 1,331 | 269,488 | 253,060 | Jan 19 05:03 PM | | SHEPARD WILLIAM R | Director | Jan 18 '24 | Buy | 202.44 | 59 | 11,880 | 2,322 | Jan 19 05:03 PM |
|
|
 |
 |
| Market Cap | 5.28B | EPS (ttm) | 7.35 |
| P/E | 11.12 | EPS this Y | 24.97% |
| Forward P/E | 7.23 | EPS next Y | 22.72% |
| PEG | - | EPS past 5Y | -11.06% |
| P/S | 2.95 | EPS next 5Y | -3.69% |
| P/B | 1.23 | EPS Q/Q | 4826.43% |
| Dividend | - | Sales Q/Q | 56.44% |
| Insider Own | 3.66% | Inst Own | 90.19% |
| Insider Trans | -6.33% | Inst Trans | -4.88% |
| Short Float | 2.35% | Earnings | Apr 24/b |
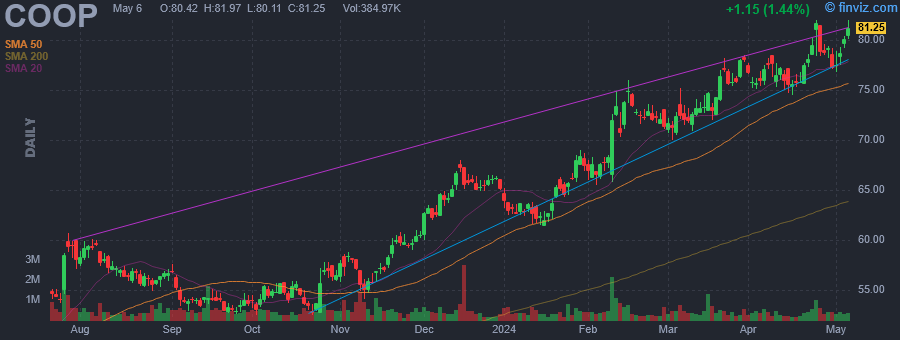
| Analyst Recom | 1.56 | Target Price | 87.75 |
| Avg Volume | 484.36K | 52W Range | 41.74 - 80.21 |
|
|
|
|
Mr. Cooper Group, Inc. engages in the provision of residential loan services. It operated through the following segments: Servicing, and Originations. The Servicing segment consists of collecting loan payments, remitting principal and interest payments to investors, managing escrow funds for the payment of mortgage-related expenses, such as taxes and insurance, performing loss mitigation activities on behalf of investors and otherwise administering mortgage loan servicing portfolio. The Originations segment provides refinance opportunities to the existing servicing customers through direct-to-consumer platform and purchases loans from originators through correspondent channel. The company was founded in 1889 and is headquartered in Coppell, TX. |
| Insider Trading |
Relationship |
Date |
Transaction |
Cost |
#Shares |
Value ($) |
#Shares Total |
SEC Form 4 |
| Bray Jesse K | Chief Executive Officer | Mar 28 '24 | Sale | 78.09 | 25,000 | 1,952,250 | 334,631 | Mar 29 05:14 PM | | Bray Jesse K | Chief Executive Officer | Mar 08 '24 | Option Exercise | 0.00 | 168,666 | 0 | 992,372 | Mar 11 05:34 PM | | Bray Jesse K | Chief Executive Officer | Feb 29 '24 | Sale | 71.61 | 25,000 | 1,790,250 | 366,051 | Mar 04 05:59 PM | | Weinbach Michael S | President | Feb 13 '24 | Buy | 71.16 | 17,000 | 1,209,720 | 17,000 | Feb 14 04:15 PM | | Bray Jesse K | Chief Executive Officer | Jan 29 '24 | Sale | 67.56 | 25,000 | 1,689,000 | 391,051 | Jan 30 04:26 PM |
|
|
|
 |
| Market Cap | 539.65M | EPS (ttm) | 2.17 |
| P/E | 9.21 | EPS this Y | -7.83% |
| Forward P/E | 8.77 | EPS next Y | 13.75% |
| PEG | 1.15 | EPS past 5Y | 1.52% |
| P/S | 1.66 | EPS next 5Y | 8.00% |
| P/B | 1.07 | EPS Q/Q | -25.77% |
| Dividend | 5.24% | Sales Q/Q | 12.52% |
| Insider Own | 2.46% | Inst Own | 88.93% |
| Insider Trans | -2.92% | Inst Trans | -1.18% |
| Short Float | 1.68% | Earnings | Apr 24/b |
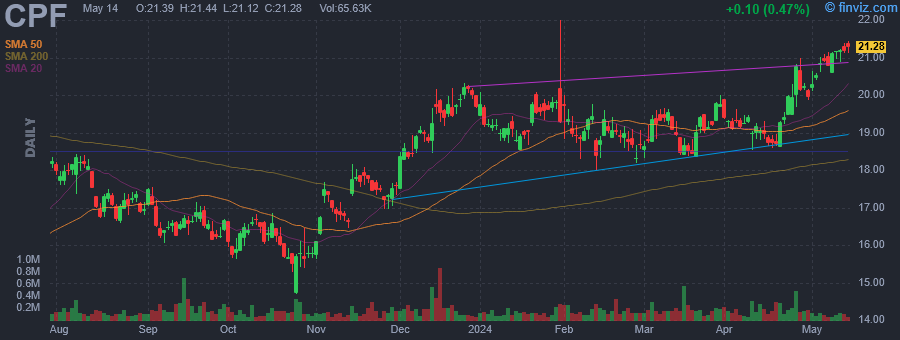
| Analyst Recom | 2.00 | Target Price | 24.00 |
| Avg Volume | 184.77K | 52W Range | 13.22 - 22.00 |
|
|
|
|
Central Pacific Financial Corp. is a bank holding company, which engages in the provision of commercial banking services through its wholly owned subsidiary Central Pacific Bank. The firm offers wealth management, personal and business banking. It also provides loan services for commercial and industrial, real estate, and consumer. The company was founded on February 1, 1982 and is headquartered in Honolulu, HI. |
| Insider Trading |
Relationship |
Date |
Transaction |
Cost |
#Shares |
Value ($) |
#Shares Total |
SEC Form 4 |
| Ngo Agnes Catherine | Director | Apr 12 '24 | Sale | 19.00 | 3,333 | 63,327 | 85,356 | Apr 12 03:49 PM | | Ngo Agnes Catherine | Director | Mar 12 '24 | Sale | 19.32 | 3,333 | 64,409 | 88,689 | Mar 12 03:02 PM | | Ngo Agnes Catherine | Director | Feb 12 '24 | Sale | 19.45 | 3,333 | 64,840 | 92,022 | Feb 12 06:05 PM | | Ngo Agnes Catherine | Director | Jan 12 '24 | Sale | 19.16 | 3,333 | 63,868 | 95,355 | Jan 12 05:19 PM | | Ngo Agnes Catherine | Director | Dec 12 '23 | Sale | 18.88 | 3,333 | 62,940 | 98,688 | Dec 12 08:04 PM |
|
|
| |
 |
| Market Cap | 2.88B | EPS (ttm) | 0.91 |
| P/E | 21.88 | EPS this Y | 102.17% |
| Forward P/E | 8.19 | EPS next Y | 31.23% |
| PEG | - | EPS past 5Y | -10.89% |
| P/S | 0.37 | EPS next 5Y | -2.81% |
| P/B | 3.15 | EPS Q/Q | -62.99% |
| Dividend | - | Sales Q/Q | -7.78% |
| Insider Own | 12.86% | Inst Own | 82.26% |
| Insider Trans | 0.00% | Inst Trans | -7.03% |
| Short Float | 1.47% | Earnings | Apr 24/b |
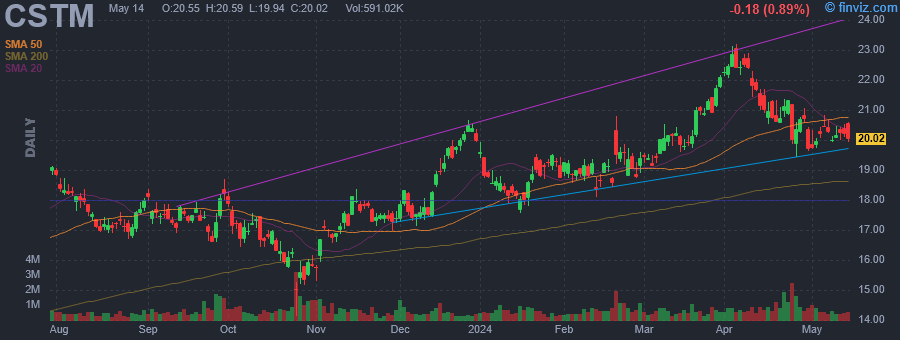
| Analyst Recom | 1.00 | Target Price | 25.17 |
| Avg Volume | 734.20K | 52W Range | 13.40 - 23.20 |
|
|
|
|
Constellium SE is a holding company, which engages in the design and manufacture of rolled and extruded aluminum products. It operates through the following segments: Packaging and Automotive Rolled Products, Aerospace and Transportation, and Automotive Structures and Industry. The Packaging and Automotive Rolled Products segment includes the production in European and North American facilities. The Aerospace and Transportation segment involves the plate and sheet form, and limited volumes of extruded products. The Automotive Structures and Industry segment consists of extruded aluminum products and structural components, crash-management systems, body structures, side impact beams, and battery enclosures, fabricated hard and soft alloy extruded profiles. The company was founded on May 14, 2010 and is headquartered in Paris, France. |
|
|
 |
| Market Cap | 50.96B | EPS (ttm) | 3.08 |
| P/E | 10.58 | EPS this Y | -13.30% |
| Forward P/E | 7.06 | EPS next Y | 0.42% |
| PEG | 0.54 | EPS past 5Y | 2.92% |
| P/S | 0.50 | EPS next 5Y | 19.50% |
| P/B | 0.99 | EPS Q/Q | -70.88% |
| Dividend | 6.55% | Sales Q/Q | -16.93% |
| Insider Own | 0.01% | Inst Own | 1.35% |
| Insider Trans | 0.00% | Inst Trans | -18.86% |
| Short Float | 0.07% | Earnings | Apr 24/b |
| Analyst Recom | 2.05 | Target Price | 36.75 |
| Avg Volume | 249.49K | 52W Range | 26.50 - 34.30 |
|
|
|
|
Eni SpA engages in the exploration, production, refining, and sale of oil, gas, electricity, and chemicals. It operates through the following segments: Exploration and Production, Global Gas and LNG Portfolio, Refining & Marketing and Chemicals, Power & Renewables, and Corporate and Other Activities. The Exploration and Production segment engages in research, development and production of oil, condensates and natural gas, forestry conservation (REDD+) and CO2 capture and storage projects. The Global Gas and LNG Portfolio segment refers to the supply and sale of wholesale natural gas by pipeline, international transport and purchase and marketing of LNG, which includes gas trading activities finalized to hedging and stabilizing the trade margins, as well as optimizing the gas asset portfolio. The Refining & Marketing and Chemicals segment engages in supply, processing, distribution, and marketing of fuels and chemicals. The Corporate and Other Activities segment includes the main business support functions in particular holding, central treasury, IT, human resources, real estate services, captive insurance activities, research and development, new technologies, business digitalization, and environmental activities. The company was founded on February 10, 1953 and is headquartered in Rome, Italy. |
|
| |
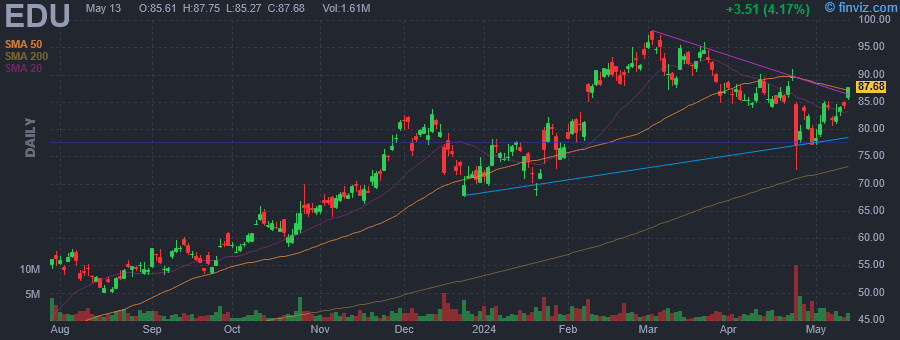 |
| Market Cap | 12.76B | EPS (ttm) | 1.83 |
| P/E | 42.07 | EPS this Y | 68.09% |
| Forward P/E | 21.66 | EPS next Y | 40.19% |
| PEG | 145.06 | EPS past 5Y | -11.25% |
| P/S | 3.56 | EPS next 5Y | 0.29% |
| P/B | 3.33 | EPS Q/Q | 4088.37% |
| Dividend | - | Sales Q/Q | 36.26% |
| Insider Own | 0.03% | Inst Own | 40.26% |
| Insider Trans | 0.00% | Inst Trans | 2.47% |
| Short Float | 2.59% | Earnings | Apr 24/b |
| Analyst Recom | 1.28 | Target Price | 103.12 |
| Avg Volume | 1.60M | 52W Range | 35.70 - 98.20 |
|
|
|
|
New Oriental Education & Technology Group, Inc. is a holding company, which engages in the provision of private educational services. It operates through the following segments: Educational Services and Test Preparation Courses; Online Education and Other Services; Overseas Study Consulting Services, and Others. The company was founded by Min Hong Yu and Yong Qiang Qian on November 16, 1993, and is headquartered in Beijing, China. |
|
|
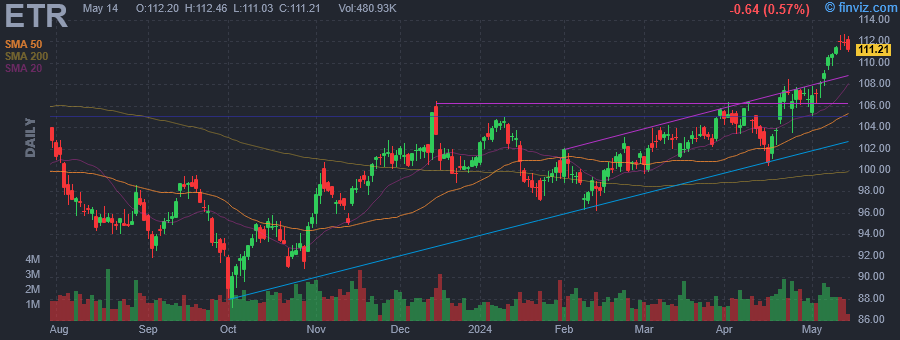 |
| Market Cap | 22.70B | EPS (ttm) | 11.10 |
| P/E | 9.59 | EPS this Y | 6.45% |
| Forward P/E | 13.80 | EPS next Y | 7.06% |
| PEG | 1.41 | EPS past 5Y | 19.11% |
| P/S | 1.87 | EPS next 5Y | 6.80% |
| P/B | 1.55 | EPS Q/Q | 812.18% |
| Dividend | 4.26% | Sales Q/Q | -16.74% |
| Insider Own | 0.31% | Inst Own | 89.42% |
| Insider Trans | -7.09% | Inst Trans | 0.49% |
| Short Float | 1.12% | Earnings | Apr 24/b |
| Analyst Recom | 1.75 | Target Price | 113.09 |
| Avg Volume | 1.45M | 52W Range | 87.10 - 109.53 |
|
|
|
|
Entergy Corp. is a holding company, which engages in providing electric and natural gas services. It operates through the Utility, and Parent and Other segments. The Utility segment includes the generation, transmission, distribution, and sale of electric power in portions of Arkansas, Mississippi, Texas, and Louisiana. The Parent and Other segment refers to the parent company, Entergy Corporation, and other business activities. The company was founded by Harvey Couch on November 13, 1913 and is headquartered in New Orleans, LA. |
| Insider Trading |
Relationship |
Date |
Transaction |
Cost |
#Shares |
Value ($) |
#Shares Total |
SEC Form 4 |
| Brown Marcus V | EVP & General Counsel | Mar 15 '24 | Sale | 102.84 | 8,500 | 874,140 | 9,911 | Mar 18 05:01 PM | | RODRIGUEZ DEANNA D. | "Officer" Under Sec. 16 Rules | Mar 14 '24 | Sale | 101.23 | 1,500 | 151,845 | 3,442 | Mar 15 05:29 PM | | COOK-NELSON KIMBERLY | EVP & Chief Nuclear Officer | Mar 01 '24 | Sale | 100.35 | 2,000 | 200,700 | 16,037 | Mar 04 05:20 PM | | Brown Marcus V | EVP & General Counsel | Dec 11 '23 | Option Exercise | 91.73 | 38,417 | 3,523,967 | 47,668 | Dec 12 05:06 PM | | Brown Marcus V | EVP & General Counsel | Dec 11 '23 | Sale | 101.53 | 38,417 | 3,900,478 | 9,380 | Dec 12 05:06 PM |
|
|
| |
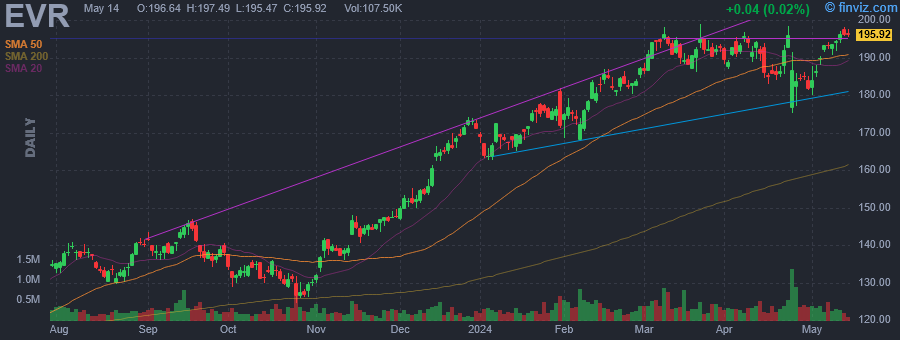 |
| Market Cap | 7.22B | EPS (ttm) | 6.35 |
| P/E | 29.40 | EPS this Y | 61.16% |
| Forward P/E | 12.42 | EPS next Y | 44.29% |
| PEG | - | EPS past 5Y | -5.22% |
| P/S | 2.95 | EPS next 5Y | -4.00% |
| P/B | 4.47 | EPS Q/Q | -40.84% |
| Dividend | 1.69% | Sales Q/Q | -5.64% |
| Insider Own | 7.92% | Inst Own | 87.59% |
| Insider Trans | -0.64% | Inst Trans | 1.08% |
| Short Float | 2.69% | Earnings | Apr 24/b |
| Analyst Recom | 2.22 | Target Price | 206.71 |
| Avg Volume | 371.75K | 52W Range | 104.36 - 198.99 |
|
|
|
|
Evercore, Inc. operates as a investment banking advisory company. It operates through the Investment Banking and Investment Management business segments. The Investment Banking segment includes the global advisory business of the company through which the firm delivers strategic corporate advisory, capital markets advisory, and institutional equities services. The Investment Management segment comprises wealth management and trust services through Evercore Wealth Management L.L.C. and investment management in Mexico through Evercore Casa de Bolsa, S.A. de C.V., as well as private equity through investments in entities that manage private equity funds. The company was founded by Roger C. Altman in 1995 and is headquartered in New York, NY. |
| Insider Trading |
Relationship |
Date |
Transaction |
Cost |
#Shares |
Value ($) |
#Shares Total |
SEC Form 4 |
| LaLonde Timothy Gilbert | Chief Financial Officer | Feb 13 '24 | Sale | 178.74 | 3,337 | 596,460 | 27,291 | Feb 14 04:13 PM | | Klurfeld Jason | General Counsel | Feb 08 '24 | Sale | 173.21 | 5,877 | 1,017,956 | 22,099 | Feb 12 04:54 PM | | Pensa Paul | Contr, Prin. Acct.Officer | Feb 07 '24 | Sale | 170.38 | 1,540 | 262,380 | 4,447 | Feb 08 04:52 PM | | LaLonde Timothy Gilbert | Chief Financial Officer | Feb 01 '24 | Sale | 173.51 | 2,500 | 433,770 | 37,172 | Feb 05 04:09 PM | | BEATTIE RICHARD I | Director | Dec 05 '23 | Sale | 151.31 | 6,522 | 986,844 | 17,000 | Dec 07 04:48 PM |
|
|
|
 |
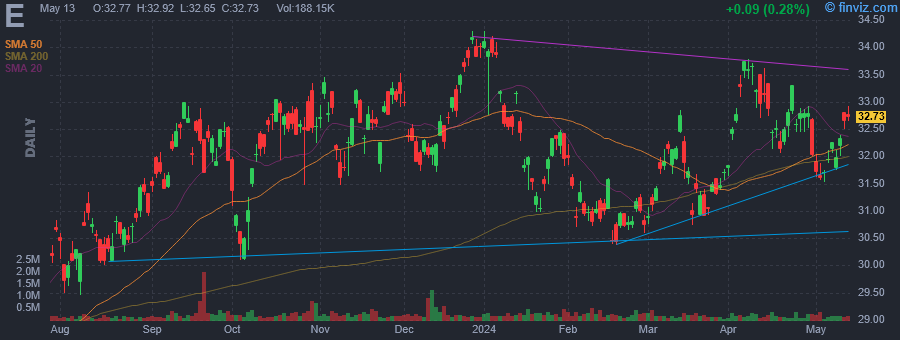
| Market Cap | 339.54M | EPS (ttm) | 1.00 |
| P/E | 11.72 | EPS this Y | -8.19% |
| Forward P/E | 9.90 | EPS next Y | 54.86% |
| PEG | 2.09 | EPS past 5Y | -12.97% |
| P/S | 0.77 | EPS next 5Y | 5.60% |
| P/B | 0.51 | EPS Q/Q | -29.58% |
| Dividend | 7.53% | Sales Q/Q | 17.70% |
| Insider Own | 5.63% | Inst Own | 62.12% |
| Insider Trans | -2.50% | Inst Trans | -2.49% |
| Short Float | 3.02% | Earnings | Apr 24/b |
| Analyst Recom | 2.40 | Target Price | 15.88 |
| Avg Volume | 218.40K | 52W Range | 9.28 - 18.00 |
|
|
|
|
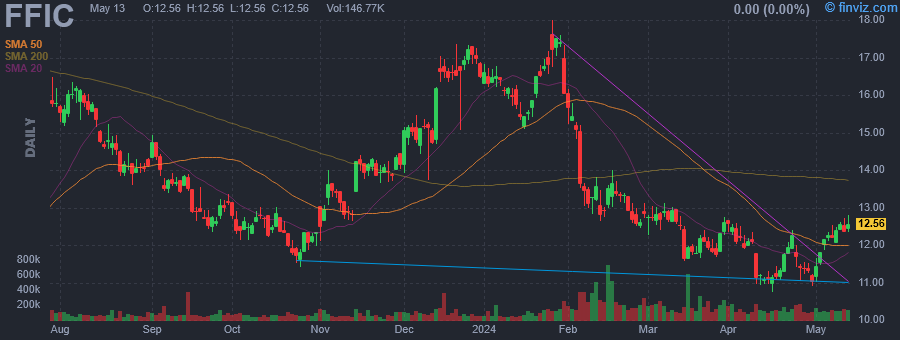
Flushing Financial Corp. operates as a bank holding company, which provides banking and financial services. Its principal business is attracting retail deposits from the general public and investing those deposits together with funds generated from ongoing operations and borrowings, primarily in originations and purchases of multi-family residential properties, commercial business loans, commercial real estate mortgage loans, construction loans, small business administration loans and other small business loans, mortgage loans, U.S. government securities, corporate fixed-income securities and other marketable securities. The company was founded on May 9, 1994 and is headquartered in Uniondale, NY. |
| Insider Trading |
Relationship |
Date |
Transaction |
Cost |
#Shares |
Value ($) |
#Shares Total |
SEC Form 4 |
| KORZEKWINSKI FRANCIS W | Sr. EVP | Feb 29 '24 | Sale | 13.04 | 4,851 | 63,257 | 68,642 | Mar 01 05:11 PM | | KORZEKWINSKI FRANCIS W | Sr. EVP | Feb 28 '24 | Sale | 12.61 | 7,649 | 96,454 | 73,493 | Mar 01 05:11 PM | | BUONAIUTO THOMAS | Sr. EVP | Feb 23 '24 | Sale | 13.21 | 19,000 | 250,990 | 32,391 | Feb 27 05:44 PM | | DIorio Steven J | Director | Dec 18 '23 | Sale | 16.42 | 6,500 | 106,730 | 47,000 | Dec 20 04:39 PM | | Grasso Maria A | SEVP/COO | Nov 29 '23 | Sale | 14.20 | 4,000 | 56,800 | 79,726 | Dec 01 12:45 PM |
|
|
|
 |
| Market Cap | 464.87M | EPS (ttm) | 1.33 |
| P/E | 9.29 | EPS this Y | -3.76% |
| Forward P/E | 9.34 | EPS next Y | 3.52% |
| PEG | 0.52 | EPS past 5Y | 2.72% |
| P/S | 1.82 | EPS next 5Y | 18.00% |
| P/B | 1.15 | EPS Q/Q | -0.89% |
| Dividend | 5.51% | Sales Q/Q | 45.02% |
| Insider Own | 4.50% | Inst Own | 38.60% |
| Insider Trans | -0.00% | Inst Trans | -3.44% |
| Short Float | 1.56% | Earnings | Apr 24/b |
| Analyst Recom | 2.75 | Target Price | 15.25 |
| Avg Volume | 106.75K | 52W Range | 10.38 - 14.75 |
|
|
|
|
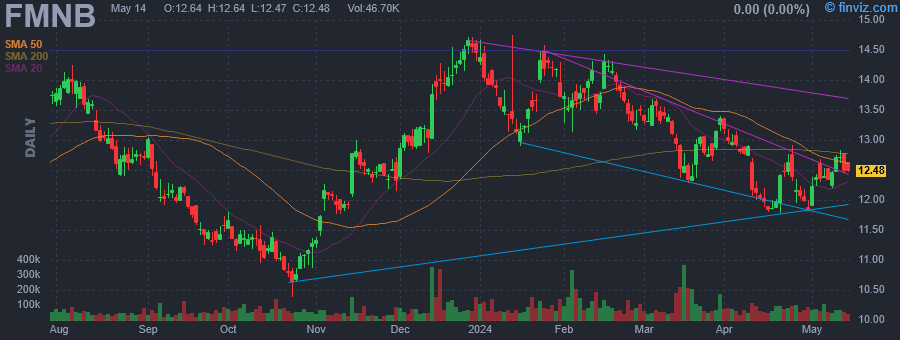
Farmers National Banc Corp. is a bank and financial holding company, engaged in the provision of financial and banking services. It operates through following segments: Bank and Trust. The Bank segment consists of commercial and retail banking services including checking accounts, savings accounts, time deposit accounts, and commercial, mortgage and installment loans. The Trust segment offers personal and corporate trust services in the areas of estate settlement, trust administration, employee benefit plans, and retirement services. The company was founded in 1987 and is headquartered in Canfield, OH. |
| Insider Trading |
Relationship |
Date |
Transaction |
Cost |
#Shares |
Value ($) |
#Shares Total |
SEC Form 4 |
| Richardson Gina A | Director | Feb 14 '24 | Buy | 13.57 | 742 | 10,069 | 3,659 | Feb 14 11:50 AM | | Helmick Kevin J | President & CEO | Feb 01 '24 | Buy | 13.64 | 37 | 505 | 135,489 | Feb 26 11:49 AM | | Wallace Amber B | Sr VP/Chief Retail/Marketing | Feb 01 '24 | Buy | 13.64 | 14 | 191 | 45,044 | Feb 26 11:52 AM | | Richardson Gina A | Director | Jan 30 '24 | Buy | 14.17 | 735 | 10,415 | 2,917 | Jan 31 09:31 AM | | Shaffer Timothy F | SEVP, CCO | Jan 29 '24 | Sale | 14.21 | 4,004 | 56,897 | 33,157 | Jan 31 09:33 AM |
|
|
|
