 |
| Market Cap | 80.20B | EPS (ttm) | 12.03 |
| P/E | 24.33 | EPS this Y | 21.60% |
| Forward P/E | 17.93 | EPS next Y | 11.71% |
| PEG | 1.92 | EPS past 5Y | 1.46% |
| P/S | 1.90 | EPS next 5Y | 12.70% |
| P/B | 3.76 | EPS Q/Q | 1.79% |
| Dividend | 1.91% | Sales Q/Q | 7.53% |
| Insider Own | 0.66% | Inst Own | 88.35% |
| Insider Trans | -7.13% | Inst Trans | -0.93% |
| Short Float | 0.55% | Earnings | Apr 24/b |
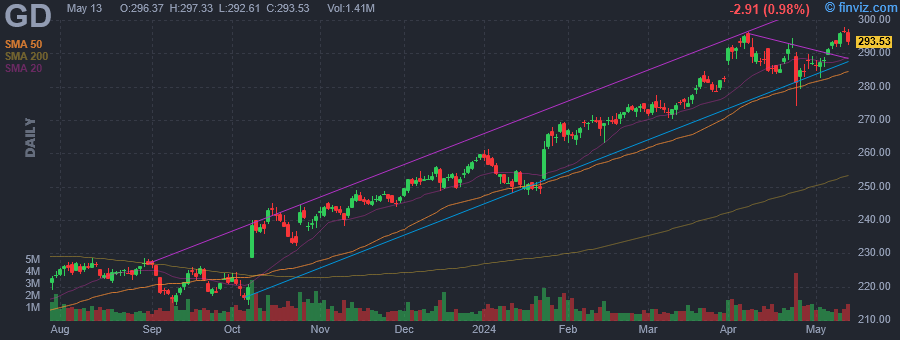
| Analyst Recom | 1.76 | Target Price | 306.20 |
| Avg Volume | 1.03M | 52W Range | 202.35 - 296.50 |
|
|
|
|
General Dynamics Corp. is a global aerospace and defense company, which engages in design, engineering, and manufacturing to deliver solutions. It operates through the following business segments: Aerospace, Marine Systems, Combat Systems, and Technologies. The Aerospace segment includes the production of business jets, technology aircraft, repair, support and completion services. The Marine Systems segment involves the design and building of nuclear-powered submarines, surface combatant, and auxiliary ship design and construction. The Combat Systems segment focuses on manufacturing and integrating land combat solutions, wheeled and tracked combat vehicles, weapons systems and munitions. The Technologies segment consists of services, technologies, and products for electronic hardware with its software. The company was founded on February 21, 1952 and is headquartered in Reston, VA. |
| Insider Trading |
Relationship |
Date |
Transaction |
Cost |
#Shares |
Value ($) |
#Shares Total |
SEC Form 4 |
| Deep Danny | Vice President | Mar 01 '24 | Option Exercise | 135.85 | 8,360 | 1,135,706 | 28,477 | Mar 05 04:31 PM | | Smith Robert Edward | Executive Vice President | Jan 30 '24 | Option Exercise | 135.85 | 19,320 | 2,624,622 | 64,141 | Feb 01 03:55 PM | | NOVAKOVIC PHEBE N | Chairman and CEO | Jan 29 '24 | Sale | 264.31 | 32,355 | 8,551,758 | 773,977 | Jan 30 03:38 PM | | NOVAKOVIC PHEBE N | Chairman and CEO | Jan 26 '24 | Option Exercise | 191.71 | 211,620 | 40,569,670 | 985,597 | Jan 30 03:38 PM | | Roualet Mark C. | Executive Vice President | Jan 26 '24 | Option Exercise | 135.85 | 73,330 | 9,961,880 | 222,535 | Jan 30 03:41 PM |
|
|
 |
 |
| Market Cap | 3.78B | EPS (ttm) | 42.56 |
| P/E | 6.57 | EPS this Y | -12.64% |
| Forward P/E | 7.12 | EPS next Y | 1.45% |
| PEG | - | EPS past 5Y | 40.41% |
| P/S | 0.21 | EPS next 5Y | -1.70% |
| P/B | 1.43 | EPS Q/Q | -27.22% |
| Dividend | 0.65% | Sales Q/Q | 10.10% |
| Insider Own | 3.93% | Inst Own | 104.61% |
| Insider Trans | 0.00% | Inst Trans | -2.40% |
| Short Float | 16.57% | Earnings | Apr 24/b |
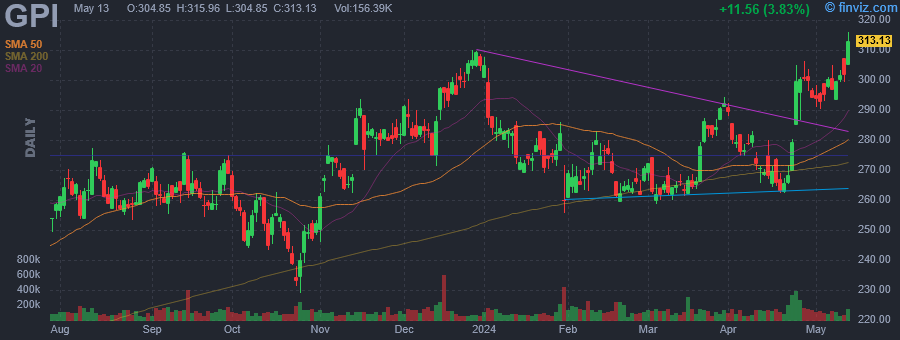
| Analyst Recom | 1.78 | Target Price | 323.49 |
| Avg Volume | 146.19K | 52W Range | 214.25 - 310.08 |
|
|
|
|
Group 1 Automotive, Inc. engages in the automotive retailing industry. The firm operates through the following geographical segments: U.S, the UK, and Brazil. It also sells new and used cars and light trucks, arranges related vehicle financing, sells service contracts, provides automotive maintenance and repair services, and sells vehicle parts. The company was founded in 1995 and is headquartered in Houston, TX. |
| Insider Trading |
Relationship |
Date |
Transaction |
Cost |
#Shares |
Value ($) |
#Shares Total |
SEC Form 4 |
| MCHENRY DANIEL JAMES | SVP & CFO | Sep 18 '23 | Sale | 264.96 | 2,259 | 598,584 | 19,355 | Sep 20 11:56 AM | | BARTH CARIN MARCY | Director | Aug 30 '23 | Sale | 267.00 | 2,131 | 568,977 | 0 | Aug 31 10:46 AM | | Kenningham Daryl | President & CEO | Aug 18 '23 | Sale | 262.41 | 9,500 | 2,492,932 | 13,836 | Sep 01 04:58 PM | | Kenningham Daryl | President & CEO | Aug 18 '23 | Sale | 262.41 | 9,500 | 2,492,932 | 24,548 | Aug 21 05:09 PM | | JONES MICHAEL DAVID | Sr. Vice President, Aftersales | Aug 09 '23 | Sale | 257.68 | 850 | 219,028 | 12,040 | Aug 11 02:56 PM |
|
|
|
 |
| Market Cap | 8.07B | EPS (ttm) | -10.72 |
| P/E | - | EPS this Y | 30.59% |
| Forward P/E | 14.80 | EPS next Y | 19.84% |
| PEG | - | EPS past 5Y | - |
| P/S | 1.61 | EPS next 5Y | 17.70% |
| P/B | 7.60 | EPS Q/Q | -719.67% |
| Dividend | 4.87% | Sales Q/Q | -23.14% |
| Insider Own | 6.53% | Inst Own | 88.46% |
| Insider Trans | 0.00% | Inst Trans | -0.62% |
| Short Float | 6.34% | Earnings | Apr 24/b |
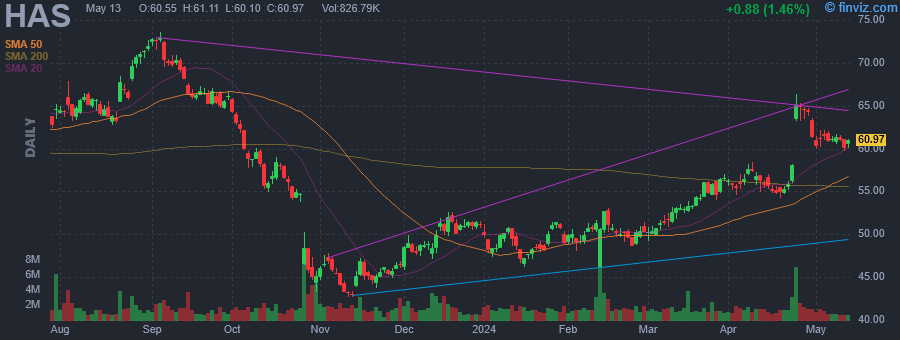
| Analyst Recom | 1.88 | Target Price | 59.26 |
| Avg Volume | 1.72M | 52W Range | 42.66 - 73.57 |
|
|
|
|
Hasbro, Inc. engages in the provision of children and family leisure time products and services with a portfolio of brands and entertainment properties. The firm's brands of toys include Power Rangers, Magic: The Gathering, Monopoly, My Little Pony, Nerf, Play-Doh and Transformers. It operates through the following segments: Consumer Products, Wizards of the Coast and Digital Gaming, Entertainment, and Corporate and Other. The Consumer Products segment markets and sells toys and game products around the world. It also promotes brands through the out-licensing of trademarks, characters and other brand and intellectual property rights to third parties, and through the sale of branded consumer products such as toys and apparel. The Wizards of the Coast and Digital Gaming segment promotes the company's brands through the development of trading cards, role-playing and digital game experiences based on Hasbro and Wizards of the Coast properties. The Entertainment segment develops and distributes entertainment content including film, scripted and unscripted television, children's programming, digital content, and live entertainment. The Corporate and Other segment includes the management and administrative services to its principal reporting segments. The company was founded by Henry Hassenfeld and Hilal Hassenfeld in 1923 and is headquartered in Pawtucket, RI. |
|
| |
 |
| Market Cap | 879.28M | EPS (ttm) | 0.52 |
| P/E | 23.09 | EPS this Y | 3.29% |
| Forward P/E | 14.03 | EPS next Y | 8.49% |
| PEG | 2.57 | EPS past 5Y | -14.34% |
| P/S | 0.53 | EPS next 5Y | 9.00% |
| P/B | 1.92 | EPS Q/Q | 40.77% |
| Dividend | - | Sales Q/Q | -0.04% |
| Insider Own | 0.77% | Inst Own | 100.87% |
| Insider Trans | -0.20% | Inst Trans | -6.08% |
| Short Float | 4.04% | Earnings | Apr 24/b |
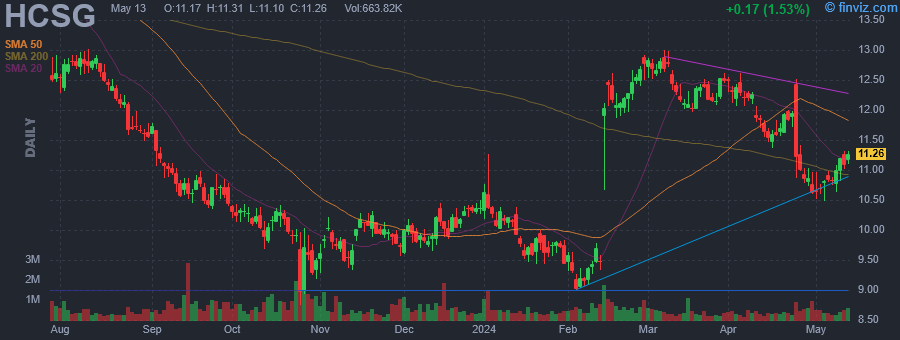
| Analyst Recom | 2.20 | Target Price | 14.50 |
| Avg Volume | 512.48K | 52W Range | 8.75 - 15.97 |
|
|
|
|
Healthcare Services Group, Inc. engages in the provision of healthcare management, administrative, and services. It operates through the Housekeeping and Dietary segments. The Housekeeping segment involves the cleaning, disinfecting, and sanitizing of patient rooms and common areas of a client facility, laundering, and processing of personal clothing belonging to patients. The Dietary segment includes the food purchasing, meal preparation, development of menus, and the provision of dietician consulting professional services. The company was founded by Daniel P. McCartney on November 22, 1976 and is headquartered in Bensalem, PA. |
| Insider Trading |
Relationship |
Date |
Transaction |
Cost |
#Shares |
Value ($) |
#Shares Total |
SEC Form 4 |
| Brophy Andrew M | Principal Accounting Officer | Feb 28 '24 | Sale | 12.58 | 1,125 | 14,152 | 7,741 | Feb 29 06:16 PM | | SHEA JOHN CHRISTOPHER | EVP & Chief Admin. Officer | Feb 24 '24 | Option Exercise | 0.00 | 4,416 | 0 | 43,086 | Feb 27 08:12 PM | | Orr Patrick J | EVP & Chief Revenue Officer | Feb 24 '24 | Option Exercise | 0.00 | 3,340 | 0 | 23,394 | Feb 27 08:16 PM | | Bundick Jason J | EVP/Gen. Counsel/Corp. Secty. | Feb 24 '24 | Option Exercise | 0.00 | 3,375 | 0 | 32,782 | Feb 27 08:18 PM | | WAHL Theodore | President & CEO | Feb 24 '24 | Option Exercise | 0.00 | 22,238 | 0 | 373,845 | Feb 27 08:22 PM |
|
|
|
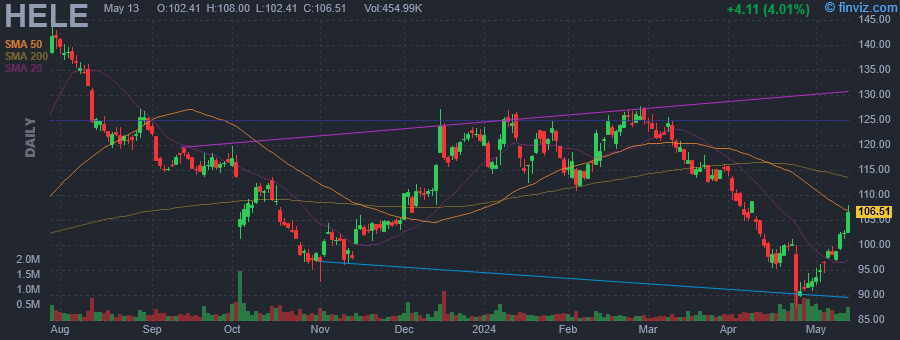 |
| Market Cap | 2.38B | EPS (ttm) | 6.77 |
| P/E | 14.81 | EPS this Y | - |
| Forward P/E | 10.32 | EPS next Y | - |
| PEG | 1.85 | EPS past 5Y | 30.50% |
| P/S | 1.19 | EPS next 5Y | 8.00% |
| P/B | 1.50 | EPS Q/Q | 48.51% |
| Dividend | - | Sales Q/Q | -0.85% |
| Insider Own | 1.31% | Inst Own | 112.20% |
| Insider Trans | 0.00% | Inst Trans | -3.40% |
| Short Float | 14.40% | Earnings | Apr 24/b |
| Analyst Recom | 1.86 | Target Price | 148.10 |
| Avg Volume | 215.13K | 52W Range | 81.14 - 143.68 |
|
|
|
|
Helen of Troy Ltd. engages in the manufacture and distribution of personal care and household products. It operates through the Home and Outdoor, and Beauty and Wellness segments. The Home and Outdoor segment offers food preparation tools, containers, electronics, baby care, and cleaning products. The Beauty and Wellness segment develops and provides products including mass and prestige market beauty appliances, prestige market liquid-based hair and personal care products, and wellness devices including thermometers, water and air filtration systems, humidifiers, and fans. The company was founded by Gerald J. Rubin and Stanlee N. Rubin in 1968 and is headquartered in Hamilton, Bermuda. |
| Insider Trading |
Relationship |
Date |
Transaction |
Cost |
#Shares |
Value ($) |
#Shares Total |
SEC Form 4 |
| Grass Brian | Chief Financial Officer | May 11 '23 | Buy | 96.13 | 5,000 | 480,645 | 35,835 | May 11 05:35 PM |
|
|
| |
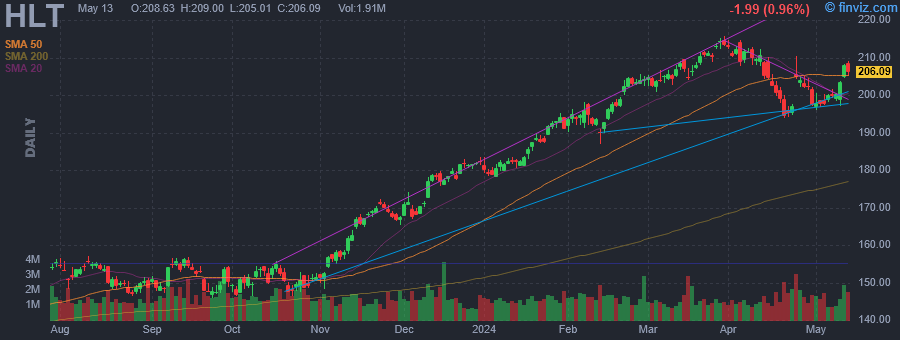 |
| Market Cap | 49.69B | EPS (ttm) | 4.32 |
| P/E | 45.62 | EPS this Y | 14.36% |
| Forward P/E | 23.92 | EPS next Y | 15.98% |
| PEG | 2.94 | EPS past 5Y | 11.53% |
| P/S | 4.85 | EPS next 5Y | 15.50% |
| P/B | - | EPS Q/Q | -52.75% |
| Dividend | 0.33% | Sales Q/Q | 6.75% |
| Insider Own | 2.08% | Inst Own | 97.87% |
| Insider Trans | -1.14% | Inst Trans | -2.92% |
| Short Float | 1.28% | Earnings | Apr 24/b |
| Analyst Recom | 2.28 | Target Price | 214.09 |
| Avg Volume | 1.50M | 52W Range | 134.43 - 215.79 |
|
|
|
|
Hilton Worldwide Holdings, Inc. engages in the provision of hospitality businesses. It operates through the Management and Franchise, and Ownership segments. The Management and Franchise segment operates hotels of third-party owners. The Ownership segment includes owned, leased, and joint venture hotels. The company was founded by Conrad N. Hilton in 1925 and is headquartered in McLean, VA. |
| Insider Trading |
Relationship |
Date |
Transaction |
Cost |
#Shares |
Value ($) |
#Shares Total |
SEC Form 4 |
| NASSETTA CHRISTOPHER J | See Remarks | Feb 09 '24 | Option Exercise | 45.46 | 53,488 | 2,431,564 | 2,589,966 | Feb 09 04:46 PM | | NASSETTA CHRISTOPHER J | See Remarks | Feb 09 '24 | Sale | 192.83 | 22,095 | 4,260,653 | 2,567,871 | Feb 09 04:46 PM | | NASSETTA CHRISTOPHER J | See Remarks | Feb 08 '24 | Option Exercise | 45.46 | 21,489 | 976,890 | 2,557,967 | Feb 09 04:46 PM | | NASSETTA CHRISTOPHER J | See Remarks | Feb 08 '24 | Sale | 195.68 | 21,489 | 4,205,070 | 2,536,478 | Feb 09 04:46 PM | | Silcock Christopher W | See Remarks | Nov 16 '23 | Option Exercise | 45.46 | 4,685 | 212,980 | 69,119 | Nov 17 04:55 PM |
|
|
|
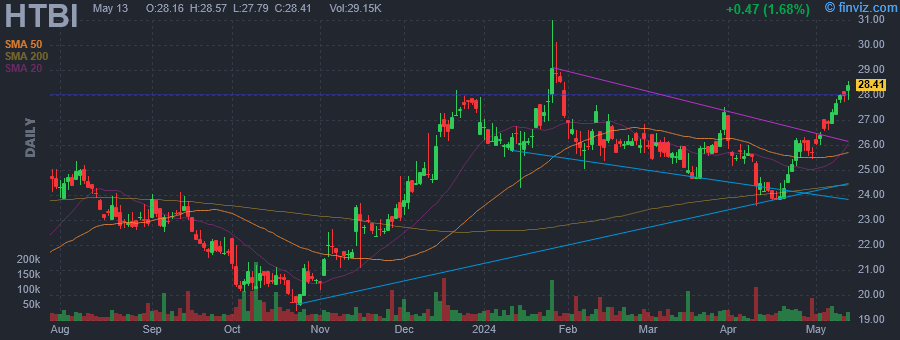 |
| Market Cap | 440.19M | EPS (ttm) | 2.97 |
| P/E | 8.49 | EPS this Y | -24.13% |
| Forward P/E | 8.63 | EPS next Y | 0.57% |
| PEG | 1.06 | EPS past 5Y | 15.18% |
| P/S | 1.66 | EPS next 5Y | 8.00% |
| P/B | 0.88 | EPS Q/Q | -11.12% |
| Dividend | 1.76% | Sales Q/Q | 46.35% |
| Insider Own | 17.00% | Inst Own | 56.16% |
| Insider Trans | 0.03% | Inst Trans | -1.60% |
| Short Float | 0.45% | Earnings | Apr 24/b |
| Analyst Recom | 1.33 | Target Price | 33.17 |
| Avg Volume | 32.90K | 52W Range | 18.02 - 30.99 |
|
|
|
|
HomeTrust Bancshares, Inc. operates as a bank holding company, which engages in the business of planning, directing, and coordinating business activities of HomeTrust Bank. The company was founded on July 10, 2012 and is headquartered in Asheville, NC. |
| Insider Trading |
Relationship |
Date |
Transaction |
Cost |
#Shares |
Value ($) |
#Shares Total |
SEC Form 4 |
| Williams Richard Tyrone | Director | Nov 02 '23 | Buy | 21.30 | 1,000 | 21,300 | 22,622 | Nov 06 09:34 AM | | JAMES ROBERT E. | Director | May 19 '23 | Buy | 20.02 | 2,500 | 50,052 | 16,447 | May 22 12:53 PM | | KENDALL LAURA C | Director | May 12 '23 | Buy | 18.45 | 1,000 | 18,449 | 20,622 | May 16 12:17 PM | | Williams Richard Tyrone | Director | May 10 '23 | Buy | 18.40 | 1,000 | 18,398 | 21,622 | May 12 08:56 AM | | Switzer John | Director | May 09 '23 | Buy | 18.78 | 521 | 9,784 | 6,143 | May 10 04:12 PM |
|
|
| |
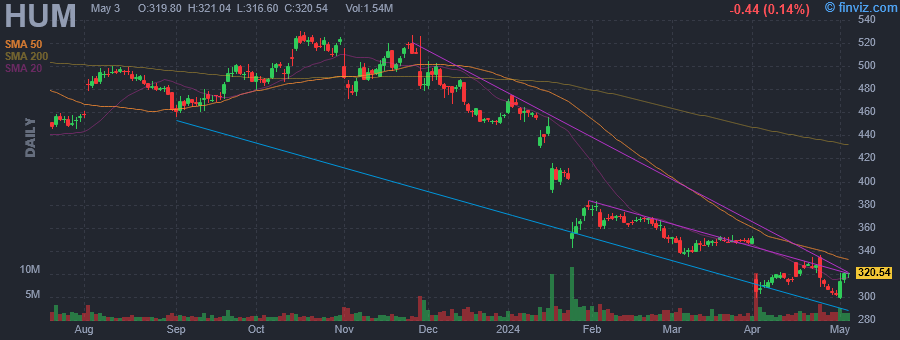 |
| Market Cap | 39.54B | EPS (ttm) | 19.83 |
| P/E | 16.54 | EPS this Y | -37.33% |
| Forward P/E | 14.43 | EPS next Y | 38.96% |
| PEG | 7.43 | EPS past 5Y | 10.46% |
| P/S | 0.37 | EPS next 5Y | 2.23% |
| P/B | 2.47 | EPS Q/Q | -3599.92% |
| Dividend | 1.19% | Sales Q/Q | 17.93% |
| Insider Own | 0.35% | Inst Own | 94.68% |
| Insider Trans | 0.13% | Inst Trans | -0.34% |
| Short Float | 2.04% | Earnings | Apr 24/b |
| Analyst Recom | 1.96 | Target Price | 376.32 |
| Avg Volume | 1.91M | 52W Range | 299.23 - 541.21 |
|
|
|
|
Humana Inc. engages in the provision of health insurance services. It operates through the Insurance and CenterWell segments. The Insurance segment consists of Medicare benefits, marketed to individuals or directly via group Medicare accounts, as well as contract with CMS to administer the Limited Income Newly Eligible Transition, or LI-NET, prescription drug plan program and contracts with various states to provide Medicaid, dual eligible demonstration, and Long-Term Support Services benefits, which refer to as state-based contracts. The CenterWell segment represents payor-agnostic healthcare services offerings, including pharmacy dispensing services, provider services, and home services. The company was founded by David A. Jones, Sr., and Wendell Cherry on August 18, 1961 and is headquartered in Louisville, KY. |
| Insider Trading |
Relationship |
Date |
Transaction |
Cost |
#Shares |
Value ($) |
#Shares Total |
SEC Form 4 |
| Agrawal Vishal | Chief Strat & Corp Dev Officer | Feb 22 '24 | Option Exercise | 0.00 | 3,010 | 0 | 11,845 | Feb 23 01:08 PM | | Diamond Susan M | Chief Financial Officer | Feb 22 '24 | Option Exercise | 0.00 | 3,356 | 0 | 7,436 | Feb 23 12:09 PM | | Renaudin George II | President, Medicare & Medicaid | Feb 22 '24 | Option Exercise | 0.00 | 1,104 | 0 | 2,651 | Feb 23 11:53 AM | | BROUSSARD BRUCE D | Chief Executive Officer | Feb 22 '24 | Option Exercise | 0.00 | 22,572 | 0 | 96,817 | Feb 23 01:10 PM | | Deshpande Samir | Chief Information Officer | Feb 22 '24 | Option Exercise | 0.00 | 3,770 | 0 | 13,698 | Feb 23 01:21 PM |
|
|
|
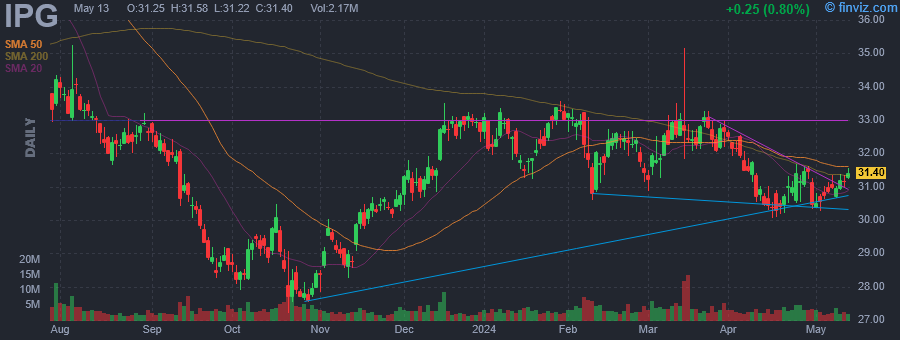 |
| Market Cap | 11.74B | EPS (ttm) | 2.85 |
| P/E | 10.87 | EPS this Y | -4.13% |
| Forward P/E | 10.12 | EPS next Y | 6.79% |
| PEG | 1.81 | EPS past 5Y | 12.34% |
| P/S | 1.08 | EPS next 5Y | 6.00% |
| P/B | 2.98 | EPS Q/Q | 59.38% |
| Dividend | 4.23% | Sales Q/Q | 1.25% |
| Insider Own | 0.35% | Inst Own | 102.50% |
| Insider Trans | -15.85% | Inst Trans | -1.19% |
| Short Float | 4.70% | Earnings | Apr 24/b |
| Analyst Recom | 2.25 | Target Price | 35.28 |
| Avg Volume | 4.21M | 52W Range | 27.20 - 40.95 |
|
|
|
|
Interpublic Group of Cos., Inc. engages in the provision of marketing, communications, and business transformation services. It operates through the following segments: Media, Data, and Engagement Solutions, Integrated Advertising and Creativity Led Solutions, and Specialized Communications and Experiential Solutions. The Media, Data, and Engagement Solutions segment provides global media and communications services, digital services and products, advertising and marketing technology, e-commerce services, data management and analytics, strategic consulting, and digital brand experience. The Integrated Advertising and Creativity Led Solutions segment offers advertising, corporate and brand identity services, and strategic consulting. The Specialized Communications and Experiential Solutions segment includes global public relations and other specialized communications services, events, sports and entertainment marketing, and strategic consulting. The company was founded on September 18, 1930 and is headquartered in New York, NY. |
| Insider Trading |
Relationship |
Date |
Transaction |
Cost |
#Shares |
Value ($) |
#Shares Total |
SEC Form 4 |
| KRAKOWSKY PHILIPPE | CEO | Feb 27 '24 | Sale | 32.20 | 150,403 | 4,842,977 | 415,776 | Feb 28 04:41 PM | | Bonzani Andrew | EVP, General Counsel | Feb 27 '24 | Sale | 32.20 | 40,468 | 1,303,070 | 70,431 | Feb 28 04:29 PM | | Johnson Ellen Tobi | CFO | Feb 27 '24 | Sale | 32.20 | 40,393 | 1,300,655 | 88,350 | Feb 28 04:55 PM | | CARROLL CHRISTOPHER F | SVP, Controller & CAO | Feb 27 '24 | Sale | 32.20 | 18,382 | 591,900 | 42,390 | Feb 28 05:08 PM |
|
|
|
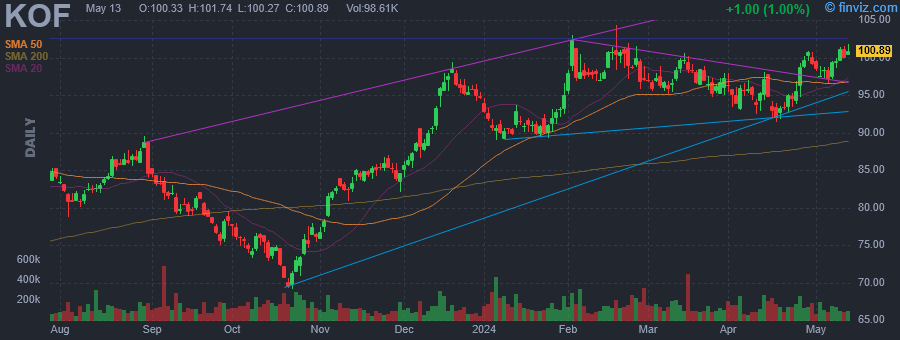 |
| Market Cap | 4.96B | EPS (ttm) | 5.29 |
| P/E | 17.88 | EPS this Y | 11.82% |
| Forward P/E | 13.89 | EPS next Y | 11.62% |
| PEG | 1.58 | EPS past 5Y | 14.07% |
| P/S | 0.35 | EPS next 5Y | 11.30% |
| P/B | 2.65 | EPS Q/Q | -15.44% |
| Dividend | 3.86% | Sales Q/Q | 20.95% |
| Insider Own | 5.19% | Inst Own | 43.20% |
| Insider Trans | 0.00% | Inst Trans | 0.84% |
| Short Float | 0.68% | Earnings | Apr 24/b |
| Analyst Recom | 1.75 | Target Price | 110.54 |
| Avg Volume | 157.63K | 52W Range | 69.12 - 104.38 |
|
|
|
|
Coca-Cola FEMSA SAB de CV engages in the business of producing franchise bottles of trademark beverages. It operates under the Mexico and Central America, and South America segments. The Mexico and Central America segment includes Mexico, Guatemala, Nicaragua, Costa Rica, and Panama. The South America segment focuses on Colombia, Brazil, Argentina, and Uruguay. The company was founded on October 30, 1991 and is headquartered in Mexico City, Mexico. |
|
|
