 |
| Market Cap | 11.24B | EPS (ttm) | 0.12 |
| P/E | 212.91 | EPS this Y | 154.07% |
| Forward P/E | 14.19 | EPS next Y | 58.53% |
| PEG | - | EPS past 5Y | - |
| P/S | 1.44 | EPS next 5Y | -2.90% |
| P/B | 3.55 | EPS Q/Q | 240.76% |
| Dividend | 0.94% | Sales Q/Q | 22.31% |
| Insider Own | 1.06% | Inst Own | 99.09% |
| Insider Trans | -31.94% | Inst Trans | -1.18% |
| Short Float | 2.22% | Earnings | Apr 25/b |
| Analyst Recom | 1.75 | Target Price | 27.61 |
| Avg Volume | 4.79M | 52W Range | 12.64 - 27.26 |
|
|
|
|
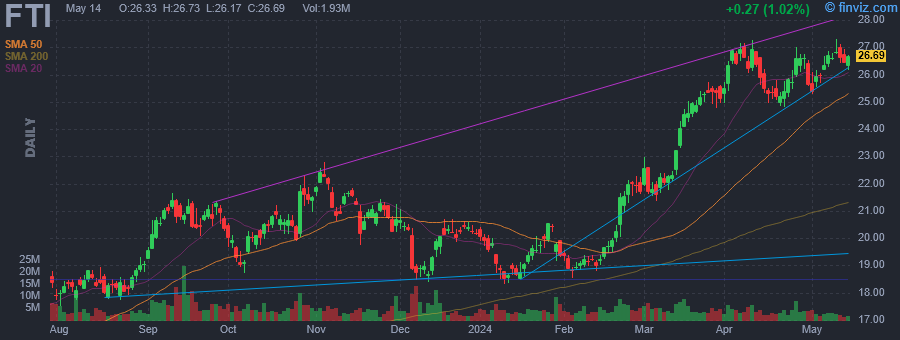
TechnipFMC plc is an energy service company, which engages in the provision of solutions for the production and transformation of hydrocarbons. It operates through the following segments: Subsea and Surface Technologies. The Subsea segment designs and manufactures products and systems, performs engineering, procurement and project management, and provides services used by oil and gas companies involved in offshore exploration and production of crude oil and natural gas. The Surface Technologies segment designs and manufactures products and systems, and provides services used by oil and gas companies involved in land and offshore exploration and production of crude oil and natural gas. The company was founded in 1884 and is headquartered in Houston, TX. |
| Insider Trading |
Relationship |
Date |
Transaction |
Cost |
#Shares |
Value ($) |
#Shares Total |
SEC Form 4 |
| Pferdehirt Douglas J. | Chair and CEO | Mar 04 '24 | Sale | 21.85 | 1,371,235 | 29,961,485 | 2,687,307 | Mar 05 04:57 PM | | Rounce Justin | EVP & Chief Technology Officer | Mar 04 '24 | Sale | 21.87 | 329,469 | 7,205,487 | 406,598 | Mar 05 05:02 PM | | Melin Alf | EVP & Chief Financial Officer | Mar 04 '24 | Sale | 21.87 | 251,947 | 5,510,081 | 147,446 | Mar 05 04:58 PM | | Landes Jonathan | President, Subsea | Mar 04 '24 | Sale | 21.88 | 153,428 | 3,357,005 | 117,646 | Mar 05 04:57 PM | | Melin Alf | EVP & Chief Financial Officer | Mar 01 '24 | Sale | 21.98 | 40,475 | 889,640 | 562,858 | Mar 05 04:58 PM |
|
|
 |
 |
| Market Cap | 39.77B | EPS (ttm) | - |
| P/E | - | EPS this Y | 275.96% |
| Forward P/E | 26.06 | EPS next Y | 52.51% |
| PEG | - | EPS past 5Y | - |
| P/S | - | EPS next 5Y | - |
| P/B | - | EPS Q/Q | - |
| Dividend | - | Sales Q/Q | - |
| Insider Own | 0.00% | Inst Own | 33.34% |
| Insider Trans | - | Inst Trans | - |
| Short Float | 1.42% | Earnings | Apr 25/b |
| Analyst Recom | 1.82 | Target Price | 157.44 |
| Avg Volume | 7.08M | 52W Range | 115.00 - 152.48 |
|
|
|
|
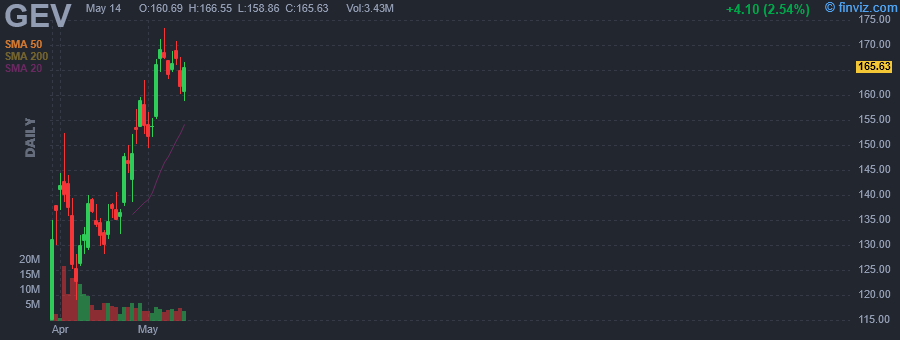
GE Vernova, Inc. is a electric power industry. Its products and services generate, transfer, orchestrate, convert, and store electricity. The firm operates through the following segments: Power, Wind and Electrification. The Power segment includes design, manufacture, and servicing of gas, nuclear, hydro, and steam technologies, providing a critical foundation of dispatchable, flexible, stable, and reliable power. The Wind segment includes wind generation technologies, inclusive of onshore and offshore wind turbines and blades. The Electrification segment includes grid solutions, power conversion, electrification software, and solar and storage solutions technologies required for the transmission, distribution, conversion, storage, and orchestration of electricity from point of generation to point of consumption. The Company was founded November 09, 2021 and is headquartered in Cambridge, Massachusetts. |
|
|
 |
| Market Cap | 2.35B | EPS (ttm) | -1.29 |
| P/E | - | EPS this Y | 706.22% |
| Forward P/E | 6.57 | EPS next Y | 30.26% |
| PEG | - | EPS past 5Y | - |
| P/S | 0.60 | EPS next 5Y | 8.50% |
| P/B | - | EPS Q/Q | -6.37% |
| Dividend | - | Sales Q/Q | 5.23% |
| Insider Own | 3.94% | Inst Own | 82.80% |
| Insider Trans | -65.99% | Inst Trans | 1.03% |
| Short Float | 2.44% | Earnings | Apr 25/b |
| Analyst Recom | 1.50 | Target Price | 14.00 |
| Avg Volume | 1.10M | 52W Range | 6.43 - 10.16 |
|
|
|
|
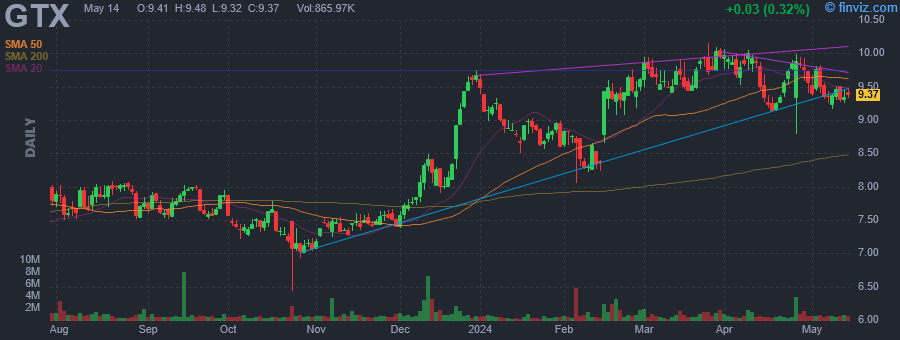
Garrett Motion, Inc. provides automobile technology. The firm engages in the design, manufacture, and sale of engineered turbocharger, electric motor technologies for original equipment manufacturers and distributors within the mobility and industrial space. It offers light vehicle gasoline, light vehicle diesel, and commercial vehicle turbochargers. The company was founded on March 14, 2018 and is headquartered in Rolle, Switzerland. |
| Insider Trading |
Relationship |
Date |
Transaction |
Cost |
#Shares |
Value ($) |
#Shares Total |
SEC Form 4 |
| CYRUS CAPITAL PARTNERS, L.P. | 10% Owner | Apr 09 '24 | Sale | 9.99 | 271,889 | 2,717,286 | 27,341,177 | Apr 10 04:55 PM | | CYRUS CAPITAL PARTNERS, L.P. | 10% Owner | Apr 08 '24 | Sale | 9.96 | 58,306 | 580,634 | 27,613,066 | Apr 10 04:55 PM | | CYRUS CAPITAL PARTNERS, L.P. | 10% Owner | Apr 01 '24 | Sale | 10.00 | 163,027 | 1,631,004 | 27,671,372 | Apr 03 06:42 PM | | CYRUS CAPITAL PARTNERS, L.P. | 10% Owner | Mar 28 '24 | Sale | 10.02 | 182,885 | 1,832,380 | 27,834,399 | Mar 28 05:28 PM | | CYRUS CAPITAL PARTNERS, L.P. | 10% Owner | Mar 27 '24 | Sale | 10.01 | 250,000 | 2,502,850 | 28,017,284 | Mar 28 05:28 PM |
|
|
| |
 |
| Market Cap | 47.12B | EPS (ttm) | 36.46 |
| P/E | 26.29 | EPS this Y | 7.60% |
| Forward P/E | 22.03 | EPS next Y | 10.24% |
| PEG | 1.82 | EPS past 5Y | 21.61% |
| P/S | 2.86 | EPS next 5Y | 14.44% |
| P/B | 15.17 | EPS Q/Q | 5.48% |
| Dividend | 0.82% | Sales Q/Q | 5.13% |
| Insider Own | 9.42% | Inst Own | 73.70% |
| Insider Trans | -0.53% | Inst Trans | 0.91% |
| Short Float | 2.92% | Earnings | Apr 25/b |
| Analyst Recom | 3.12 | Target Price | 985.25 |
| Avg Volume | 231.14K | 52W Range | 641.95 - 1034.18 |
|
|
|
|
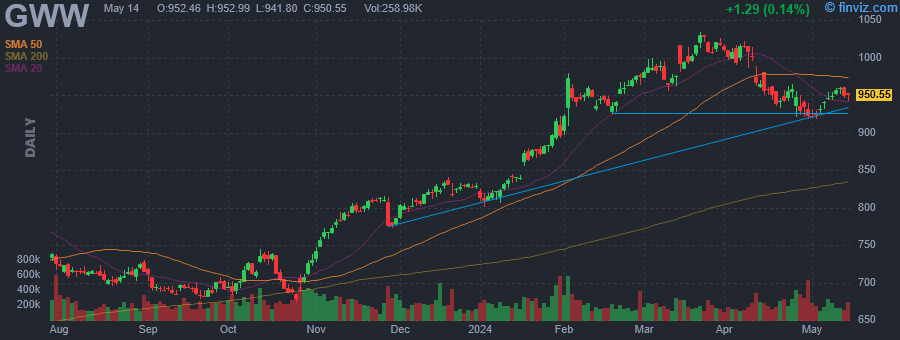
W.W. Grainger, Inc. is a distributor of maintenance, repair, and operating products and services with operations in North America, Japan, and the United Kingdom. It operates through the following segments: High-Touch Solutions North America, Endless Assortment, and Other. The High-Touch Solutions North America segment includes value-added MRO solutions that are rooted in deep product knowledge and customer expertise. The Endless Assortment segment provides a streamlined and transparent online platform with one-stop shopping for millions of products. The Other segment refers to the company's Cromwell business in the U.K. and a wholly owned captive insurance entity. The company was founded by William Wallace Grainger in 1928 and is headquartered in Lake Forest, IL. |
| Insider Trading |
Relationship |
Date |
Transaction |
Cost |
#Shares |
Value ($) |
#Shares Total |
SEC Form 4 |
| Robbins Paige K | Sr. VP | Feb 29 '24 | Option Exercise | 234.38 | 3,813 | 893,691 | 8,722 | Feb 29 04:42 PM | | Robbins Paige K | Sr. VP | Feb 29 '24 | Sale | 968.88 | 3,813 | 3,694,328 | 4,909 | Feb 29 04:42 PM | | Merriwether Deidra C | Sr. VP & CFO | Feb 08 '24 | Option Exercise | 249.39 | 8,301 | 2,070,195 | 17,584 | Feb 12 04:05 PM | | Merriwether Deidra C | Sr. VP & CFO | Feb 08 '24 | Sale | 950.40 | 8,301 | 7,889,243 | 9,283 | Feb 12 04:05 PM | | Robbins Paige K | Sr. VP | Feb 07 '24 | Option Exercise | 231.88 | 3,122 | 723,929 | 8,031 | Feb 09 07:12 PM |
|
|
|
 |
| Market Cap | 48.88B | EPS (ttm) | 4.49 |
| P/E | 35.42 | EPS this Y | 63.28% |
| Forward P/E | 14.90 | EPS next Y | 29.53% |
| PEG | 4.46 | EPS past 5Y | - |
| P/S | 4.57 | EPS next 5Y | 7.95% |
| P/B | 5.44 | EPS Q/Q | -33.77% |
| Dividend | 1.23% | Sales Q/Q | -22.24% |
| Insider Own | 9.69% | Inst Own | 81.05% |
| Insider Trans | -1.05% | Inst Trans | -0.09% |
| Short Float | 2.02% | Earnings | Apr 25/b |
| Analyst Recom | 2.41 | Target Price | 172.92 |
| Avg Volume | 2.63M | 52W Range | 124.27 - 167.75 |
|
|
|
|
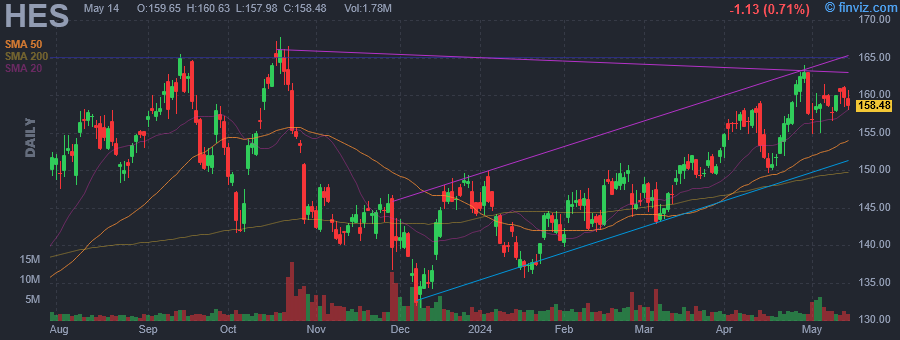
Hess Corp is an exploration and production company, which engages in exploration, development, production, transportation, purchase & sale of crude oil, natural gas liquids and natural gas with production operations. It operates through the following segments: Exploration and Production and Midstream. The Exploration and Production segment explores for, develops, produces, purchases and sells crude oil, natural gas liquids and natural gas. The Midstream segment provides fee-based services including crude oil and natural gas gathering, processing of natural gas and the fractionation of natural gas liquids, transportation of crude oil by rail car, terminaling and loading crude oil and natural gas liquids, and the storage and terminaling of propane, primarily in the Bakken shale play of North Dakota. The company was founded by Leon Hess in 1920 and is headquartered in New York, NY. |
| Insider Trading |
Relationship |
Date |
Transaction |
Cost |
#Shares |
Value ($) |
#Shares Total |
SEC Form 4 |
| Schoonman Geurt G | Senior Vice President | Mar 20 '24 | Option Exercise | 87.21 | 6,521 | 568,693 | 44,465 | Mar 21 04:33 PM | | Schoonman Geurt G | Senior Vice President | Mar 20 '24 | Sale | 151.08 | 13,921 | 2,103,130 | 33,581 | Mar 21 04:33 PM | | Slentz Andrew P | Senior Vice President | Mar 19 '24 | Option Exercise | 56.74 | 13,827 | 784,544 | 64,042 | Mar 21 04:33 PM | | Slentz Andrew P | Senior Vice President | Mar 19 '24 | Sale | 151.08 | 20,254 | 3,060,074 | 43,788 | Mar 21 04:33 PM | | Hill Gregory P. | COO and President, E&P | Mar 07 '24 | Sale | 144.52 | 4,708 | 680,400 | 125,670 | Mar 08 05:10 PM |
|
|
| |
 |
| Market Cap | 2.85B | EPS (ttm) | 2.08 |
| P/E | 17.11 | EPS this Y | 32.99% |
| Forward P/E | 11.03 | EPS next Y | 16.76% |
| PEG | 1.54 | EPS past 5Y | 10.77% |
| P/S | 2.11 | EPS next 5Y | 11.14% |
| P/B | 7.16 | EPS Q/Q | 10.90% |
| Dividend | 7.39% | Sales Q/Q | 13.32% |
| Insider Own | 1.91% | Inst Own | 76.99% |
| Insider Trans | -88.29% | Inst Trans | 0.11% |
| Short Float | 6.23% | Earnings | Apr 25/b |
| Analyst Recom | 2.00 | Target Price | 37.60 |
| Avg Volume | 904.33K | 52W Range | 26.86 - 36.84 |
|
|
|
|
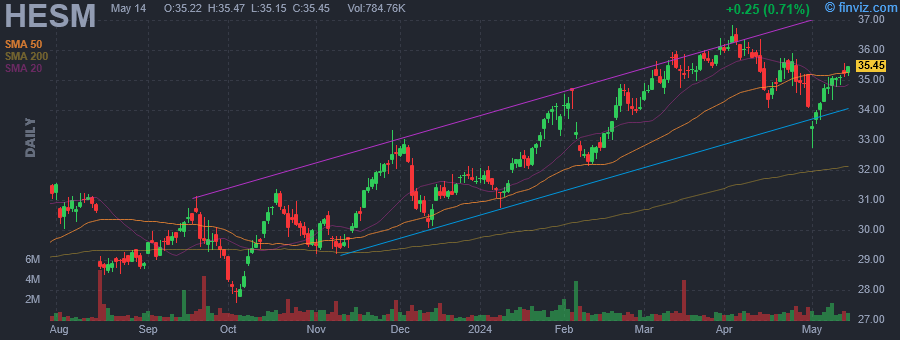
Hess Midstream LP engages in the ownership, development, and acquisition of midstream assets to provide services to third-party crude oil and natural gas producers. It operates through the following segments: Gathering, Processing and Storage, and Terminaling and Export. The Gathering segment consists of natural gas gathering and compression, crude oil gathering, and produced water gathering and disposal. The Processing and Storage segment includes the Tioga gas plant, equity investment in the Little Missouri (LM4) joint venture, and mentor storage terminal. The Terminaling and Export segment focuses on the Ramberg terminal facility, Tioga rail terminal, crude oil rail cars, and Johnson's corner header system. The company was founded in 2014 and is headquartered in Houston, TX. |
| Insider Trading |
Relationship |
Date |
Transaction |
Cost |
#Shares |
Value ($) |
#Shares Total |
SEC Form 4 |
| Gatling John A. | President and COO | Mar 13 '24 | Sale | 35.78 | 2,231 | 79,825 | 56,732 | Mar 13 04:40 PM | | NIEMIEC DAVID W | Director | Mar 08 '24 | Option Exercise | 0.00 | 2,299 | 0 | 47,060 | Mar 12 06:15 PM | | REDDY J PATRICK | Director | Mar 08 '24 | Option Exercise | 0.00 | 2,299 | 0 | 20,970 | Mar 12 06:14 PM | | Letwin Stephen J J | Director | Mar 08 '24 | Option Exercise | 0.00 | 2,299 | 0 | 28,956 | Mar 12 06:16 PM | | Gatling John A. | President and COO | Mar 08 '24 | Option Exercise | 0.00 | 9,154 | 0 | 58,963 | Mar 12 06:15 PM |
|
|
|
 |
| Market Cap | 650.02M | EPS (ttm) | 1.75 |
| P/E | 10.62 | EPS this Y | -2.67% |
| Forward P/E | 9.77 | EPS next Y | 11.94% |
| PEG | 1.52 | EPS past 5Y | 3.24% |
| P/S | 2.14 | EPS next 5Y | 7.00% |
| P/B | 0.76 | EPS Q/Q | -72.03% |
| Dividend | 4.89% | Sales Q/Q | -5.18% |
| Insider Own | 1.91% | Inst Own | 78.67% |
| Insider Trans | 0.11% | Inst Trans | 0.66% |
| Short Float | 1.47% | Earnings | Apr 25/b |
| Analyst Recom | 2.33 | Target Price | 22.20 |
| Avg Volume | 190.62K | 52W Range | 14.85 - 22.55 |
|
|
|
|
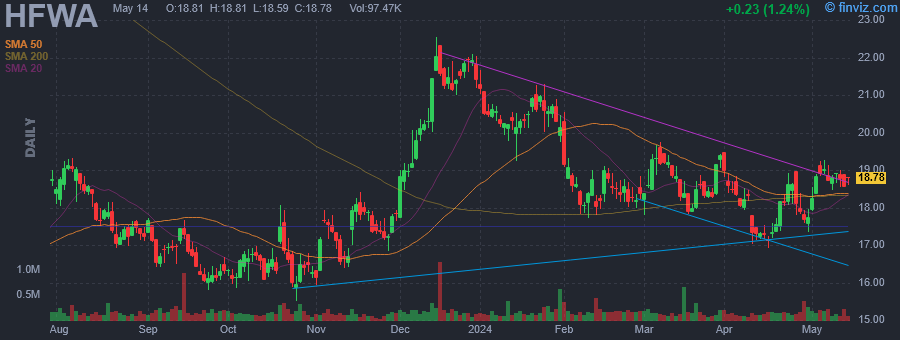
Heritage Financial Corp. is a bank holding company, which engages in the business of planning, directing, and coordinating the business activities of wholly owned subsidiary, Heritage Bank. It operates through the following loan portfolio segments: Commercial Business, Residential Real Estate, Real Estate Construction and Land Development, and Consumer. The Commercial Business segment focuses on the identified cash flows of the borrower and secondarily on the underlying collateral provided by the borrower. The Residential Real Estate segment includes secured by one-to-four family residences located in its primary market areas. The Real Estate Construction and Land Development segment offers construction loans for residential and for commercial and multifamily properties. The Consumer segment provides consumer loans and lines of credit that are both secured and unsecured. The company was founded on August 28, 1997 and is headquartered in Olympia, WA. |
| Insider Trading |
Relationship |
Date |
Transaction |
Cost |
#Shares |
Value ($) |
#Shares Total |
SEC Form 4 |
| Deuel Jeffrey J | CEO | Mar 15 '24 | Option Exercise | 18.38 | 9,682 | 177,955 | 69,615 | Mar 18 04:41 PM | | McDonald Bryan | President and COO | Mar 15 '24 | Option Exercise | 18.38 | 3,950 | 72,601 | 26,705 | Mar 18 04:43 PM | | Henning Thomas J | EVP Chief Risk Officer | Mar 15 '24 | Option Exercise | 18.38 | 3,537 | 65,010 | 10,519 | Mar 18 04:41 PM | | Curran Amy E. | EVP Director Commercial Lend | Mar 15 '24 | Option Exercise | 18.38 | 3,469 | 63,760 | 20,402 | Mar 18 04:42 PM | | Glasby William | EVP Chief Information Officer | Mar 15 '24 | Option Exercise | 18.38 | 3,385 | 62,216 | 10,051 | Mar 18 04:41 PM |
|
|
| |
 |
| Market Cap | 5.39B | EPS (ttm) | 4.82 |
| P/E | 8.18 | EPS this Y | -13.46% |
| Forward P/E | 8.40 | EPS next Y | 11.40% |
| PEG | 1.64 | EPS past 5Y | 8.82% |
| P/S | 0.92 | EPS next 5Y | 5.00% |
| P/B | 1.65 | EPS Q/Q | -35.11% |
| Dividend | 1.73% | Sales Q/Q | -7.80% |
| Insider Own | 0.68% | Inst Own | 89.35% |
| Insider Trans | 0.00% | Inst Trans | -4.24% |
| Short Float | 5.07% | Earnings | Apr 25/b |
| Analyst Recom | 2.12 | Target Price | 46.01 |
| Avg Volume | 1.78M | 52W Range | 25.43 - 44.16 |
|
|
|
|
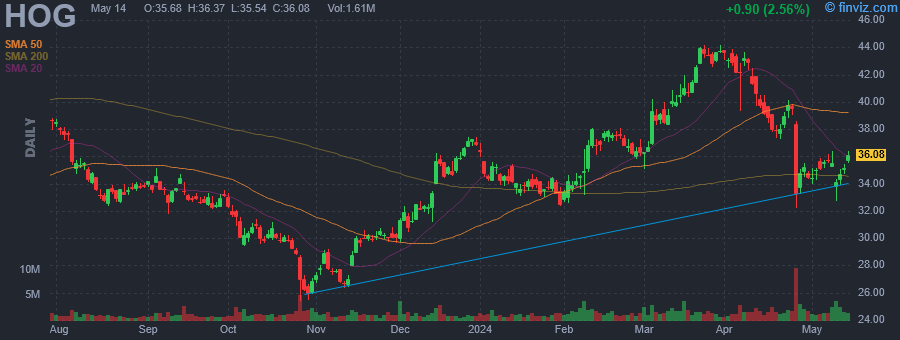
Harley-Davidson, Inc. is engaged in the manufacture and sale of custom, cruiser, and touring motorcycles. It operates through the following segments: Motorcycles & Related Products and Financial Services. The Motorcycles & Related Products segment manufactures, designs, and sells at wholesale on-road Harley-Davidson motorcycles as well as motorcycle parts, accessories, general merchandise, and related services. The Financial Services segment consists of financing and servicing wholesale inventory receivables and retail consumer loans, primarily for the purchase of Harley-Davidson motorcycles. The company was founded by William Sylvester Harley, Arthur Davidson, Walter C. Davidson, Sr. and William A. Davidson in 1903 and is headquartered in Milwaukee, WI. |
| Insider Trading |
Relationship |
Date |
Transaction |
Cost |
#Shares |
Value ($) |
#Shares Total |
SEC Form 4 |
| O'Sullivan Coyne Edel M. | Chief Commercial Officer | Feb 09 '24 | Option Exercise | 0.00 | 3,343 | 0 | 10,040 | Feb 12 12:48 PM | | ZEITZ JOCHEN | President and CEO | Feb 09 '24 | Option Exercise | 0.00 | 51,078 | 0 | 635,128 | Feb 12 12:46 PM | | KORNETZKE MARK R | Chief Accounting Officer | Feb 09 '24 | Option Exercise | 0.00 | 2,350 | 0 | 5,418 | Feb 12 12:49 PM | | Krishnan Jagdish | Chief Digital Officer | Feb 09 '24 | Option Exercise | 0.00 | 3,997 | 0 | 18,076 | Feb 12 12:50 PM | | Krause Paul J | VP, Chief Legal Officer | Feb 09 '24 | Option Exercise | 0.00 | 3,251 | 0 | 19,561 | Feb 12 12:52 PM |
|
|
|
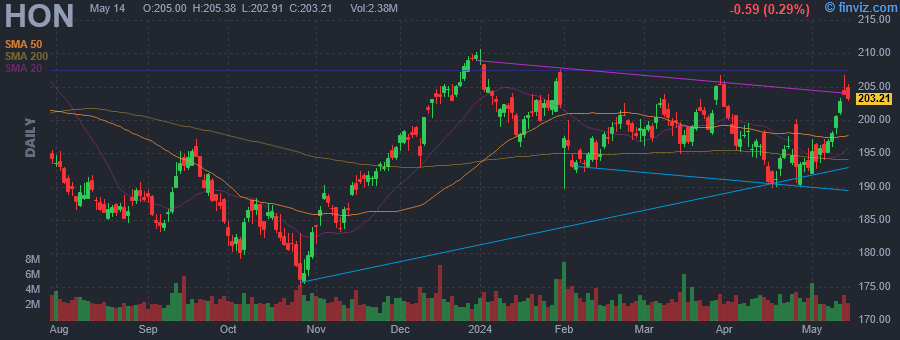 |
| Market Cap | 127.04B | EPS (ttm) | 8.47 |
| P/E | 22.99 | EPS this Y | 8.59% |
| Forward P/E | 17.89 | EPS next Y | 9.47% |
| PEG | 2.72 | EPS past 5Y | -1.17% |
| P/S | 3.47 | EPS next 5Y | 8.45% |
| P/B | 8.01 | EPS Q/Q | 26.87% |
| Dividend | 2.28% | Sales Q/Q | 2.76% |
| Insider Own | 0.10% | Inst Own | 77.91% |
| Insider Trans | -12.30% | Inst Trans | 0.09% |
| Short Float | 1.06% | Earnings | Apr 25/b |
| Analyst Recom | 2.15 | Target Price | 221.23 |
| Avg Volume | 3.03M | 52W Range | 174.88 - 210.87 |
|
|
|
|
Honeywell International, Inc. is a software industrial company, which offers industry specific solutions to aerospace and automotive products and services. It operates through the following segments: Aerospace, Honeywell Building Technologies, Performance Materials and Technologies, Safety and Productivity Solutions, and Corporate and All Other. The company was founded by Albert M. Butz in 1906 and is headquartered in Charlotte, NC. |
| Insider Trading |
Relationship |
Date |
Transaction |
Cost |
#Shares |
Value ($) |
#Shares Total |
SEC Form 4 |
| Watson Robin | Director | Apr 15 '24 | Option Exercise | 195.84 | 335 | 65,606 | 573 | Apr 17 02:44 PM | | Lieblein Grace | Director | Apr 15 '24 | Option Exercise | 195.84 | 335 | 65,606 | 10,955 | Apr 17 02:48 PM | | DAVIS D SCOTT | Director | Apr 15 '24 | Option Exercise | 195.84 | 335 | 65,606 | 28,705 | Apr 17 02:50 PM | | Lee Rose | Director | Apr 15 '24 | Option Exercise | 195.84 | 335 | 65,606 | 792 | Apr 17 02:52 PM | | AYER WILLIAM S | Director | Apr 15 '24 | Option Exercise | 195.84 | 335 | 65,606 | 8,679 | Apr 17 02:54 PM |
|
|
|
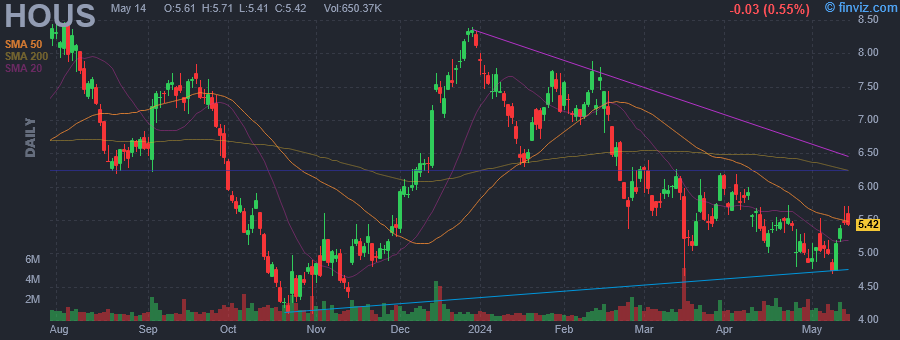 |
| Market Cap | 600.94M | EPS (ttm) | -0.90 |
| P/E | - | EPS this Y | 105.32% |
| Forward P/E | 8.53 | EPS next Y | 1255.60% |
| PEG | - | EPS past 5Y | - |
| P/S | 0.11 | EPS next 5Y | -1.20% |
| P/B | 0.36 | EPS Q/Q | 76.59% |
| Dividend | - | Sales Q/Q | -5.52% |
| Insider Own | 5.28% | Inst Own | 99.89% |
| Insider Trans | 0.66% | Inst Trans | -3.25% |
| Short Float | 9.04% | Earnings | Apr 25/b |
| Analyst Recom | 3.80 | Target Price | 6.50 |
| Avg Volume | 1.21M | 52W Range | 4.09 - 9.43 |
|
|
|
|
Anywhere Real Estate, Inc. engages in the provision of residential real estate services. It operates through the following segments: Anywhere Brands (Franchise Group), Anywhere Advisors (Owned Brokerage Group), Anywhere Integrated Services (Title Group), and Corporate and Other. The Franchise Group segment includes Better Homes and Gardens Real Estate, Century 21, Coldwell Banker, Coldwell Banker Commercial, Corcoran, ERA, and Sotheby's International Realty brands. The Owned Brokerage Group segment operates a full-service real estate brokerage business under the Coldwell Banker, Corcoran, and Sotheby's International Realty brand names. The Title Group segment provides full-service title, escrow, and settlement services to consumers, real estate companies, corporations, and financial institutions. The company was founded on December 14, 2006 and is headquartered in Madison, NJ. |
| Insider Trading |
Relationship |
Date |
Transaction |
Cost |
#Shares |
Value ($) |
#Shares Total |
SEC Form 4 |
| Williams Felicia | Director | Mar 08 '24 | Buy | 5.93 | 8,424 | 49,996 | 60,055 | Mar 11 04:14 PM | | Silva Enrique | Director | Nov 03 '23 | Buy | 5.42 | 15,000 | 81,255 | 112,216 | Nov 06 04:50 PM | | WILLIAMS MICHAEL J | Director | Nov 03 '23 | Buy | 5.26 | 15,000 | 78,870 | 199,286 | Nov 06 04:47 PM |
|
|
|
