 |
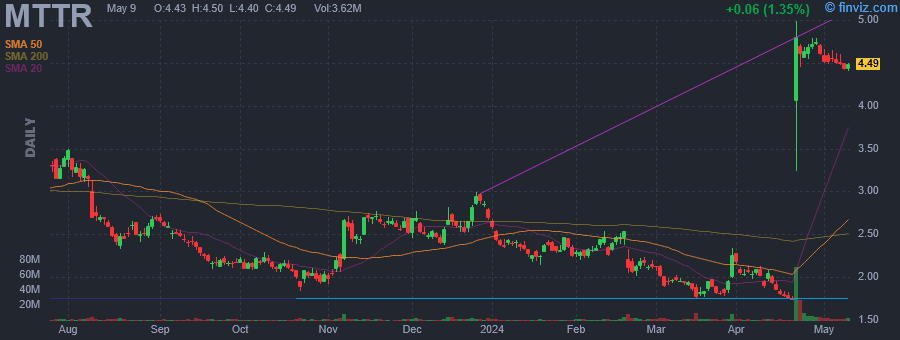
| Market Cap | 1.49B | EPS (ttm) | -0.66 |
| P/E | - | EPS this Y | 61.50% |
| Forward P/E | - | EPS next Y | 68.74% |
| PEG | - | EPS past 5Y | - |
| P/S | 9.46 | EPS next 5Y | - |
| P/B | 2.81 | EPS Q/Q | 31.62% |
| Dividend | - | Sales Q/Q | -3.88% |
| Insider Own | 14.61% | Inst Own | 32.54% |
| Insider Trans | -2.61% | Inst Trans | -9.39% |
| Short Float | 3.36% | Earnings | May 06/a |
| Analyst Recom | 2.75 | Target Price | 5.17 |
| Avg Volume | 3.75M | 52W Range | 1.73 - 4.99 |
|
|
|
|
Matterport, Inc. operates as a spatial data company that focuses on digitizing and indexing the built world. The firm's products include 3D content platform, pro2 3D camera, 360 cameras, virtual reality and mobile apps. It serves the residential real estate, engineering and construction, travel and hospitality, and commercial real estate sectors. The company was founded in 2011 and is headquartered in Sunnyvale, CA. |
| Insider Trading |
Relationship |
Date |
Transaction |
Cost |
#Shares |
Value ($) |
#Shares Total |
SEC Form 4 |
| Fay James Daniel | Chief Financial Officer | Apr 15 '24 | Option Exercise | 0.00 | 217,564 | 0 | 1,532,482 | Apr 16 11:42 AM | | Remley Jay | Chief Revenue Officer | Apr 15 '24 | Option Exercise | 0.00 | 130,538 | 0 | 1,168,654 | Apr 16 11:44 AM | | Tulsi Japjit | Chief Technology Officer | Apr 15 '24 | Option Exercise | 0.00 | 108,782 | 0 | 465,107 | Apr 16 11:47 AM | | PITTMAN RAYMOND J | Chief Executive Officer | Apr 15 '24 | Option Exercise | 0.00 | 466,952 | 0 | 3,696,483 | Apr 16 11:54 AM | | Fay James Daniel | Chief Financial Officer | Apr 01 '24 | Sale | 2.25 | 25,000 | 56,265 | 1,314,918 | Apr 02 03:13 PM |
|
|
 |
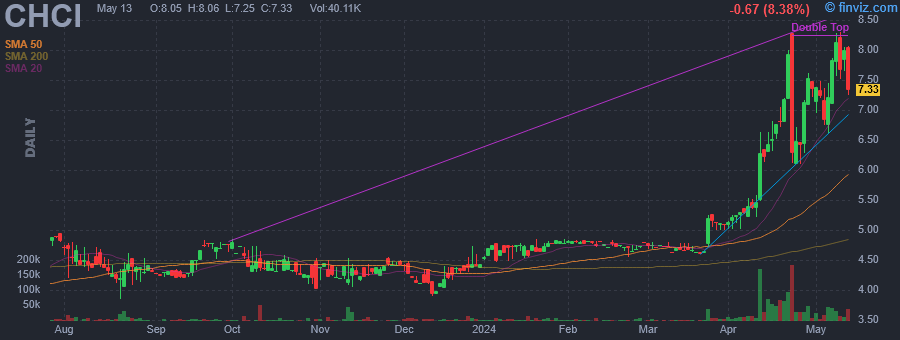 |
| Market Cap | 77.89M | EPS (ttm) | 0.77 |
| P/E | 10.33 | EPS this Y | - |
| Forward P/E | - | EPS next Y | - |
| PEG | 1.03 | EPS past 5Y | - |
| P/S | 1.74 | EPS next 5Y | 10.00% |
| P/B | 2.06 | EPS Q/Q | 41.57% |
| Dividend | - | Sales Q/Q | 18.43% |
| Insider Own | 69.03% | Inst Own | 6.34% |
| Insider Trans | 0.00% | Inst Trans | -2.09% |
| Short Float | 0.14% | Earnings | - |
| Analyst Recom | - | Target Price | - |
| Avg Volume | 14.89K | 52W Range | 3.47 - 8.00 |
|
|
|
|
Comstock Holding Cos., Inc. engages in the development of real estate properties and provision of asset management services. It operates through the following segments: Asset Management and Real Estate Services. The Asset Management segment management provides services to real estate assets and businesses that include commercial real estate uses, including apartments, hotels, office buildings, commercial garages, leased lands, retail stores, mixed-use developments, and urban transit-oriented development. The Real Estate Services segment provides real estate services in the areas of strategic corporate planning, capital markets, brokerage services, and environmental and design-based services. Its environmental services group provides consulting and engineering services, environmental studies, remediation services and provides site specific solutions for any project that may have an environmental impact, from environmental due diligence to site-specific assessments and remediation. The company was founded by Christopher Clemente in 1985 and is headquartered in Reston, VA. |
|
|
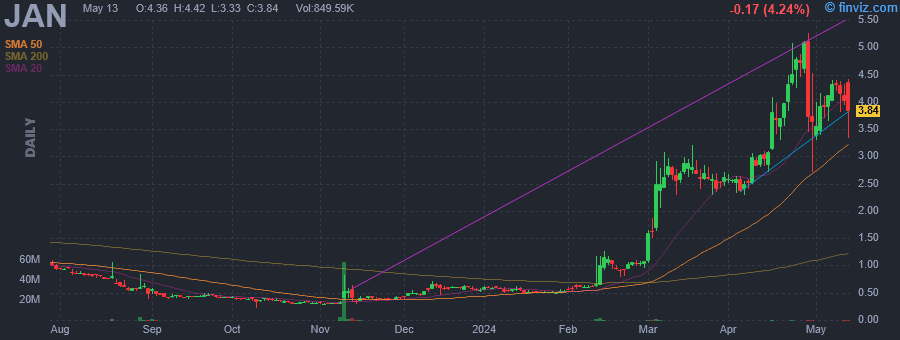 |
| Market Cap | 37.19M | EPS (ttm) | -4.67 |
| P/E | - | EPS this Y | - |
| Forward P/E | - | EPS next Y | - |
| PEG | - | EPS past 5Y | 23.21% |
| P/S | - | EPS next 5Y | - |
| P/B | - | EPS Q/Q | -9.46% |
| Dividend | - | Sales Q/Q | -100.00% |
| Insider Own | 11.05% | Inst Own | 3.61% |
| Insider Trans | 0.00% | Inst Trans | -7.88% |
| Short Float | 3.28% | Earnings | - |
| Analyst Recom | - | Target Price | - |
| Avg Volume | 302.90K | 52W Range | 0.22 - 4.50 |
|
|
|
|
JanOne, Inc. is a clinical-stage biopharmaceutical company, which engages in identifying, acquiring, licensing, developing, partnering, and commercializing novel, non-opioid, and non-addictive therapies to address the large unmet medical need for the treatment of pain and addiction. It operates under the Biotechnology and Recycling segments. The Biotechnology segment focuses on finding treatments for conditions that cause severe pain and bringing to market drugs with non-addictive pain-relieving properties. The Recycling segment is involved in a turnkey appliance recycling program. The company was founded by Edward R. Cameron in 1976 and is headquartered in Las Vegas, NV. |
|
| |
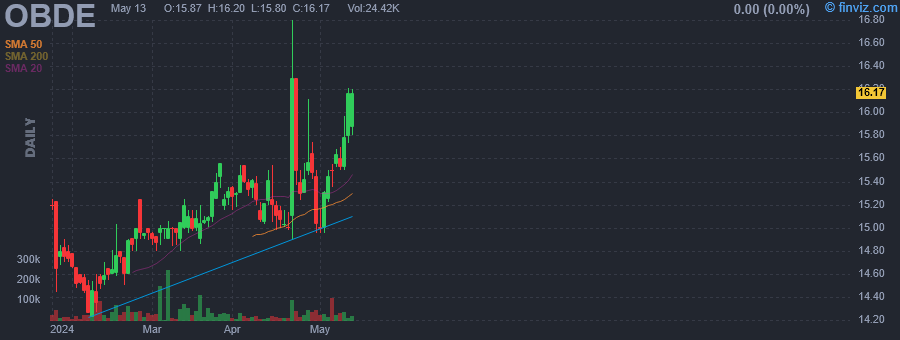 |
| Market Cap | 2.01B | EPS (ttm) | 2.44 |
| P/E | 6.68 | EPS this Y | -29.32% |
| Forward P/E | 9.73 | EPS next Y | -2.81% |
| PEG | - | EPS past 5Y | - |
| P/S | 4.88 | EPS next 5Y | - |
| P/B | 1.05 | EPS Q/Q | 29.41% |
| Dividend | 8.59% | Sales Q/Q | 23.42% |
| Insider Own | - | Inst Own | 29.37% |
| Insider Trans | - | Inst Trans | - |
| Short Float | - | Earnings | - |
| Analyst Recom | 1.00 | Target Price | 16.00 |
| Avg Volume | 42.53K | 52W Range | 14.23 - 16.80 |
|
|
|
|
Blue Owl Capital Corp III engages in the investments in middle-market companies located in the United States with a revenue of USD 50-2,500 million and an EBITDA of USD 10-250 million. It provides operating in the fields of on technology companies. It focuses on senior secured, subordinated, or mezzanine loans and equity-related instruments with an investment size ranging from USD 20 - 250 million. It acts as a lead investor. |
|
|
 |
| Market Cap | 131.38M | EPS (ttm) | 0.97 |
| P/E | 3.66 | EPS this Y | 212.82% |
| Forward P/E | 2.93 | EPS next Y | 0.00% |
| PEG | 3.66 | EPS past 5Y | - |
| P/S | 0.82 | EPS next 5Y | 1.00% |
| P/B | 0.67 | EPS Q/Q | -9.95% |
| Dividend | 2.80% | Sales Q/Q | 5.38% |
| Insider Own | 52.26% | Inst Own | 23.03% |
| Insider Trans | 0.00% | Inst Trans | -1.69% |
| Short Float | 0.04% | Earnings | Mar 28/b |
| Analyst Recom | 1.00 | Target Price | 4.00 |
| Avg Volume | 35.30K | 52W Range | 2.27 - 3.57 |
|
|
|
|
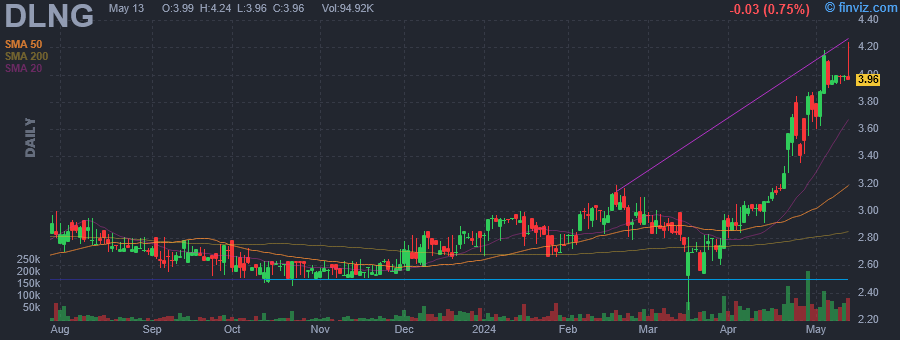
Dynagas LNG Partners LP engages in the provision of seaborne transportation services. It owns and operates liquefied natural gas carriers, which are employed to energy companies under multi-year charters. The company was founded on May 30, 2013 and is headquartered in Athens, Greece. |
|
| |
 |
| Market Cap | 3.70B | EPS (ttm) | 6.19 |
| P/E | 5.02 | EPS this Y | 190.50% |
| Forward P/E | 5.58 | EPS next Y | 12.89% |
| PEG | - | EPS past 5Y | 16.66% |
| P/S | 0.22 | EPS next 5Y | - |
| P/B | 1.83 | EPS Q/Q | 141.93% |
| Dividend | 5.40% | Sales Q/Q | 144.66% |
| Insider Own | 0.03% | Inst Own | 8.70% |
| Insider Trans | 0.00% | Inst Trans | 5.06% |
| Short Float | 2.52% | Earnings | Mar 04/b |
| Analyst Recom | 3.25 | Target Price | 41.24 |
| Avg Volume | 1.04M | 52W Range | 9.91 - 31.22 |
|
|
|
|
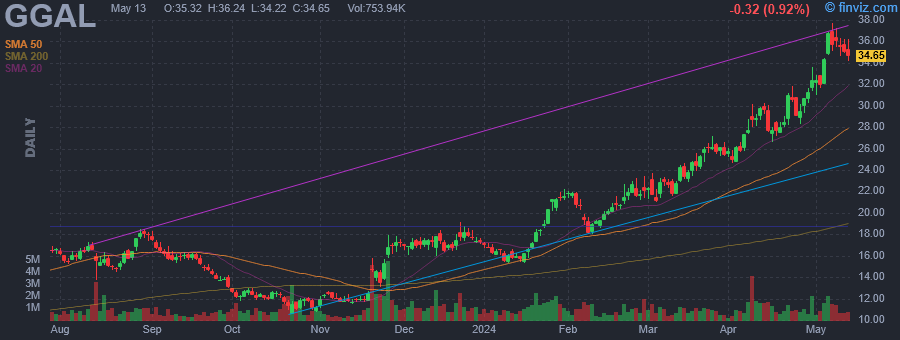
Grupo Financiero Galicia SA is a holding company, which engages in banking, insurance, and the issuance of certificates of deposit through its subsidiaries. It operates through the following segments: Banks, Ecosistema Naranja X, Insurance, Other Businesses, and Adjustments. The Banks segment includes the banking business operation results. The Ecosistema Naranja X segment represents the brand credit cards, consumer finance, and digital banking services business. The Insurance segment consists of insurance firms business and Sudamericana Holding SA. The Other Businesses segment refers to equity investments. The Adjustments segment relates to consolidation adjustments and eliminations of transactions among subsidiaries. The company was founded on September 14, 1999 and is headquartered in Buenos Aires, Argentina. |
|
|
 |
| Market Cap | 25.78M | EPS (ttm) | 1.16 |
| P/E | 5.56 | EPS this Y | - |
| Forward P/E | - | EPS next Y | - |
| PEG | - | EPS past 5Y | -2.04% |
| P/S | 0.11 | EPS next 5Y | - |
| P/B | 1.34 | EPS Q/Q | -91.92% |
| Dividend | - | Sales Q/Q | 7.49% |
| Insider Own | 24.22% | Inst Own | 4.42% |
| Insider Trans | 0.00% | Inst Trans | -49.57% |
| Short Float | 0.63% | Earnings | - |
| Analyst Recom | 1.00 | Target Price | 91.00 |
| Avg Volume | 106.24K | 52W Range | 2.16 - 6.45 |
|
|
|
|
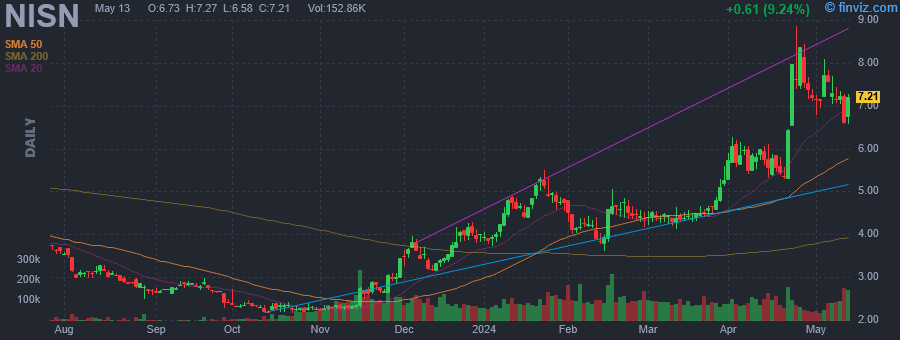
Nisun International Enterprise Development Group Co., Ltd. engages in the development, manufacture, and provision of customized installation of valves and pipe fitting. Its products are used for pharmaceutical, biological, food and beverage, and other clean industries. The firm also offers steel fittings, sanitary pump, and filter. The company was founded on May 29, 2012 and is headquartered in Shanghai, China. |
|
| |
 |
| Market Cap | 3.15B | EPS (ttm) | 3.13 |
| P/E | 15.65 | EPS this Y | 15.64% |
| Forward P/E | 8.08 | EPS next Y | 16.10% |
| PEG | 0.72 | EPS past 5Y | 28.17% |
| P/S | 3.75 | EPS next 5Y | 21.80% |
| P/B | 2.99 | EPS Q/Q | 11.53% |
| Dividend | 2.77% | Sales Q/Q | 2.98% |
| Insider Own | 32.82% | Inst Own | 52.01% |
| Insider Trans | 0.00% | Inst Trans | 1.01% |
| Short Float | 3.79% | Earnings | May 09/a |
| Analyst Recom | 2.11 | Target Price | 49.38 |
| Avg Volume | 376.88K | 52W Range | 27.73 - 49.16 |
|
|
|
|
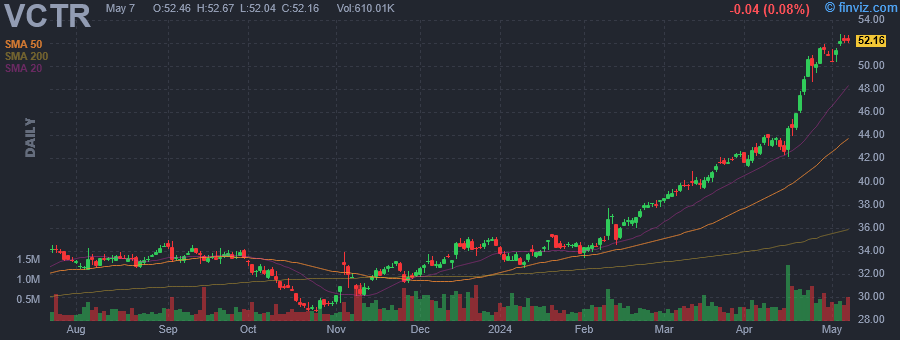
Victory Capital Holdings, Inc. engages in the provision of investment management products and services to institutional and intermediary clients. The company sells and distributes its products through centralized distribution model, broker-dealers, retirement platforms, and registered investment advisor networks. Its model features an operating platform that provides centralized distribution, marketing, and operations infrastructure to its franchises and solutions platform. The company was founded on February 13, 2013 and is headquartered in San Antonio, TX. |
| Insider Trading |
Relationship |
Date |
Transaction |
Cost |
#Shares |
Value ($) |
#Shares Total |
SEC Form 4 |
| Brown David Craig | Chairman and CEO | Jul 18 '23 | Sale | 33.98 | 127,496 | 4,332,314 | 1,927,038 | Jul 19 05:39 PM | | Brown David Craig | Chairman and CEO | Jul 17 '23 | Sale | 33.55 | 20,757 | 696,397 | 2,054,534 | Jul 19 05:39 PM | | Brown David Craig | Chairman and CEO | Jul 14 '23 | Sale | 33.66 | 68,146 | 2,293,794 | 2,075,291 | Jul 14 05:36 PM | | Brown David Craig | Chairman and CEO | Jul 13 '23 | Sale | 33.58 | 75,690 | 2,541,670 | 2,143,437 | Jul 14 05:36 PM | | Brown David Craig | Chairman and CEO | Jul 12 '23 | Sale | 33.63 | 57,911 | 1,947,547 | 2,219,127 | Jul 14 05:36 PM |
|
|
|
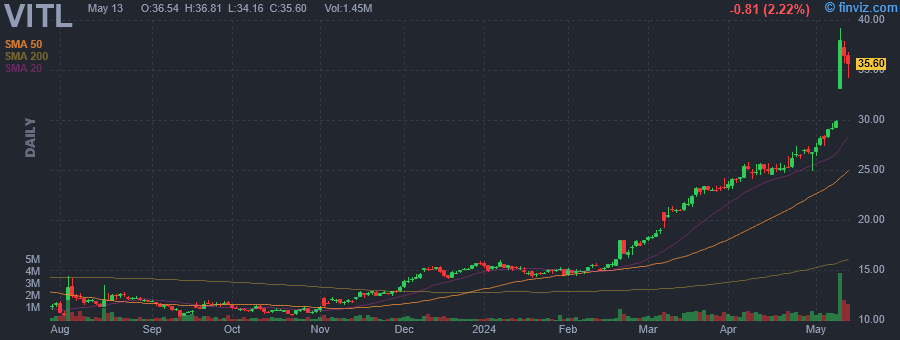 |
| Market Cap | 1.06B | EPS (ttm) | 0.59 |
| P/E | 42.93 | EPS this Y | 21.30% |
| Forward P/E | 27.68 | EPS next Y | 27.90% |
| PEG | - | EPS past 5Y | 31.87% |
| P/S | 2.24 | EPS next 5Y | - |
| P/B | 5.48 | EPS Q/Q | 286.74% |
| Dividend | - | Sales Q/Q | 23.37% |
| Insider Own | 35.26% | Inst Own | 61.57% |
| Insider Trans | -35.32% | Inst Trans | 1.18% |
| Short Float | 5.79% | Earnings | Mar 07/b |
| Analyst Recom | 1.67 | Target Price | 23.14 |
| Avg Volume | 443.77K | 52W Range | 10.00 - 26.43 |
|
|
|
|
Vital Farms, Inc. packages, markets and distributes pasture-raised shell eggs, pasture-raised butter and other products. Its products are sold under the trade names Vital Farms, Alfresco Farms, Lucky Ladies and RedHill Farms, primarily to retail foodservice channels. The company was founded by Catherine Stewart, Matthew O'Hayer and Jason Jones in 2007 and is headquartered in Austin, TX. |
| Insider Trading |
Relationship |
Date |
Transaction |
Cost |
#Shares |
Value ($) |
#Shares Total |
SEC Form 4 |
| Diez-Canseco Russell | PRESIDENT AND CEO | Apr 12 '24 | Option Exercise | 2.57 | 92,523 | 237,426 | 405,701 | Apr 16 04:30 PM | | Diez-Canseco Russell | PRESIDENT AND CEO | Apr 12 '24 | Sale | 25.07 | 36,948 | 926,286 | 368,753 | Apr 16 04:30 PM | | Diez-Canseco Russell | PRESIDENT AND CEO | Apr 05 '24 | Option Exercise | 5.33 | 30,000 | 159,858 | 343,178 | Apr 09 04:30 PM | | OHAYER MATTHEW | EXECUTIVE CHAIRPERSON | Apr 05 '24 | Sale | 25.26 | 7,462,777 | 188,509,747 | 7,462,777 | Apr 09 04:30 PM | | Diez-Canseco Russell | PRESIDENT AND CEO | Apr 05 '24 | Sale | 25.03 | 30,000 | 750,900 | 313,178 | Apr 09 04:30 PM |
|
|
|
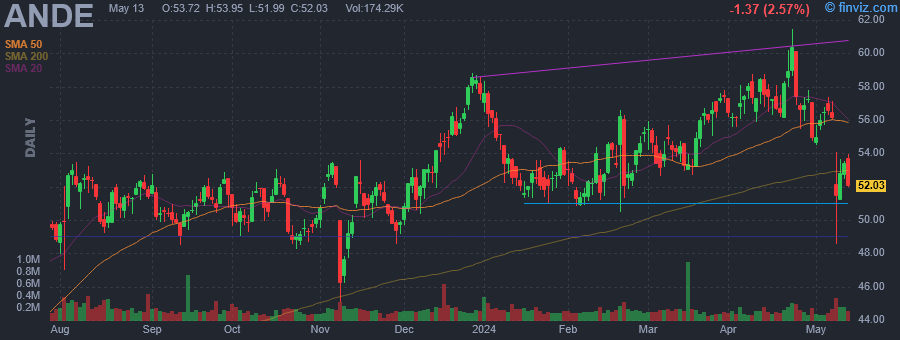 |
| Market Cap | 1.99B | EPS (ttm) | 2.95 |
| P/E | 20.01 | EPS this Y | 0.85% |
| Forward P/E | 15.17 | EPS next Y | 31.03% |
| PEG | 2.50 | EPS past 5Y | 15.08% |
| P/S | 0.14 | EPS next 5Y | 8.00% |
| P/B | 1.55 | EPS Q/Q | 473.08% |
| Dividend | 1.29% | Sales Q/Q | -31.31% |
| Insider Own | 5.25% | Inst Own | 89.41% |
| Insider Trans | -7.43% | Inst Trans | -0.96% |
| Short Float | 2.13% | Earnings | Feb 20/a |
| Analyst Recom | 1.00 | Target Price | 67.50 |
| Avg Volume | 173.80K | 52W Range | 35.69 - 60.18 |
|
|
|
|
The Andersons, Inc. is an agriculturally rooted diversified company, which engages in railcar leasing and repair, turf products production, and consumer retailing. It operates through the following segments: Trade, Renewables, and Plant Nutrient. The Trade segment includes commodity merchandising and the operation of terminal grain elevator facilities. The Renewables segment produces, purchases and sells ethanol and co-products. This segment also operates a merchandising and trade portfolio of ethanol, ethanol co-products and other biofuels such as renewable diesel. The Plant Nutrient segment manufactures and distributes agricultural inputs, primary nutrients and specialty fertilizers, to dealers and farmers, along with turf care and corncob-based products. The company was founded by Harold Anderson and Margaret Anderson in 1947 and is headquartered in Maumee, OH. |
| Insider Trading |
Relationship |
Date |
Transaction |
Cost |
#Shares |
Value ($) |
#Shares Total |
SEC Form 4 |
| Bowe Patrick E. | President & CEO | Mar 20 '24 | Sale | 55.69 | 769 | 42,826 | 88,546 | Mar 21 11:56 AM | | Bowe Patrick E. | President & CEO | Mar 19 '24 | Sale | 55.12 | 1,338 | 73,751 | 89,315 | Mar 21 11:56 AM | | Bowe Patrick E. | President & CEO | Mar 08 '24 | Sale | 55.22 | 2,623 | 144,842 | 90,653 | Mar 12 09:29 AM | | Bowe Patrick E. | President & CEO | Mar 05 '24 | Sale | 55.01 | 300 | 16,503 | 93,276 | Mar 07 01:00 PM | | McNeely Joseph E | Group President - ANI | Mar 01 '24 | Option Exercise | 0.00 | 2,794 | 0 | 53,192 | Mar 05 04:35 PM |
|
|
|
