 |
| Market Cap | 634.23M | EPS (ttm) | 0.59 |
| P/E | 19.42 | EPS this Y | 20.65% |
| Forward P/E | 9.66 | EPS next Y | 7.21% |
| PEG | 0.55 | EPS past 5Y | -3.85% |
| P/S | 0.58 | EPS next 5Y | 35.00% |
| P/B | 0.82 | EPS Q/Q | 79.03% |
| Dividend | - | Sales Q/Q | 13.49% |
| Insider Own | 9.54% | Inst Own | 112.39% |
| Insider Trans | -0.09% | Inst Trans | 1.49% |
| Short Float | 12.39% | Earnings | Jan 31/a |
| Analyst Recom | 1.00 | Target Price | 16.00 |
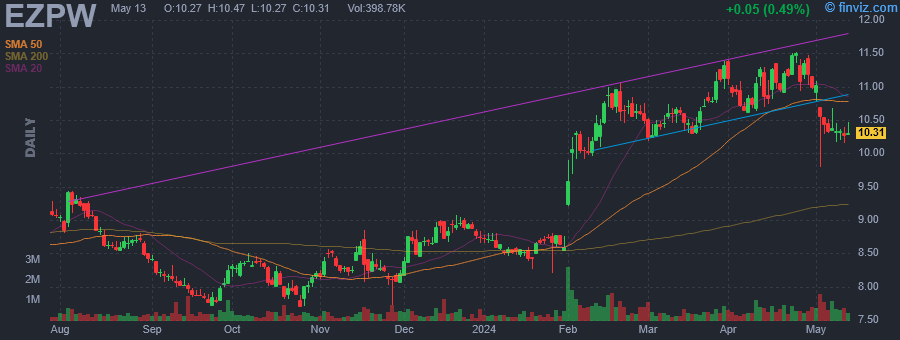
| Avg Volume | 604.37K | 52W Range | 7.70 - 11.50 |
|
|
|
|
EZCORP, Inc. engages in the provision of pawn services. It operates through the following geographical segments: U.S. Pawn, Latin America Pawn, and Other Investments. The U.S. Pawn segment includes all pawn activities in the United States. The Latin America Pawn segment refers to all pawn activities in Mexico and other parts of Latin America. The Other Investments segment consists primarily of the equity interest in the net income of cash converters along with investment in Founders and RDC. The company was founded in 1989 and is headquartered in Rollingwood, TX. |
| Insider Trading |
Relationship |
Date |
Transaction |
Cost |
#Shares |
Value ($) |
#Shares Total |
SEC Form 4 |
| Swies Nicole | Chief Revenue Officer | Apr 01 '24 | Sale | 11.38 | 2,250 | 25,605 | 71,458 | Apr 01 02:41 PM | | Swies Nicole | Chief Revenue Officer | Jan 02 '24 | Sale | 8.73 | 2,250 | 19,642 | 82,708 | Jan 04 09:49 AM | | Given Lachlan P | Chief Executive Officer | Nov 14 '23 | Option Exercise | 8.52 | 172,962 | 1,473,636 | 656,370 | Nov 16 02:51 PM | | Powell John Blair Jr. | Chief Operating Officer | Nov 14 '23 | Option Exercise | 8.52 | 86,482 | 736,827 | 174,497 | Nov 16 03:17 PM | | Swies Nicole | Chief Revenue Officer | Nov 14 '23 | Option Exercise | 8.52 | 85,327 | 726,986 | 118,534 | Nov 16 04:03 PM |
|
|
 |
 |
| Market Cap | 3.22B | EPS (ttm) | 3.13 |
| P/E | 16.00 | EPS this Y | 15.64% |
| Forward P/E | 8.26 | EPS next Y | 16.10% |
| PEG | 0.73 | EPS past 5Y | 28.17% |
| P/S | 3.83 | EPS next 5Y | 21.80% |
| P/B | 3.05 | EPS Q/Q | 11.53% |
| Dividend | 2.71% | Sales Q/Q | 2.98% |
| Insider Own | 32.82% | Inst Own | 52.04% |
| Insider Trans | 0.00% | Inst Trans | 1.01% |
| Short Float | 3.79% | Earnings | May 09/a |
| Analyst Recom | 2.11 | Target Price | 49.38 |
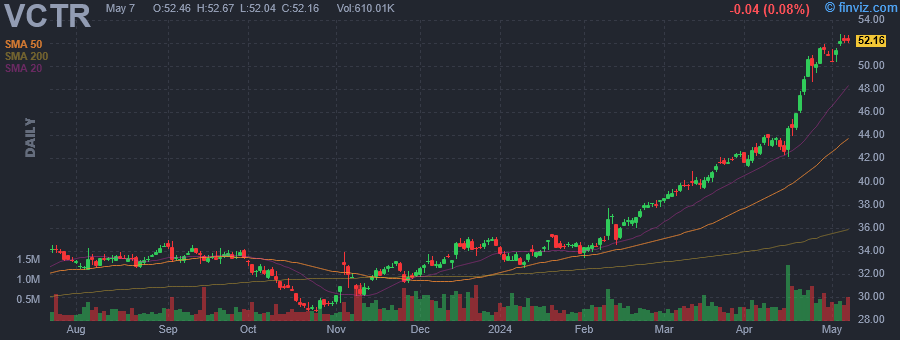
| Avg Volume | 384.69K | 52W Range | 27.73 - 50.89 |
|
|
|
|
Victory Capital Holdings, Inc. engages in the provision of investment management products and services to institutional and intermediary clients. The company sells and distributes its products through centralized distribution model, broker-dealers, retirement platforms, and registered investment advisor networks. Its model features an operating platform that provides centralized distribution, marketing, and operations infrastructure to its franchises and solutions platform. The company was founded on February 13, 2013 and is headquartered in San Antonio, TX. |
| Insider Trading |
Relationship |
Date |
Transaction |
Cost |
#Shares |
Value ($) |
#Shares Total |
SEC Form 4 |
| Brown David Craig | Chairman and CEO | Jul 18 '23 | Sale | 33.98 | 127,496 | 4,332,314 | 1,927,038 | Jul 19 05:39 PM | | Brown David Craig | Chairman and CEO | Jul 17 '23 | Sale | 33.55 | 20,757 | 696,397 | 2,054,534 | Jul 19 05:39 PM | | Brown David Craig | Chairman and CEO | Jul 14 '23 | Sale | 33.66 | 68,146 | 2,293,794 | 2,075,291 | Jul 14 05:36 PM | | Brown David Craig | Chairman and CEO | Jul 13 '23 | Sale | 33.58 | 75,690 | 2,541,670 | 2,143,437 | Jul 14 05:36 PM | | Brown David Craig | Chairman and CEO | Jul 12 '23 | Sale | 33.63 | 57,911 | 1,947,547 | 2,219,127 | Jul 14 05:36 PM |
|
|
|
 |
| Market Cap | 5.96B | EPS (ttm) | 4.80 |
| P/E | 27.49 | EPS this Y | 14.98% |
| Forward P/E | 16.19 | EPS next Y | 17.04% |
| PEG | 3.48 | EPS past 5Y | 7.05% |
| P/S | 1.89 | EPS next 5Y | 7.90% |
| P/B | 2.98 | EPS Q/Q | -10.98% |
| Dividend | 1.08% | Sales Q/Q | 13.72% |
| Insider Own | 15.30% | Inst Own | 81.07% |
| Insider Trans | -11.14% | Inst Trans | -2.42% |
| Short Float | 1.32% | Earnings | Apr 25/b |
| Analyst Recom | 2.00 | Target Price | 137.25 |
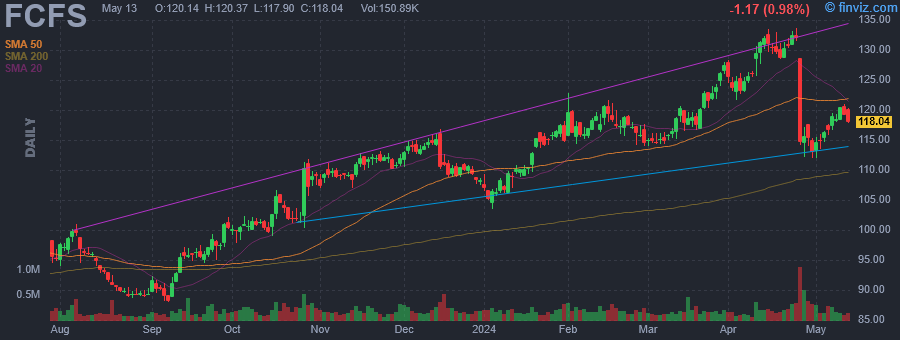
| Avg Volume | 203.11K | 52W Range | 88.05 - 133.46 |
|
|
|
|
FirstCash Holdings, Inc. operates retail pawn stores in the United States and Latin America. Its pawn stores lend money on the collateral of pledged personal property, including jewelry, electronics, tools, appliances, sporting goods, and musical instruments, and retails merchandise acquired through collateral forfeitures on forfeited pawn loans and over-the-counter purchases of merchandise directly from customers. The firm is also involved in melting scrap jewelry, as well as selling gold, silver, and diamonds in commodity markets. The company was founded in 1988 and is headquartered in Fort Worth, Texas. |
| Insider Trading |
Relationship |
Date |
Transaction |
Cost |
#Shares |
Value ($) |
#Shares Total |
SEC Form 4 |
| Rippel Douglas Richard | Director | Mar 15 '24 | Sale | 118.73 | 17,395 | 2,065,308 | 5,466,973 | Mar 15 05:49 PM | | Rippel Douglas Richard | Director | Mar 14 '24 | Sale | 117.59 | 18,393 | 2,162,833 | 5,484,368 | Mar 15 05:49 PM | | Rippel Douglas Richard | Director | Mar 13 '24 | Sale | 119.90 | 21,852 | 2,620,055 | 5,502,761 | Mar 15 05:49 PM | | Rippel Douglas Richard | Director | Mar 12 '24 | Sale | 117.73 | 16,722 | 1,968,681 | 5,524,613 | Mar 12 05:14 PM | | Rippel Douglas Richard | Director | Mar 11 '24 | Sale | 116.32 | 21,959 | 2,554,271 | 5,541,335 | Mar 12 05:14 PM |
|
|
| |
 |
| Market Cap | 26.18B | EPS (ttm) | 3.05 |
| P/E | 35.18 | EPS this Y | 8.77% |
| Forward P/E | 28.66 | EPS next Y | 8.64% |
| PEG | 3.63 | EPS past 5Y | 6.12% |
| P/S | 4.46 | EPS next 5Y | 9.70% |
| P/B | 6.77 | EPS Q/Q | 192.04% |
| Dividend | 1.06% | Sales Q/Q | 6.41% |
| Insider Own | 0.19% | Inst Own | 88.72% |
| Insider Trans | -63.77% | Inst Trans | -0.89% |
| Short Float | 2.81% | Earnings | May 02/b |
| Analyst Recom | 2.62 | Target Price | 105.02 |
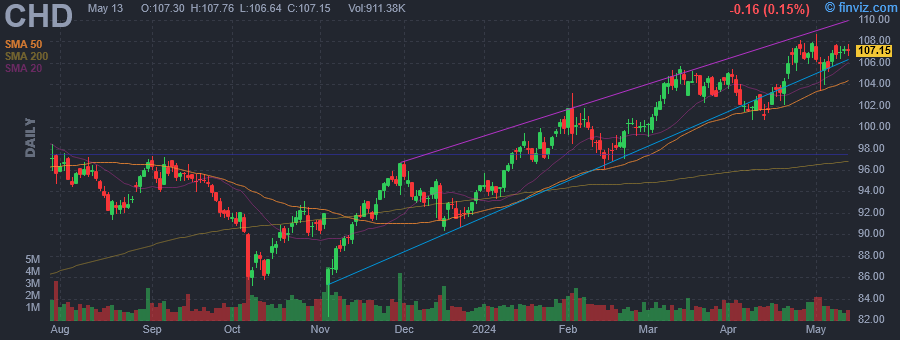
| Avg Volume | 1.29M | 52W Range | 82.25 - 107.42 |
|
|
|
|
Church & Dwight Co., Inc. engages in the development, manufacture, and marketing of household, personal care, and specialty products. It operates through the following segments: Consumer Domestic, Consumer International, Specialty Products, and Corporate. The Consumer Domestic segment offers household products, such as laundry detergents, fabric softener sheets, cat litter, and household cleaning products, and personal care products including antiperspirants, oral care products, depilatories, reproductive health products, oral analgesics, nasal saline moisturizers, and dietary supplements. The Consumer International segment sells personal care products, household and over-the-counter products in Canada, France, Australia, China, the United Kingdom, Mexico, and Brazil. The Specialty Products segment consists of sales to businesses which participated in different product areas, namely animal productivity, specialty chemicals, and specialty cleaners. The Corporate segment includes equity in earnings of affiliates from Armand and ArmaKleen in 2021, 2020 and 2019. The company was founded by Dwight John and Austin Church in 1846 and is headquartered in Ewing, NJ. |
| Insider Trading |
Relationship |
Date |
Transaction |
Cost |
#Shares |
Value ($) |
#Shares Total |
SEC Form 4 |
| Bruno Barry A. | EVP, Chf Mktng Offcr Pres CD | Mar 13 '24 | Option Exercise | 49.62 | 9,926 | 492,528 | 14,245 | Mar 14 09:24 AM | | Bruno Barry A. | EVP, Chf Mktng Offcr Pres CD | Mar 13 '24 | Sale | 104.55 | 9,926 | 1,037,805 | 4,319 | Mar 14 09:24 AM | | FARRELL MATTHEW | President and CEO | Mar 11 '24 | Option Exercise | 41.76 | 275,000 | 11,482,625 | 387,719 | Mar 12 11:30 AM | | IRWIN BRADLEY C | Director | Mar 11 '24 | Option Exercise | 53.75 | 5,590 | 300,462 | 42,759 | Mar 12 11:13 AM | | Read Michael | EVP, International | Mar 11 '24 | Option Exercise | 51.67 | 4,500 | 232,515 | 4,500 | Mar 12 11:00 AM |
|
|
|
 |
| Market Cap | 6.16B | EPS (ttm) | 2.03 |
| P/E | 7.77 | EPS this Y | -0.92% |
| Forward P/E | 8.88 | EPS next Y | -6.91% |
| PEG | - | EPS past 5Y | 31.00% |
| P/S | 4.03 | EPS next 5Y | - |
| P/B | 1.02 | EPS Q/Q | -0.82% |
| Dividend | 9.36% | Sales Q/Q | 17.25% |
| Insider Own | 7.65% | Inst Own | 42.71% |
| Insider Trans | 0.01% | Inst Trans | -4.42% |
| Short Float | 2.33% | Earnings | May 08/a |
| Analyst Recom | 1.58 | Target Price | 15.88 |
| Avg Volume | 2.03M | 52W Range | 11.95 - 15.83 |
|
|
|
|
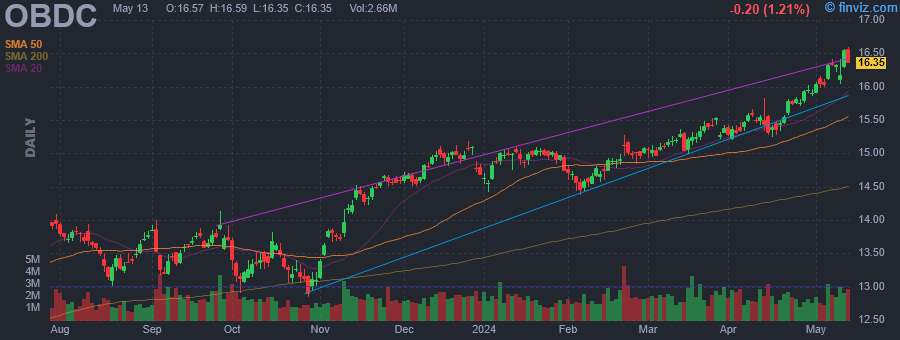
Blue Owl Capital Cor seeks investment opportunities in middle market companies located in the United States with an EBITDA of USD 10 - 250 million and annual revenue of USD 50 million - 2.5 billion. The fund focuses on broad range of sectors including business services, healthcare services, pharma & healthcare technology, aerospace & defense, software & technology and manufacturing & industrials. it provides financing in the form of senior secured or unsecured loans, subordinated loans or mezzanine loans and a lesser extent, equity-related securities and warrants for growth, acquisitions, market or product expansion, re-financings and recapitalizations with an investment size ranging from $20 to $250 million and it also acts as a lead investor. |
| Insider Trading |
Relationship |
Date |
Transaction |
Cost |
#Shares |
Value ($) |
#Shares Total |
SEC Form 4 |
| DAlelio Edward H | Director | Mar 05 '24 | Buy | 15.07 | 3,000 | 45,210 | 6,217 | Mar 07 05:37 PM | | Temple Chris | Director | May 26 '23 | Buy | 13.30 | 5,900 | 78,470 | 36,000 | May 31 04:30 PM | | Swatt Matthew | Co-Treasurer and Co-Controller | May 25 '23 | Buy | 13.15 | 65 | 855 | 2,379 | May 26 04:31 PM | | Kaye Eric A. | Director | May 23 '23 | Buy | 13.34 | 3,749 | 50,012 | 19,144 | May 24 04:31 PM | | Packer Craig | President and CEO | May 19 '23 | Buy | 13.23 | 75,600 | 1,000,188 | 300,716 | May 22 04:30 PM |
|
|
| |
 |
| Market Cap | 2.91B | EPS (ttm) | 1.82 |
| P/E | 9.39 | EPS this Y | 68.90% |
| Forward P/E | 9.65 | EPS next Y | -7.09% |
| PEG | 0.94 | EPS past 5Y | 2.50% |
| P/S | 4.61 | EPS next 5Y | 10.00% |
| P/B | 1.13 | EPS Q/Q | 198.40% |
| Dividend | 8.50% | Sales Q/Q | 20.40% |
| Insider Own | 2.71% | Inst Own | 45.20% |
| Insider Trans | 0.00% | Inst Trans | 1.67% |
| Short Float | 2.32% | Earnings | May 06/a |
| Analyst Recom | 1.80 | Target Price | 16.70 |
| Avg Volume | 871.28K | 52W Range | 12.62 - 17.27 |
|
|
|
|
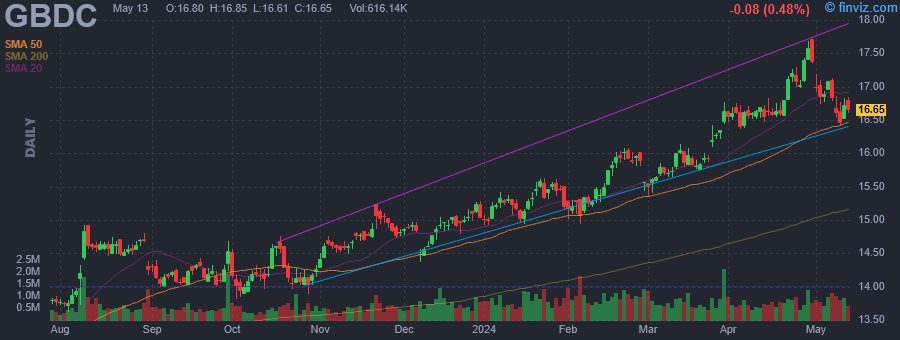
Golub Capital BDC, Inc. (GBDC) is a business development company and operates as an externally managed closed-end non-diversified management investment company. It invests in debt and minority equity investments in middle-market companies that are, in most cases, sponsored by private equity investors. It typically invests in diversified consumer services, automobiles, healthcare technology, insurance, health care equipment and supplies, hotels, restaurants and leisure, healthcare providers and services, IT services and specialty retails. It seeks to invest in the United States. It primarily invests in first lien traditional senior debt, first lien one stop, junior debt and equity, senior secured, one stop, unitranche, second lien, subordinated and mezzanine loans of middle-market companies, and warrants. |
| Insider Trading |
Relationship |
Date |
Transaction |
Cost |
#Shares |
Value ($) |
#Shares Total |
SEC Form 4 |
| Rival Anita J. | Director | May 25 '23 | Buy | 13.02 | 8,000 | 104,160 | 69,000 | May 30 04:16 PM |
|
|
|
 |
| Market Cap | 5.41B | EPS (ttm) | 8.77 |
| P/E | 13.93 | EPS this Y | -7.49% |
| Forward P/E | 9.06 | EPS next Y | 12.61% |
| PEG | - | EPS past 5Y | 10.17% |
| P/S | 0.46 | EPS next 5Y | - |
| P/B | 1.75 | EPS Q/Q | -34.13% |
| Dividend | 2.25% | Sales Q/Q | -2.10% |
| Insider Own | 2.91% | Inst Own | 88.43% |
| Insider Trans | -4.95% | Inst Trans | -4.78% |
| Short Float | 1.19% | Earnings | Apr 23/b |
| Analyst Recom | 2.50 | Target Price | 129.20 |
| Avg Volume | 279.68K | 52W Range | 76.15 - 122.81 |
|
|
|
|
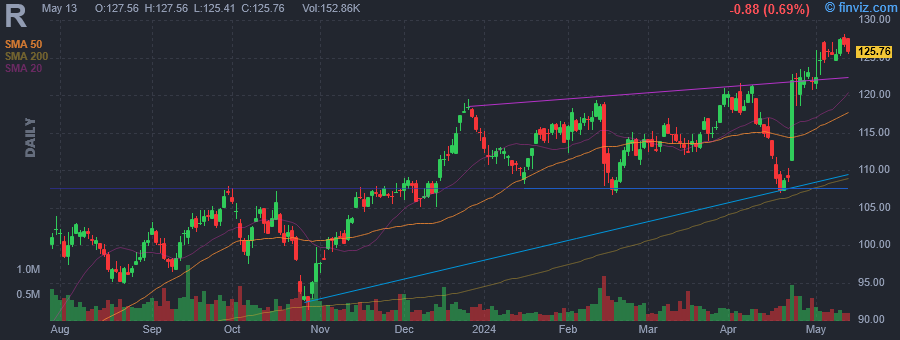
Ryder System, Inc. is a logistics and transportation company, which engages in providing supply chain, dedicated transportation, and fleet management solutions. It operates through the following business segments: Fleet Management Solutions (FMS), Supply Chain Solutions (SCS), and Dedicated Transportation Solutions (DTS). The FMS segment provides full-service leasing and leasing with flexible maintenance options, commercial rental and maintenance services of trucks, tractors, and trailers. The SCS segment provides integrated logistics solutions, including distribution management, dedicated transportation, transportation management, e-commerce and last mile, and professional services. The DTS segment provides turnkey transportation solutions, including dedicated vehicles, drivers, management, and administrative support. The company was founded by James A. Ryder in 1933 and is headquartered in Coral Gables, FL. |
| Insider Trading |
Relationship |
Date |
Transaction |
Cost |
#Shares |
Value ($) |
#Shares Total |
SEC Form 4 |
| JONES KAREN M. | EVP & Chief Marketing Officer | Feb 28 '24 | Option Exercise | 76.49 | 7,737 | 591,803 | 20,133 | Mar 01 04:54 PM | | JONES KAREN M. | EVP & Chief Marketing Officer | Feb 28 '24 | Sale | 113.48 | 7,737 | 877,995 | 12,396 | Mar 01 04:54 PM | | Martin Steve W. | EVP of DTS | Feb 26 '24 | Option Exercise | 93.51 | 2,590 | 242,191 | 35,373 | Feb 28 04:15 PM | | Ravindran Rajeev | EVP & CIO | Feb 26 '24 | Sale | 114.39 | 8,800 | 1,006,632 | 8,360 | Feb 28 04:08 PM | | Martin Steve W. | EVP of DTS | Feb 26 '24 | Sale | 113.95 | 2,590 | 295,130 | 32,783 | Feb 28 04:15 PM |
|
|
| |
 |
| Market Cap | 18.52M | EPS (ttm) | - |
| P/E | - | EPS this Y | - |
| Forward P/E | - | EPS next Y | - |
| PEG | - | EPS past 5Y | - |
| P/S | - | EPS next 5Y | - |
| P/B | - | EPS Q/Q | - |
| Dividend | - | Sales Q/Q | - |
| Insider Own | - | Inst Own | - |
| Insider Trans | - | Inst Trans | - |
| Short Float | - | Earnings | - |
| Analyst Recom | - | Target Price | - |
| Avg Volume | 342.15K | 52W Range | 10.07 - 10.14 |
|
|
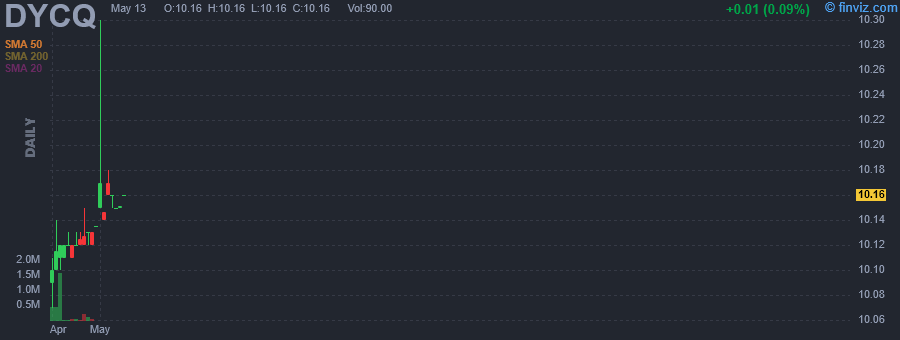
DT Cloud Acquisition Corp. operates as a blank check company. It was formed for the purpose of effecting a merger, share exchange, asset acquisition, share purchase, reorganization or similar business combination with one or more businesses. The company was founded on July 7, 2022 and is headquartered in London, the United Kingdom. |
|
|
 |
| Market Cap | 6.11B | EPS (ttm) | 3.65 |
| P/E | 8.73 | EPS this Y | 49.90% |
| Forward P/E | 9.49 | EPS next Y | -6.96% |
| PEG | - | EPS past 5Y | 190.80% |
| P/S | 5.34 | EPS next 5Y | - |
| P/B | 1.15 | EPS Q/Q | 15.70% |
| Dividend | 9.45% | Sales Q/Q | 21.30% |
| Insider Own | 0.10% | Inst Own | 39.80% |
| Insider Trans | 0.00% | Inst Trans | 21.85% |
| Short Float | 0.99% | Earnings | May 08/b |
| Analyst Recom | 1.90 | Target Price | 31.18 |
| Avg Volume | 893.60K | 52W Range | 24.83 - 31.99 |
|
|
|
|
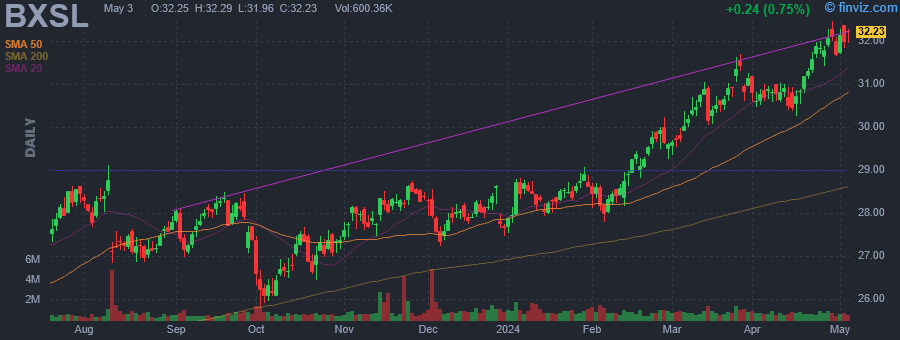
Blackstone Secured Lending Fund is business development company and a Delaware statutory trust formed on March 26, 2018, and structured as an externally managed, non-diversified closed-end investment Fund. On October 26, 2018, the fund elected to be regulated as a business development company (BDC) under the Investment Company Act of 1940, as amended (the 1940 Act). In addition, the Fund elected to be treated for U.S. federal income tax purposes, as a regulated investment company (RIC), as defined under Subchapter M of the Internal Revenue Code of 1986, as amended (the Code). The fund also intends to continue to comply with the requirements prescribed by the Code in order to maintain tax treatment as a RIC. The fund's investment objectives are to generate current income and, to a lesser extent, long-term capital appreciation. The Fund seeks to achieve its investment objective primarily through originated loans, equity and other securities, including syndicated loans, of private U.S. companies, specifically small and middle market companies, typically in the form of first lien senior secured and unitranche loans (including first out/last out loans), and to a lesser extent, second lien, third lien, unsecured and subordinated loans and other debt and equity securities. |
| Insider Trading |
Relationship |
Date |
Transaction |
Cost |
#Shares |
Value ($) |
#Shares Total |
SEC Form 4 |
| Whitaker Carlos | President | May 26 '23 | Buy | 25.68 | 3,895 | 100,024 | 3,895 | May 30 04:14 PM |
|
|
|
 |
| Market Cap | 32.08B | EPS (ttm) | 2.26 |
| P/E | 7.28 | EPS this Y | 5.87% |
| Forward P/E | 6.06 | EPS next Y | 16.87% |
| PEG | - | EPS past 5Y | 71.75% |
| P/S | 0.50 | EPS next 5Y | -1.39% |
| P/B | 0.46 | EPS Q/Q | -22.28% |
| Dividend | 4.27% | Sales Q/Q | 53.15% |
| Insider Own | 6.67% | Inst Own | 30.65% |
| Insider Trans | 0.00% | Inst Trans | - |
| Short Float | 0.47% | Earnings | Jan 31/a |
| Analyst Recom | 2.42 | Target Price | 16.13 |
| Avg Volume | 3.53M | 52W Range | 9.82 - 16.50 |
|
|
|
|
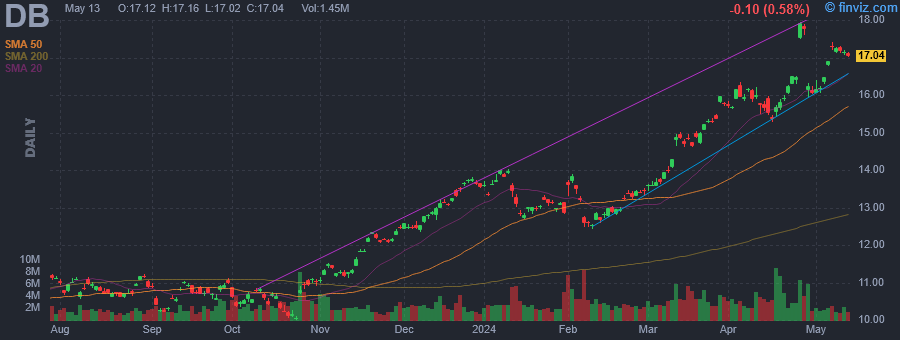
Deutsche Bank AG is a stock corporation company, which engages in the provision of corporate banking, investment services, private banking, and asset management. The company is classified in the Commercial Banks and Capital Markets, as per ISS ESG's sector classification. It operates through the following segments: Corporate Bank, Investment Bank, Private Bank, Asset Management, and Corporate and Other. The Corporate Bank segment offers cash management, trade finance and lending, foreign exchange, optimization of working capital and liquidity, securing global supply chains, and distribution channels to corporate and commercial clients; correspondent banking, trust and agency, and securities services to financial institutions; and business banking services to small corporate and entrepreneur clients. The Investment Bank segment is involved in origination and advisory businesses as well as fixed-income, currency, sales, and trading, which serves corporate and institutional clients. The Private Bank segment focuses on private bank Germany, private and commercial business international, and wealth management business units, as well as the International private bank, which also caters to commercial clients. The Asset Management segment refers to the investment solutions for individual investors and institutions through the DWS Group GmbH & Co. KGaA brand. The company was founded by Adelbert Delbruck on March 10, 1870 and is headquartered in Frankfurt, Germany. |
|
|
