 |
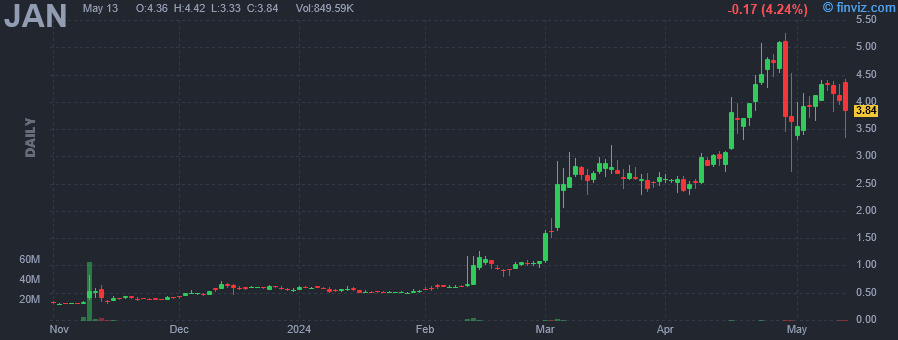
| Market Cap | 40.50M | EPS (ttm) | -4.67 |
| P/E | - | EPS this Y | - |
| Forward P/E | - | EPS next Y | - |
| PEG | - | EPS past 5Y | 23.21% |
| P/S | - | EPS next 5Y | - |
| P/B | - | EPS Q/Q | -9.46% |
| Dividend | - | Sales Q/Q | -100.00% |
| Insider Own | 11.05% | Inst Own | 3.61% |
| Insider Trans | 0.00% | Inst Trans | -7.88% |
| Short Float | 3.28% | Earnings | - |
| Analyst Recom | - | Target Price | - |
| Avg Volume | 302.90K | 52W Range | 0.22 - 4.50 |
|
|
|
|
JanOne, Inc. is a clinical-stage biopharmaceutical company, which engages in identifying, acquiring, licensing, developing, partnering, and commercializing novel, non-opioid, and non-addictive therapies to address the large unmet medical need for the treatment of pain and addiction. It operates under the Biotechnology and Recycling segments. The Biotechnology segment focuses on finding treatments for conditions that cause severe pain and bringing to market drugs with non-addictive pain-relieving properties. The Recycling segment is involved in a turnkey appliance recycling program. The company was founded by Edward R. Cameron in 1976 and is headquartered in Las Vegas, NV. |
|
 |
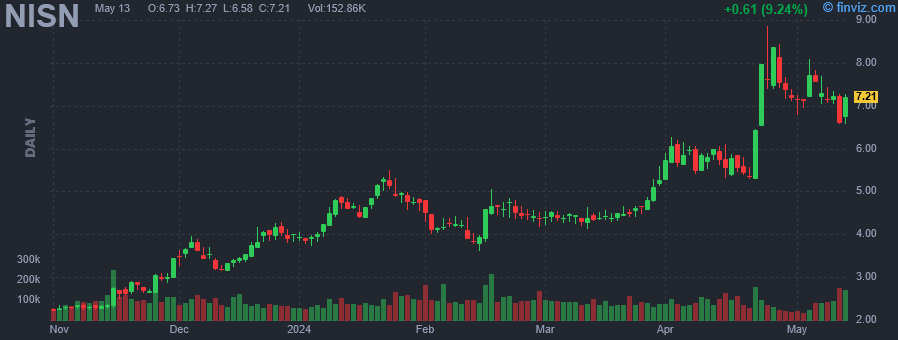 |
| Market Cap | 28.71M | EPS (ttm) | 1.16 |
| P/E | 6.19 | EPS this Y | - |
| Forward P/E | - | EPS next Y | - |
| PEG | - | EPS past 5Y | -2.04% |
| P/S | 0.12 | EPS next 5Y | - |
| P/B | 1.49 | EPS Q/Q | -91.92% |
| Dividend | - | Sales Q/Q | 7.49% |
| Insider Own | 24.22% | Inst Own | 4.42% |
| Insider Trans | 0.00% | Inst Trans | -49.57% |
| Short Float | 0.63% | Earnings | - |
| Analyst Recom | 1.00 | Target Price | 91.00 |
| Avg Volume | 106.24K | 52W Range | 2.16 - 6.45 |
|
|
|
|
Nisun International Enterprise Development Group Co., Ltd. engages in the development, manufacture, and provision of customized installation of valves and pipe fitting. Its products are used for pharmaceutical, biological, food and beverage, and other clean industries. The firm also offers steel fittings, sanitary pump, and filter. The company was founded on May 29, 2012 and is headquartered in Shanghai, China. |
|
|
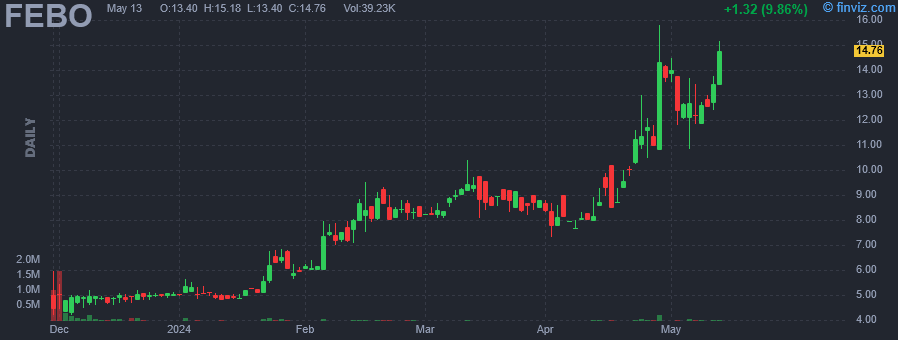 |
| Market Cap | 115.92M | EPS (ttm) | - |
| P/E | - | EPS this Y | - |
| Forward P/E | - | EPS next Y | - |
| PEG | - | EPS past 5Y | - |
| P/S | - | EPS next 5Y | - |
| P/B | - | EPS Q/Q | - |
| Dividend | - | Sales Q/Q | -4.60% |
| Insider Own | 72.32% | Inst Own | 0.03% |
| Insider Trans | 0.00% | Inst Trans | - |
| Short Float | 0.22% | Earnings | - |
| Analyst Recom | - | Target Price | - |
| Avg Volume | 15.76K | 52W Range | 4.19 - 10.41 |
|
|
|
|
Fenbo Holdings Limited, through its subsidiaries, manufactures and sells personal care electric appliances and toys products. The company offers curling wands and irons, flat irons and hair straighteners, hair dryers, trimmers, nail polishers, pet shampoo brushes, eyebrow pliers, etc. It serves customers in Europe, North America, South America, Asia, and internationally. The company was founded in 1993 and is headquartered in Kwun Tong, Hong Kong. Fenbo Holdings Limited operates as a subsidiary of Luxury Max Investments Limited. |
|
| |
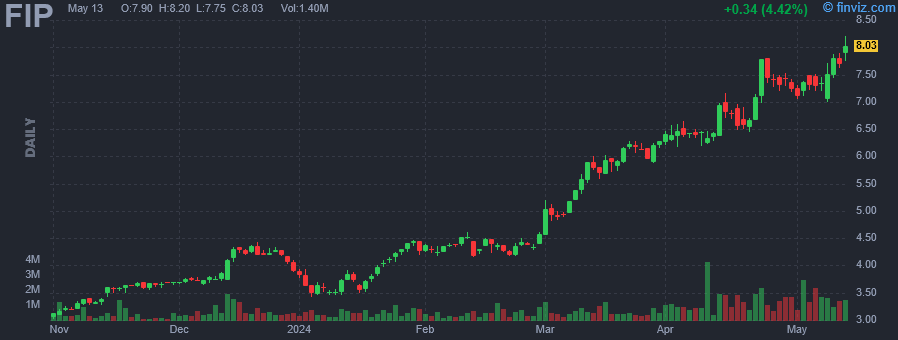 |
| Market Cap | 772.34M | EPS (ttm) | -1.78 |
| P/E | - | EPS this Y | 41.34% |
| Forward P/E | - | EPS next Y | 52.38% |
| PEG | - | EPS past 5Y | - |
| P/S | 2.41 | EPS next 5Y | - |
| P/B | 1.58 | EPS Q/Q | 23.86% |
| Dividend | 1.58% | Sales Q/Q | 14.08% |
| Insider Own | 1.56% | Inst Own | 78.86% |
| Insider Trans | 0.00% | Inst Trans | - |
| Short Float | 3.31% | Earnings | May 07/a |
| Analyst Recom | 1.00 | Target Price | 8.50 |
| Avg Volume | 770.70K | 52W Range | 2.64 - 7.16 |
|
|
|
|
FTAI Infrastructure, Inc. provides infrastructure and equipment for transportation. It is in the business of acquiring, developing and operating assets and businesses that represent critical infrastructure for customers in the transportation and energy industries. It operates under the following segments: Railroad, Jefferson Terminal, Repauno, Power and Gas, Sustainability and Energy Transition, and Corporate and Other. The company was founded on December 13, 2021 and is headquartered in New York, NY. |
| Insider Trading |
Relationship |
Date |
Transaction |
Cost |
#Shares |
Value ($) |
#Shares Total |
SEC Form 4 |
| Nicholson Kenneth J. | CEO and President | Aug 22 '23 | Option Exercise | 2.09 | 12,999 | 27,204 | 428,246 | Aug 24 07:07 AM | | Adams Joseph P. Jr. | Director | Aug 22 '23 | Option Exercise | 2.09 | 12,999 | 27,204 | 292,245 | Aug 24 07:02 AM |
|
|
|
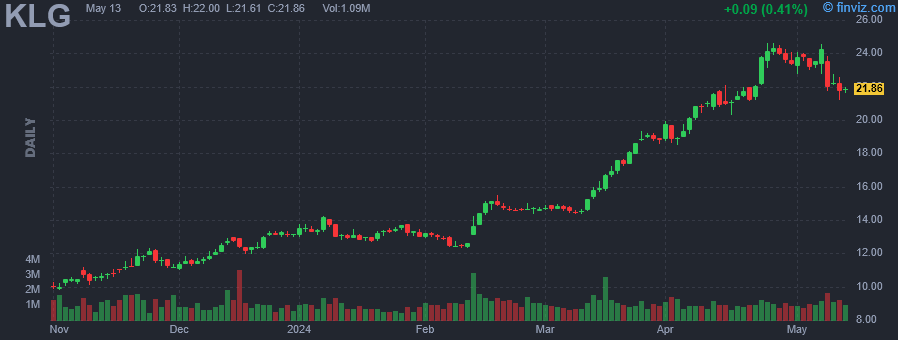 |
| Market Cap | 2.03B | EPS (ttm) | - |
| P/E | - | EPS this Y | -33.49% |
| Forward P/E | 15.76 | EPS next Y | 1.58% |
| PEG | - | EPS past 5Y | - |
| P/S | - | EPS next 5Y | - |
| P/B | 6.77 | EPS Q/Q | - |
| Dividend | 2.76% | Sales Q/Q | - |
| Insider Own | 24.28% | Inst Own | 62.69% |
| Insider Trans | 0.84% | Inst Trans | - |
| Short Float | 10.01% | Earnings | May 07/b |
| Analyst Recom | 3.00 | Target Price | 16.06 |
| Avg Volume | 1.15M | 52W Range | 9.65 - 22.08 |
|
|
|
|
WK Kellogg Co. produces and sells cereal based breakfast products. Its products include Frosted Flakes, Special K, Froot Loops, Raisin Bran, Frosted Mini- Wheats, Rice Krispies, Kashi, Corn Flakes, and Apple Jacks. The company was founded on November 23, 2022 and is headquartered in Battle Creek, MI. |
| Insider Trading |
Relationship |
Date |
Transaction |
Cost |
#Shares |
Value ($) |
#Shares Total |
SEC Form 4 |
| MURGUIA RAMON | Director | Feb 28 '24 | Buy | 14.64 | 1,000 | 14,640 | 10,860 | Mar 01 05:01 PM | | Brice Sherry | Chief Supply Chain Officer | Nov 22 '23 | Buy | 11.75 | 3,150 | 37,019 | 9,335 | Nov 22 06:07 PM | | Brice Sherry | Chief Supply Chain Officer | Nov 14 '23 | Buy | 10.77 | 5,580 | 60,077 | 6,185 | Nov 15 06:06 PM | | Barnes-Euresti Norma | CLO and Secretary | Nov 14 '23 | Buy | 10.67 | 4,675 | 49,897 | 7,738 | Nov 15 06:06 PM | | PILNICK GARY H | Chief Executive Officer | Nov 13 '23 | Buy | 10.69 | 93,500 | 999,094 | 95,442 | Nov 15 06:00 PM |
|
|
| |
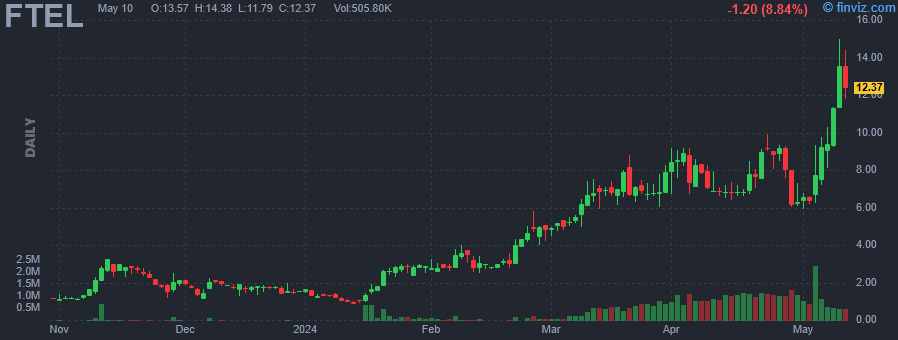 |
| Market Cap | 107.86M | EPS (ttm) | -0.38 |
| P/E | - | EPS this Y | - |
| Forward P/E | - | EPS next Y | - |
| PEG | - | EPS past 5Y | - |
| P/S | 27.87 | EPS next 5Y | - |
| P/B | 10.82 | EPS Q/Q | -4416.98% |
| Dividend | - | Sales Q/Q | -30.48% |
| Insider Own | 57.91% | Inst Own | 0.10% |
| Insider Trans | 0.00% | Inst Trans | - |
| Short Float | 1.73% | Earnings | - |
| Analyst Recom | - | Target Price | - |
| Avg Volume | 432.39K | 52W Range | 0.88 - 9.20 |
|
|
|
|
Fitell Corp. is an online retailer of gym and fitness equipment. Its brands include Muscle Motion, Rapid Motion, and FleetX. The company was founded in 2007 and is headquartered in Sydney, Australia. |
|
|
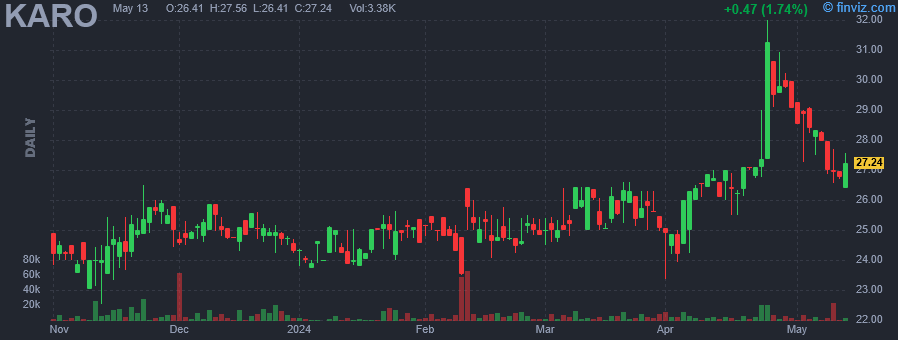 |
| Market Cap | 839.36M | EPS (ttm) | 1.18 |
| P/E | 22.92 | EPS this Y | - |
| Forward P/E | 18.97 | EPS next Y | - |
| PEG | 20.65 | EPS past 5Y | 14.32% |
| P/S | 3.82 | EPS next 5Y | 1.11% |
| P/B | 5.84 | EPS Q/Q | 26.70% |
| Dividend | 3.13% | Sales Q/Q | 9.08% |
| Insider Own | 76.12% | Inst Own | 11.65% |
| Insider Trans | 0.00% | Inst Trans | 2.49% |
| Short Float | 0.15% | Earnings | Jan 22/a |
| Analyst Recom | 1.75 | Target Price | 28.38 |
| Avg Volume | 8.17K | 52W Range | 18.59 - 27.10 |
|
|
|
|
Karooooo Ltd. engages in providing mobility data analytics solutions for the transportation industry. It operates through the following business segments: Cartrack, Carzuka, and Karooooo Logistics. The Cartrack segment provides an on-the-ground operational Internet of Things Software-as-a-service cloud. The Carzuka segment refers to a physical and e-commerce vehicle buying and selling marketplace. The Karooooo Logistics segment offers software applications enabling the management of last mile delivery and general operational logistics. It also operates through the South Africa, Africa-Other, Europe, and Asia-Pacific Middle East and U.S.A geographical segments. The company was founded on May 19, 2018 and is headquartered in Singapore. |
|
| |
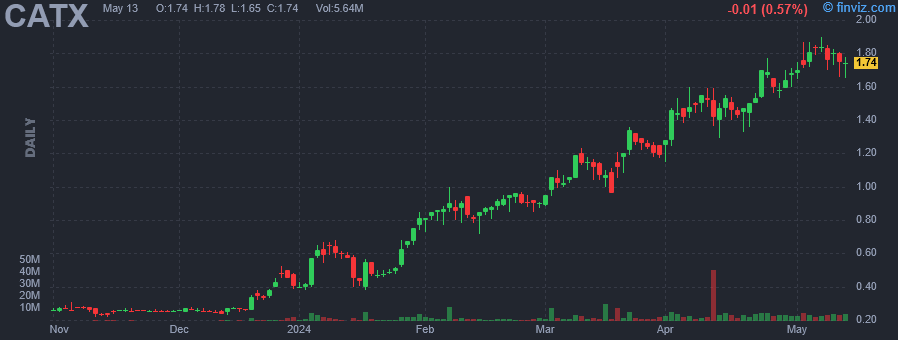 |
| Market Cap | 986.03M | EPS (ttm) | -0.09 |
| P/E | - | EPS this Y | 48.53% |
| Forward P/E | - | EPS next Y | -18.09% |
| PEG | - | EPS past 5Y | -7.69% |
| P/S | 111.54 | EPS next 5Y | - |
| P/B | 4.77 | EPS Q/Q | -29.02% |
| Dividend | - | Sales Q/Q | 27.26% |
| Insider Own | 20.55% | Inst Own | 6.17% |
| Insider Trans | 105.64% | Inst Trans | -1.05% |
| Short Float | 1.74% | Earnings | Mar 28/b |
| Analyst Recom | 1.00 | Target Price | 1.68 |
| Avg Volume | 4.02M | 52W Range | 0.20 - 1.60 |
|
|
|
|
Perspective Therapeutics, Inc. is a medical technology and radiopharmaceutical company, which engages in the provision of treatment applications for cancers. The company was founded in 1998 and is headquartered in Seattle, WA. |
| Insider Trading |
Relationship |
Date |
Transaction |
Cost |
#Shares |
Value ($) |
#Shares Total |
SEC Form 4 |
| Lantheus Alpha Therapy, LLC | 10% Owner | Mar 06 '24 | Buy | 0.95 | 60,431,039 | 57,409,487 | 116,773,394 | Mar 08 11:24 AM | | Williamson Robert F III | Director | Jan 30 '24 | Buy | 0.71 | 127,206 | 90,710 | 338,761 | Feb 01 04:53 PM | | Williamson Robert F III | Director | Jan 29 '24 | Buy | 0.64 | 25,266 | 16,170 | 211,555 | Jan 30 04:57 PM | | Williamson Robert F III | Director | Jan 26 '24 | Buy | 0.56 | 110,613 | 62,304 | 186,289 | Jan 30 04:57 PM | | Williamson Robert F III | Director | Jan 25 '24 | Buy | 0.49 | 22,134 | 10,846 | 75,676 | Jan 26 05:38 PM |
|
|
|
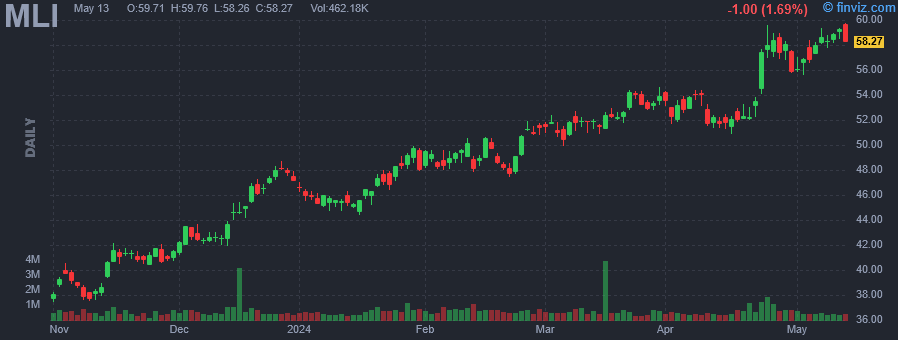 |
| Market Cap | 6.55B | EPS (ttm) | 5.31 |
| P/E | 10.86 | EPS this Y | -15.09% |
| Forward P/E | 12.13 | EPS next Y | 5.56% |
| PEG | 0.90 | EPS past 5Y | 42.21% |
| P/S | 1.91 | EPS next 5Y | 12.00% |
| P/B | 2.81 | EPS Q/Q | -15.11% |
| Dividend | 1.65% | Sales Q/Q | -16.55% |
| Insider Own | 3.64% | Inst Own | 96.99% |
| Insider Trans | -4.07% | Inst Trans | -0.44% |
| Short Float | 5.07% | Earnings | Apr 23/b |
| Analyst Recom | 1.00 | Target Price | 50.00 |
| Avg Volume | 689.14K | 52W Range | 34.08 - 54.64 |
|
|
|
|
Mueller Industries, Inc. engages in the manufacture of copper, brass, aluminum, and plastic products. It operates through the following segments: Piping Systems, Industrial Metals, and Climate. The Piping Systems segment consists of Domestic Piping Systems Group, Great Lakes Copper, Heatlink Group, European Operations, Trading Group, Jungwoo-Mueller, and Mueller Middle East. The Industrial Metals segment includes Brass Rod, Impacts & Micro Gauge, and Brass Value-Added Products. The Climate segment offers Refrigeration Products, Westermeyer, Turbotec, Flex Duct, and Linesets, Inc. The company was founded on October 3, 1990 and is headquartered in Memphis, TN. |
| Insider Trading |
Relationship |
Date |
Transaction |
Cost |
#Shares |
Value ($) |
#Shares Total |
SEC Form 4 |
| GOLDMAN SCOTT JAY | Director | Feb 12 '24 | Option Exercise | 11.76 | 9,778 | 114,940 | 57,852 | Feb 14 10:22 AM | | Martin Jeffrey Andrew | EVP, CFO & Treasurer | Feb 08 '24 | Sale | 49.25 | 47,280 | 2,328,587 | 370,840 | Feb 09 05:39 PM | | HANSEN JOHN B | Director | Feb 08 '24 | Sale | 49.33 | 5,000 | 246,650 | 18,000 | Feb 09 09:30 AM | | HERMANSON TERRY | Director | Jan 23 '24 | Option Exercise | 16.61 | 24,000 | 398,760 | 115,760 | Jan 25 12:15 PM | | Sigloch Steffen | Chief Manufacturing Officer | Dec 26 '23 | Sale | 47.59 | 53,792 | 2,559,961 | 212,882 | Dec 27 11:29 AM |
|
|
|
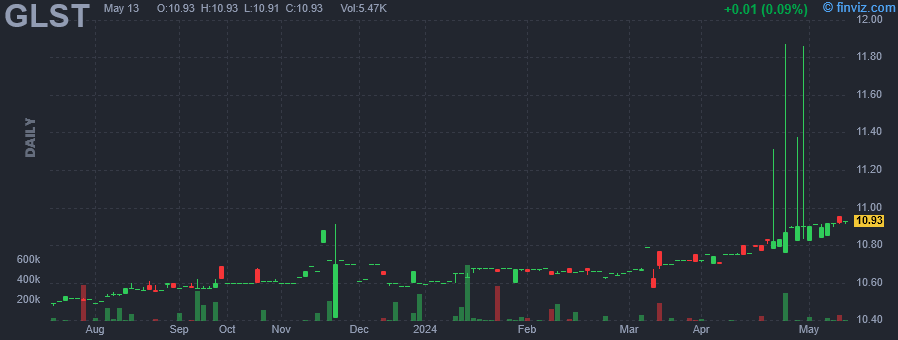 |
| Market Cap | 80.98M | EPS (ttm) | 0.09 |
| P/E | 121.32 | EPS this Y | - |
| Forward P/E | - | EPS next Y | - |
| PEG | - | EPS past 5Y | - |
| P/S | - | EPS next 5Y | - |
| P/B | 1.74 | EPS Q/Q | -111.22% |
| Dividend | - | Sales Q/Q | - |
| Insider Own | 38.24% | Inst Own | 77.49% |
| Insider Trans | 0.00% | Inst Trans | - |
| Short Float | 0.01% | Earnings | - |
| Analyst Recom | - | Target Price | - |
| Avg Volume | 27.02K | 52W Range | 10.31 - 11.31 |
|
|
|
|
Global Star Acquisition, Inc. is a blank check company that was formed for the purpose of effecting a merger, capital stock exchange, asset acquisition, stock purchase, reorganization or similar business combination with one or more business. The company was founded on July 24, 2019 and is headquartered in McLean, VA. |
|
|
