 |
| Market Cap | 93.30M | EPS (ttm) | -2.59 |
| P/E | - | EPS this Y | 20.82% |
| Forward P/E | - | EPS next Y | 18.30% |
| PEG | - | EPS past 5Y | 38.92% |
| P/S | 26.66 | EPS next 5Y | - |
| P/B | 6.10 | EPS Q/Q | -920.75% |
| Dividend | - | Sales Q/Q | -100.00% |
| Insider Own | 5.27% | Inst Own | 51.75% |
| Insider Trans | 0.90% | Inst Trans | 22.75% |
| Short Float | 7.70% | Earnings | Mar 18/b |
| Analyst Recom | 1.00 | Target Price | 21.33 |
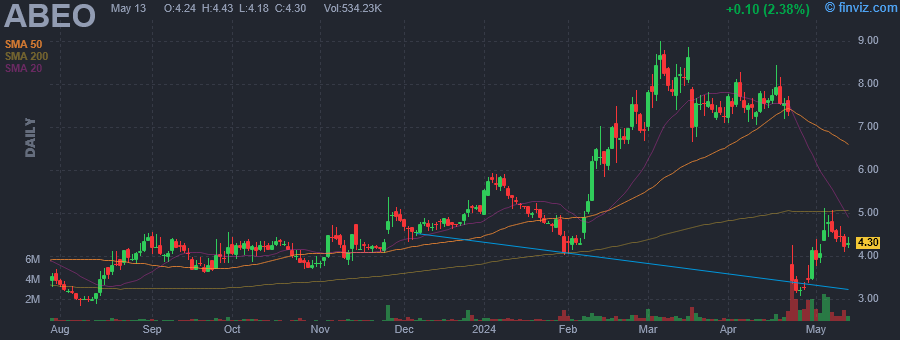
| Avg Volume | 367.42K | 52W Range | 2.83 - 9.01 |
|
|
|
|
Abeona Therapeutics, Inc. is a clinical stage biopharmaceutical company, which engages in the development of gene therapy for severe and life-threatening rare diseases. It programs include EB-101 (gene-corrected skin grafts) for recessive dystrophic epidermolysis bullosa (RDEB), ABO-102 (AAV-SGSH), an adeno-associated virus (AAV) based gene therapy for Sanfilippo syndrome type A (MPS IIIA), and ABO-101 (AAV NAGLU), an AAV based gene therapy for Sanfilippo syndrome type B (MPS IIIB). The company was founded in 1974 and is headquartered in Cleveland, OH. |
| Insider Trading |
Relationship |
Date |
Transaction |
Cost |
#Shares |
Value ($) |
#Shares Total |
SEC Form 4 |
| Seshadri Vishwas | Chief Executive Officer | Feb 06 '24 | Buy | 4.39 | 20,000 | 87,800 | 528,260 | Feb 07 08:30 AM | | Alvino Mark | Director | Jan 17 '24 | Sale | 5.11 | 7,084 | 36,199 | 62,816 | Jan 22 04:30 PM | | Seshadri Vishwas | Chief Executive Officer | Sep 27 '23 | Buy | 4.07 | 20,000 | 81,400 | 521,731 | Sep 29 07:30 AM | | Charles Faith L. | Director | Sep 27 '23 | Sale | 4.91 | 8,330 | 40,924 | 70,773 | Sep 29 04:30 PM | | Alland Leila | Director | Sep 27 '23 | Sale | 3.90 | 7,246 | 28,270 | 71,857 | Sep 29 04:30 PM |
|
|
 |
 |
| Market Cap | 64.98M | EPS (ttm) | -0.17 |
| P/E | - | EPS this Y | 83.44% |
| Forward P/E | - | EPS next Y | 4.00% |
| PEG | - | EPS past 5Y | - |
| P/S | 22.41 | EPS next 5Y | - |
| P/B | 9.72 | EPS Q/Q | 39.10% |
| Dividend | - | Sales Q/Q | - |
| Insider Own | 82.70% | Inst Own | 0.04% |
| Insider Trans | 0.00% | Inst Trans | -39.39% |
| Short Float | 0.08% | Earnings | Mar 13/b |
| Analyst Recom | 1.00 | Target Price | 6.00 |
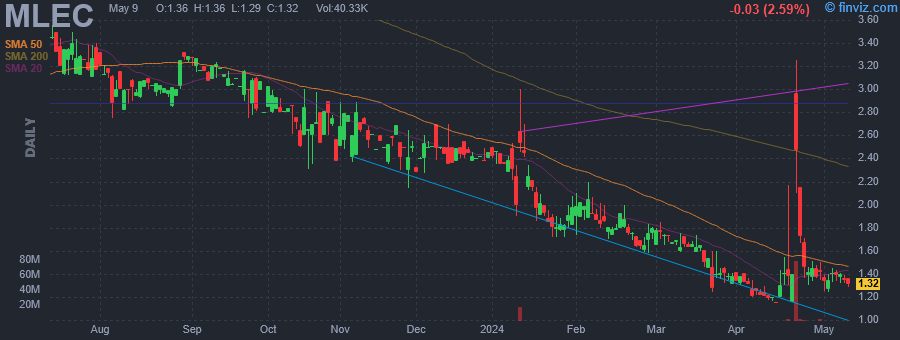
| Avg Volume | 1.34M | 52W Range | 1.15 - 4.40 |
|
|
|
|
Moolec Science SA operates as a science-based ingredient company. It engages in the production of animal proteins in plants through molecular forming. The company was founded by Gaston Paladini, Henk Hoogenkamp, and Martin Salinas on May 23, 2022 and is headquartered in Luxembourg. |
|
|
 |
| Market Cap | 114.08M | EPS (ttm) | -0.18 |
| P/E | - | EPS this Y | 38.89% |
| Forward P/E | 96.33 | EPS next Y | 109.09% |
| PEG | - | EPS past 5Y | 17.43% |
| P/S | 2.82 | EPS next 5Y | 20.00% |
| P/B | 3.66 | EPS Q/Q | 12.52% |
| Dividend | - | Sales Q/Q | -29.60% |
| Insider Own | 6.82% | Inst Own | 28.47% |
| Insider Trans | 0.00% | Inst Trans | -14.87% |
| Short Float | 3.33% | Earnings | Mar 14/a |
| Analyst Recom | 1.00 | Target Price | 3.00 |
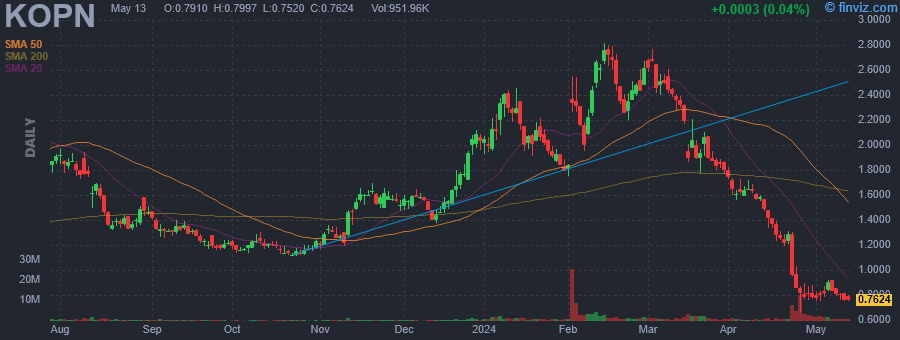
| Avg Volume | 1.99M | 52W Range | 0.97 - 2.82 |
|
|
|
|
Kopin Corp. engages in the development, manufacture and sale of wearable technologies which include components and systems. Its portfolio includes AMLCD, LCOS displays, OLED displays, ASIC, backlights, and optical lenses. The firm uses semiconductor material technology to design, manufacture and market its component products for use in military, enterprise and consumer electronic applications, training and simulation equipment and 3D metrology equipment. The company was founded by John C.C. Fan on April 23, 1984 and is headquartered in Westborough, MA. |
| Insider Trading |
Relationship |
Date |
Transaction |
Cost |
#Shares |
Value ($) |
#Shares Total |
SEC Form 4 |
| FAN JOHN C C | Director | May 17 '23 | Buy | 1.35 | 23,293 | 31,446 | 5,531,099 | May 18 04:05 PM | | FAN JOHN C C | Director | May 16 '23 | Buy | 1.25 | 25,000 | 31,250 | 5,507,806 | May 17 05:12 PM | | BREWINGTON JAMES K | Director | May 16 '23 | Buy | 1.35 | 5,000 | 6,750 | 115,000 | May 17 05:15 PM | | Anchin Scott L | Director | May 16 '23 | Buy | 1.23 | 5,000 | 6,125 | 2,500 | May 17 05:15 PM | | HSIEH CHI CHIA DR | Director | May 16 '23 | Buy | 1.18 | 1,000 | 1,180 | 77,000 | May 17 05:12 PM |
|
|
| |
 |
| Market Cap | 56.55M | EPS (ttm) | 0.08 |
| P/E | 23.21 | EPS this Y | - |
| Forward P/E | - | EPS next Y | - |
| PEG | - | EPS past 5Y | - |
| P/S | 4.79 | EPS next 5Y | - |
| P/B | - | EPS Q/Q | 53.50% |
| Dividend | - | Sales Q/Q | 88.70% |
| Insider Own | 69.52% | Inst Own | - |
| Insider Trans | 0.00% | Inst Trans | - |
| Short Float | - | Earnings | - |
| Analyst Recom | - | Target Price | - |
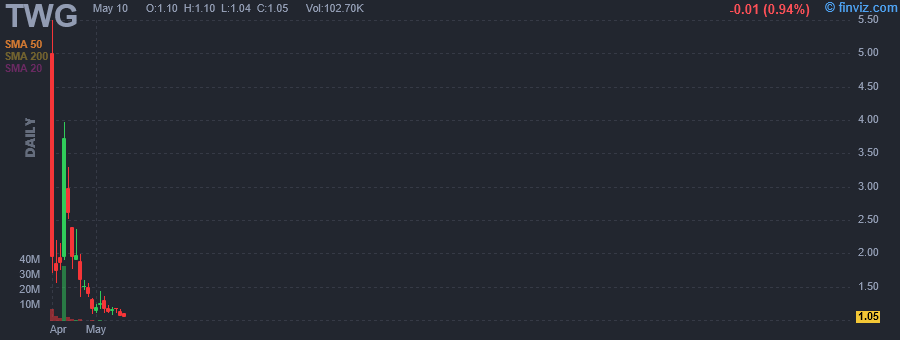
| Avg Volume | 10.42M | 52W Range | 1.55 - 5.50 |
|
|
|
|
Top Wealth Group Holding Limited, through its subsidiaries, provides caviar and caviar-based gourmet products in Hong Kong and internationally. The company also trades in caviars; and offers its products under the Imperial Cristal Caviar brand name. It serves food and beverage related distributors. The company was founded in 2009 and is based in Sai Wan, Hong Kong. Top Wealth Group Holding Limited operates as a subsidiary of Winwin Development Group Limited. |
|
|
 |
| Market Cap | 67.16M | EPS (ttm) | - |
| P/E | - | EPS this Y | - |
| Forward P/E | - | EPS next Y | - |
| PEG | - | EPS past 5Y | - |
| P/S | - | EPS next 5Y | - |
| P/B | - | EPS Q/Q | -85.40% |
| Dividend | - | Sales Q/Q | -36.90% |
| Insider Own | - | Inst Own | - |
| Insider Trans | - | Inst Trans | - |
| Short Float | - | Earnings | - |
| Analyst Recom | - | Target Price | - |
| Avg Volume | 3.65M | 52W Range | 4.55 - 11.78 |
|
|
|
|
Tungray Technologies Inc., through its subsidiaries, provides customized industrial manufacturing solutions to original equipment manufacturers in the industry sectors of semiconductors, printers, electronics, and home appliances. It primarily operates in business lines, including customized industrial test and tooling solutions; welding equipment manufacturing; and direct drive and linear direct current motors. The company also designs, develops, and manufactures non- standard equipment, such as automated assembly equipment, precision testing equipment, tooling fixtures, etc., as well as induction brazing and hardening equipment; researches, develops, and sells intelligent robots and storage equipment; and installs industrial machinery and equipment, and mechanical engineering works. It operates in Singapore, Malaysia, Thailand, Spain, China, and Brazil. The company was incorporated in 2022 and is headquartered in Singapore. Tungray Technologies Inc. operates as a subsidiary of Pegasus Automation Limited. |
|
| |
 |
| Market Cap | 61.61M | EPS (ttm) | 0.77 |
| P/E | 8.17 | EPS this Y | - |
| Forward P/E | - | EPS next Y | - |
| PEG | 0.82 | EPS past 5Y | - |
| P/S | 1.38 | EPS next 5Y | 10.00% |
| P/B | 1.63 | EPS Q/Q | 41.57% |
| Dividend | - | Sales Q/Q | 18.43% |
| Insider Own | 69.03% | Inst Own | 6.34% |
| Insider Trans | 0.00% | Inst Trans | -2.09% |
| Short Float | 0.14% | Earnings | - |
| Analyst Recom | - | Target Price | - |
| Avg Volume | 14.89K | 52W Range | 3.47 - 8.00 |
|
|
|
|
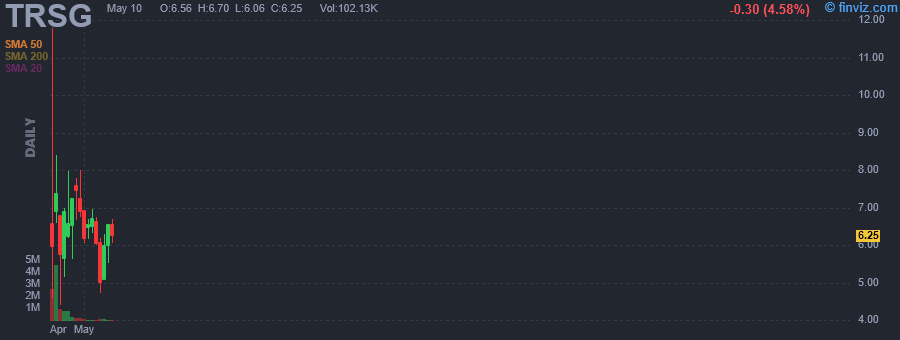
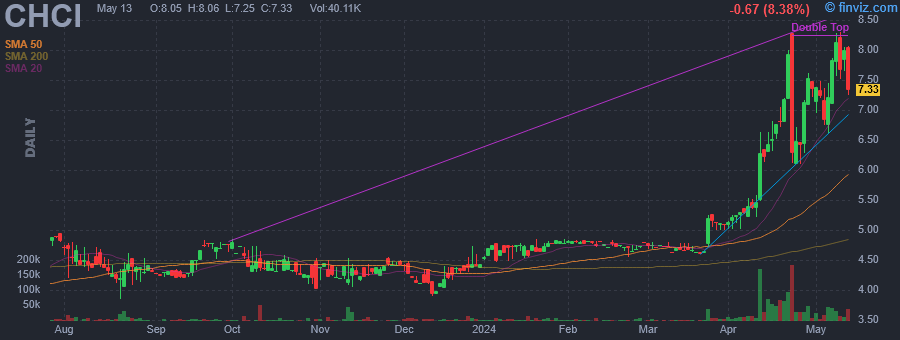
Comstock Holding Cos., Inc. engages in the development of real estate properties and provision of asset management services. It operates through the following segments: Asset Management and Real Estate Services. The Asset Management segment management provides services to real estate assets and businesses that include commercial real estate uses, including apartments, hotels, office buildings, commercial garages, leased lands, retail stores, mixed-use developments, and urban transit-oriented development. The Real Estate Services segment provides real estate services in the areas of strategic corporate planning, capital markets, brokerage services, and environmental and design-based services. Its environmental services group provides consulting and engineering services, environmental studies, remediation services and provides site specific solutions for any project that may have an environmental impact, from environmental due diligence to site-specific assessments and remediation. The company was founded by Christopher Clemente in 1985 and is headquartered in Reston, VA. |
|
|
 |
| Market Cap | 2.64M | EPS (ttm) | -4.29 |
| P/E | - | EPS this Y | - |
| Forward P/E | - | EPS next Y | - |
| PEG | - | EPS past 5Y | 50.20% |
| P/S | 0.04 | EPS next 5Y | - |
| P/B | 0.39 | EPS Q/Q | 77.03% |
| Dividend | - | Sales Q/Q | 41.00% |
| Insider Own | 6.40% | Inst Own | 1.96% |
| Insider Trans | 0.00% | Inst Trans | -89.39% |
| Short Float | 3.05% | Earnings | Feb 12/a |
| Analyst Recom | 1.00 | Target Price | 11.00 |
| Avg Volume | 53.84K | 52W Range | 2.91 - 11.45 |
|
|
|
|
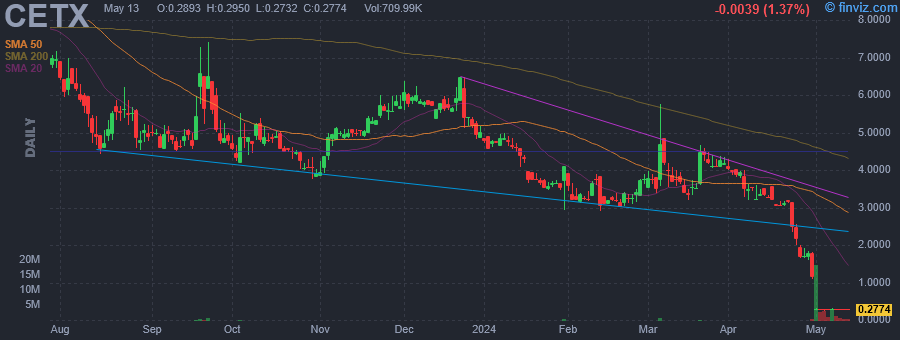
Cemtrex, Inc. engages in the provision of solutions in the technology industry. It operates through the following segments: Security, Industrial Services, and Cemtrex Corporate. The Security segment provides end-to-end security solutions to meet corporate, industrial, and governmental security challenges. The Industrial Services segment offers single-source expertise and services for rigging, millwrighting, in plant maintenance, equipment erection, relocation, and disassembly to diversified customers. The Cemtrex Corporate segment refers to the holding company of the other two segments. The company was founded on April 27, 1998 and is headquartered in Hauppauge, NY. |
| Insider Trading |
Relationship |
Date |
Transaction |
Cost |
#Shares |
Value ($) |
#Shares Total |
SEC Form 4 |
| GOVIL SAAGAR | CEO | Aug 30 '23 | Buy | 0.95 | 15,100 | 14,380 | 132,298 | Sep 05 04:30 PM | | GOVIL SAAGAR | CFO | Aug 25 '23 | Buy | 0.91 | 7,100 | 6,461 | 116,486 | Aug 29 04:15 PM | | GOVIL SAAGAR | CFO | Aug 24 '23 | Buy | 0.93 | 3,000 | 2,789 | 109,386 | Aug 29 04:15 PM | | GOVIL SAAGAR | CFO | Jun 15 '23 | Buy | 0.97 | 27,798 | 26,836 | 106,386 | Jun 21 08:23 AM | | GOVIL SAAGAR | CEO | Jun 14 '23 | Buy | 0.93 | 8,028 | 7,485 | 78,588 | Jun 14 04:56 PM |
|
|
| |
 |
| Market Cap | 114.77M | EPS (ttm) | -1.11 |
| P/E | - | EPS this Y | -10.89% |
| Forward P/E | - | EPS next Y | 24.49% |
| PEG | - | EPS past 5Y | 48.08% |
| P/S | - | EPS next 5Y | - |
| P/B | 1.24 | EPS Q/Q | -2.62% |
| Dividend | - | Sales Q/Q | - |
| Insider Own | 24.25% | Inst Own | 68.31% |
| Insider Trans | 75.75% | Inst Trans | -0.33% |
| Short Float | 0.83% | Earnings | Feb 13/a |
| Analyst Recom | 1.00 | Target Price | 9.67 |
| Avg Volume | 361.98K | 52W Range | 0.72 - 3.69 |
|
|
|
Today 08:00AM
|
Phase 2 RIZE Study Sub-Analyses to be Presented at the 2024 Pediatric Endocrine Society Annual Meeting
(GlobeNewswire) -19.21% |
|
Mar-20-24 02:33PM
|
Hedge Fund and Insider Trading News: Ken Griffin, Nelson Peltz, Palliser Capital, Elliott Management, Three Arrows Capital, Rezolute, Inc. (RZLT), Tesla Inc (TSLA), and More
(Insider Monkey) |
|
Mar-06-24 07:30AM
|
Rezolute Reports Validation of the Potential Use of RZ358 for Treatment of Non-Islet Cell Tumor Hypoglycemia (NICTH)
(GlobeNewswire) |
|
Feb-13-24 04:05PM
|
Rezolute Reports Second Quarter Fiscal 2024 Results and Provides Business Update
(GlobeNewswire) |
|
Jan-24-24 08:00AM
|
Rezolute Expands Leadership Team with Appointment of Daron Evans, MS, MBA, as Chief Financial Officer
(GlobeNewswire) +6.37% |
|
Jan-23-24 08:00AM
|
Rezolute Receives Innovation Passport Designation from the U.K. Innovative Licensing and Access Pathway Steering Group for RZ358 in the Treatment of Hypoglycemia Due to Congenital Hyperinsulinism
(GlobeNewswire) |
|
Dec-14-23 08:00AM
|
Rezolute Initiates Phase 3 Clinical Study for RZ358 in Congenital Hyperinsulinism
(GlobeNewswire) |
|
Dec-13-23 08:00AM
|
Rezolute Completes Enrollment of its Phase 2 Study in Diabetic Macular Edema ( DME )
(GlobeNewswire) +8.37% |
|
Nov-24-23 11:14AM
|
Stonegate Healthcare Partners Announces Black Friday Biotech Special Report For an 'XBI-MAS'
(Newsfile) |
|
Nov-17-23 08:00AM
|
Rezolute to Participate in BTIG's 3rd Annual Ophthalmology Day
(GlobeNewswire) |
|
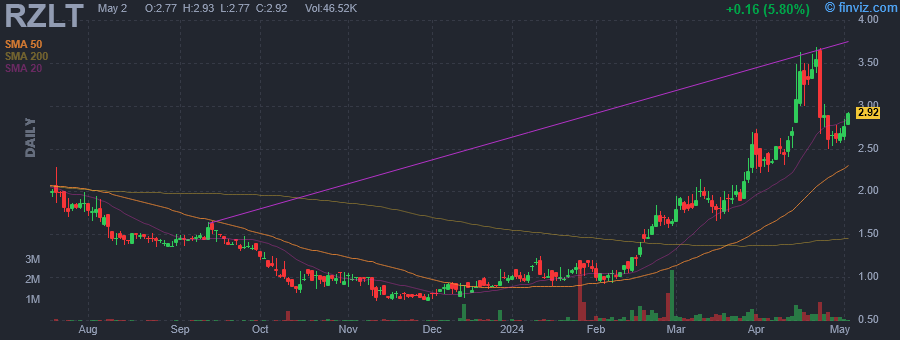
Rezolute, Inc. operates as a biopharmaceutical company, which engages in the development of drug therapies for patients with metabolic and orphan diseases. Its products include RZ358-Phase 2, an antibody for the ultra-orphan indication of congenital hyperinsulinism, AB101-Phase 1, a once-weekly injectable basal insulin, and RZ402, which targets diabetic macular edema. The company was founded by Nevan Charles Elam, Ho Young Huh, and Sankaram Mantripragada on July 26, 2010 and is headquartered in Redwood City, CA. |
| Insider Trading |
Relationship |
Date |
Transaction |
Cost |
#Shares |
Value ($) |
#Shares Total |
SEC Form 4 |
| ROBERTS BRIAN KENNETH | Chief Medical Officer | Mar 28 '24 | Buy | 2.55 | 500 | 1,275 | 1,076 | Mar 29 11:08 AM | | Evans Daron | CFO | Mar 15 '24 | Buy | 1.69 | 20,000 | 33,830 | 20,000 | Mar 19 09:17 AM | | ROBERTS BRIAN KENNETH | Chief Medical Officer | Mar 14 '24 | Buy | 1.88 | 10,000 | 18,800 | 10,000 | Mar 18 11:20 AM | | Evans Daron | CFO | Mar 08 '24 | Buy | 1.93 | 50,000 | 96,345 | 120,900 | Mar 08 12:37 PM | | Kim Young-Jin | Director | Mar 07 '24 | Buy | 1.91 | 36,503 | 69,859 | 115,450 | Mar 14 10:35 AM |
|
|
|
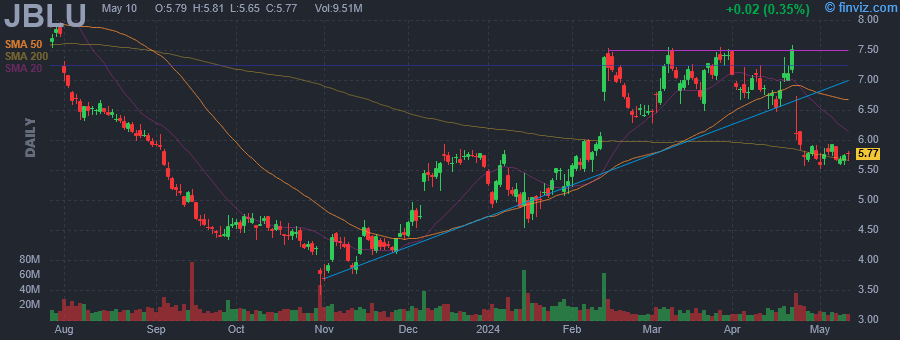 |
| Market Cap | 2.07B | EPS (ttm) | -0.94 |
| P/E | - | EPS this Y | -61.18% |
| Forward P/E | 962.15 | EPS next Y | 100.87% |
| PEG | - | EPS past 5Y | - |
| P/S | 0.22 | EPS next 5Y | - |
| P/B | 0.62 | EPS Q/Q | -520.63% |
| Dividend | - | Sales Q/Q | -3.73% |
| Insider Own | 0.42% | Inst Own | 79.79% |
| Insider Trans | 0.00% | Inst Trans | -9.95% |
| Short Float | 12.90% | Earnings | Apr 23/b |
| Analyst Recom | 3.19 | Target Price | 6.33 |
| Avg Volume | 14.92M | 52W Range | 3.42 - 9.45 |
|
|
| Today | Reiterated |
TD Cowen |
Hold |
$7 → $6 |
|
|
|
JetBlue Airways Corp. engages in the provision of air transportation services. Its brands include jetBlue, jetBlue Vacations, Paisly, and TrueBlue. It operates through the following geographic segments: Domestic and Canada, Caribbean and Latin America, and Atlantic. The company was founded by David Gary Neeleman in August 1998 and is headquartered in Long Island City, NY. |
| Insider Trading |
Relationship |
Date |
Transaction |
Cost |
#Shares |
Value ($) |
#Shares Total |
SEC Form 4 |
| Spencer Gerald Alfred | Principal Accounting Officer | Aug 18 '23 | Sale | 6.35 | 11,879 | 75,432 | 0 | Aug 22 05:14 PM |
|
|
|
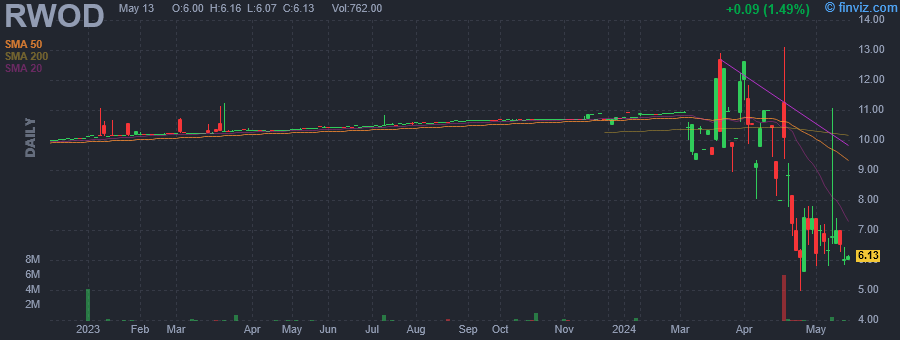 |
| Market Cap | 12.65M | EPS (ttm) | 0.11 |
| P/E | 66.21 | EPS this Y | - |
| Forward P/E | - | EPS next Y | - |
| PEG | - | EPS past 5Y | - |
| P/S | - | EPS next 5Y | - |
| P/B | 3.31 | EPS Q/Q | -64.17% |
| Dividend | - | Sales Q/Q | - |
| Insider Own | 39.65% | Inst Own | 88.99% |
| Insider Trans | 0.00% | Inst Trans | - |
| Short Float | 0.55% | Earnings | - |
| Analyst Recom | - | Target Price | - |
| Avg Volume | 168.58K | 52W Range | 7.76 - 13.10 |
|
|
|
|
Redwoods Acquisition Corp. is a blank check company. It was formed for the purpose of entering into a merger, stock exchange, asset acquisition, stock purchase, recapitalization, reorganization, or similar business combination with one or more businesses or entities. The company was founded on March 16, 2021 and is headquartered in New York, NY. |
|
|
