 |
| Market Cap | 120.38M | EPS (ttm) | 1.94 |
| P/E | 8.58 | EPS this Y | - |
| Forward P/E | - | EPS next Y | - |
| PEG | - | EPS past 5Y | 1.51% |
| P/S | 0.90 | EPS next 5Y | - |
| P/B | 0.65 | EPS Q/Q | 27.17% |
| Dividend | 2.40% | Sales Q/Q | 34.28% |
| Insider Own | 40.07% | Inst Own | 15.00% |
| Insider Trans | 0.21% | Inst Trans | 4.02% |
| Short Float | 0.12% | Earnings | Apr 17/b |
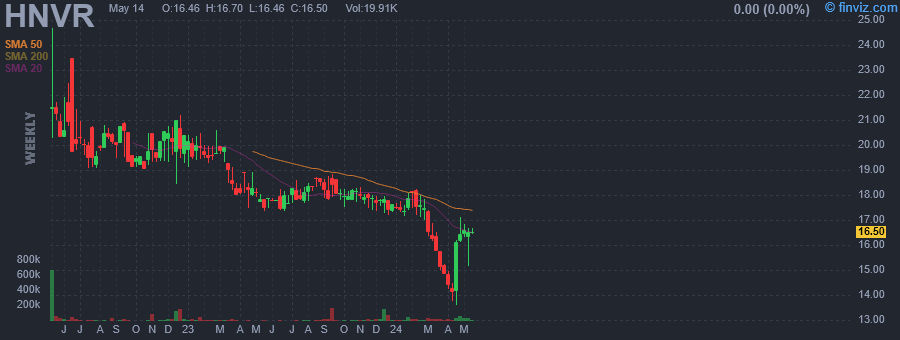
| Analyst Recom | 1.00 | Target Price | 18.50 |
| Avg Volume | 6.09K | 52W Range | 13.62 - 18.91 |
|
|
|
|
Hanover Bancorp, Inc. is a bank holding company, which engages in the provision of financial services and commercial banking products and services. It also offers multi-family and commercial mortgages, residential loans, business loans, and lines of credit. The company was founded on November 4, 2008 and is headquartered in New York, NY. |
| Insider Trading |
Relationship |
Date |
Transaction |
Cost |
#Shares |
Value ($) |
#Shares Total |
SEC Form 4 |
| Vivona John P | FSVP & Chief Risk Officer | Apr 24 '24 | Buy | 16.79 | 200 | 3,357 | 3,200 | Apr 25 12:25 PM | | PUORRO MICHAEL P | Chairman & CEO | Apr 24 '24 | Buy | 16.78 | 200 | 3,356 | 277,888 | Apr 25 12:23 PM | | PUORRO MICHAEL P | Chairman & CEO | Apr 23 '24 | Buy | 16.90 | 200 | 3,380 | 277,688 | Apr 25 12:23 PM | | Sisti Elena | Director | Apr 22 '24 | Buy | 16.95 | 2,000 | 33,900 | 101,878 | Apr 23 01:59 PM | | Wilcox McClelland W | President | Apr 22 '24 | Buy | 16.91 | 200 | 3,382 | 81,287 | Apr 23 12:30 PM |
|
|
 |
 |
| Market Cap | 91.25M | EPS (ttm) | 0.34 |
| P/E | 28.08 | EPS this Y | - |
| Forward P/E | - | EPS next Y | - |
| PEG | 1.87 | EPS past 5Y | 25.97% |
| P/S | 1.73 | EPS next 5Y | 15.00% |
| P/B | 2.49 | EPS Q/Q | 140.83% |
| Dividend | - | Sales Q/Q | 29.13% |
| Insider Own | 10.71% | Inst Own | 58.63% |
| Insider Trans | 1.22% | Inst Trans | -1.15% |
| Short Float | 0.45% | Earnings | Mar 14/a |
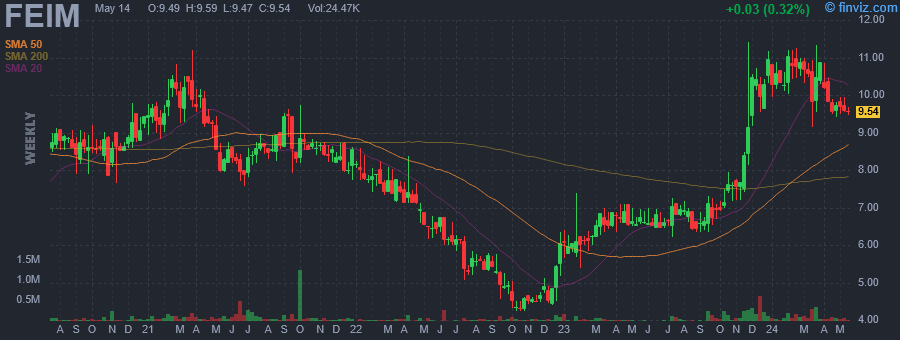
| Analyst Recom | 1.00 | Target Price | 17.00 |
| Avg Volume | 27.54K | 52W Range | 6.22 - 11.41 |
|
|
|
|
Frequency Electronics, Inc. engages in the design, development, and manufacture of precision time and frequency generation technology. It operates through the FEI-NY and FEI-Zyfer business segments. The FEI-NY segment provides precision time, frequency generation, and synchronization products and subsystems that are found on-board satellites, in ground-based communication stations, and imbedded in moving platforms. The FEI-Zyfer segment designs, develops, and manufactures products for precision time and frequency generation and synchronization, primarily incorporating GPS technology. The company was founded by Martin B. Bloch on August 25, 1961 and is headquartered in Mitchel Field, NY. |
| Insider Trading |
Relationship |
Date |
Transaction |
Cost |
#Shares |
Value ($) |
#Shares Total |
SEC Form 4 |
| Sarachek Russell M | Director | Apr 19 '24 | Buy | 9.51 | 1,602 | 15,235 | 435,347 | Apr 25 11:07 AM | | Sarachek Russell M | Director | Apr 15 '24 | Buy | 9.77 | 658 | 6,429 | 433,745 | Apr 19 03:03 PM | | Edenbrook Capital, LLC | Director | Mar 20 '24 | Buy | 9.94 | 10,000 | 99,400 | 1,602,306 | Mar 22 04:54 PM | | Sarachek Russell M | Director | Sep 22 '23 | Buy | 6.73 | 4,928 | 33,165 | 433,087 | Sep 27 01:35 PM | | Sarachek Russell M | Director | Sep 19 '23 | Buy | 6.96 | 5,163 | 35,934 | 428,159 | Sep 20 06:00 PM |
|
|
|
 |
| Market Cap | 11.24M | EPS (ttm) | -0.12 |
| P/E | - | EPS this Y | - |
| Forward P/E | - | EPS next Y | - |
| PEG | - | EPS past 5Y | - |
| P/S | 39.31 | EPS next 5Y | - |
| P/B | 0.81 | EPS Q/Q | - |
| Dividend | 0.95% | Sales Q/Q | 26.30% |
| Insider Own | 14.93% | Inst Own | 16.55% |
| Insider Trans | 1.61% | Inst Trans | - |
| Short Float | 0.05% | Earnings | - |
| Analyst Recom | - | Target Price | - |
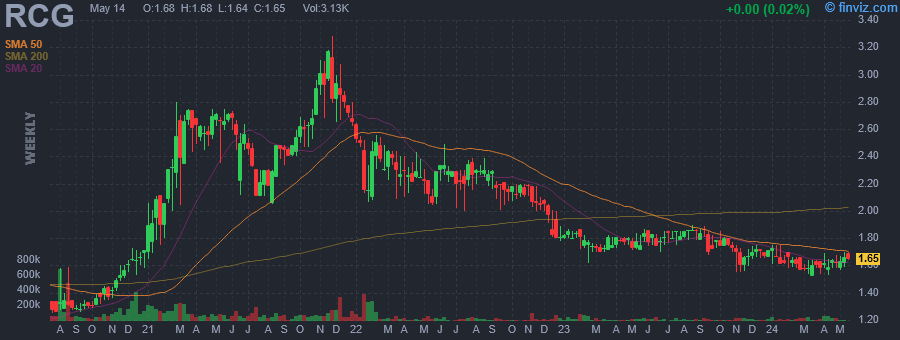
| Avg Volume | 7.44K | 52W Range | 1.52 - 1.90 |
|
|
|
|
RENN Fund, Inc. is a closed ended equity mutual fund launched by RENN Capital Group, Inc. The fund is co-managed by Horizon Kinetics Asset Management LLC. It invests in the public equity markets of the United States. The fund seeks to invest in stocks of companies operating across diversified sectors. It seeks to invest in stocks of small-cap and mid-cap companies. The fund employs a fundamental analysis with a bottom-up stock picking approach to create its portfolio. It was formerly known as RENN Global Entrepreneurs Fund, Inc. RENN Fund, Inc. was formed on January 20, 1994 and is domiciled in the United States. |
| Insider Trading |
Relationship |
Date |
Transaction |
Cost |
#Shares |
Value ($) |
#Shares Total |
SEC Form 4 |
| STAHL MURRAY | President and CEO | Apr 24 '24 | Buy | 1.70 | 55 | 94 | 247,498 | Apr 25 10:40 AM | | STAHL MURRAY | President and CEO | Apr 24 '24 | Buy | 1.70 | 4 | 7 | 5,015 | Apr 25 10:40 AM | | STAHL MURRAY | President and CEO | Apr 23 '24 | Buy | 1.65 | 55 | 91 | 247,474 | Apr 24 11:17 AM | | STAHL MURRAY | President and CEO | Apr 23 '24 | Buy | 1.65 | 2 | 3 | 5,011 | Apr 24 11:17 AM | | STAHL MURRAY | President and CEO | Apr 22 '24 | Buy | 1.58 | 55 | 87 | 247,450 | Apr 23 11:08 AM |
|
|
| |
 |
| Market Cap | 13.55B | EPS (ttm) | 17.59 |
| P/E | 33.47 | EPS this Y | -8.60% |
| Forward P/E | 8.05 | EPS next Y | 248.00% |
| PEG | 1.67 | EPS past 5Y | 14.40% |
| P/S | 21.45 | EPS next 5Y | 20.03% |
| P/B | 12.99 | EPS Q/Q | 13.90% |
| Dividend | 0.75% | Sales Q/Q | 9.20% |
| Insider Own | 0.82% | Inst Own | 59.40% |
| Insider Trans | 1.10% | Inst Trans | - |
| Short Float | 3.62% | Earnings | May 08/a |
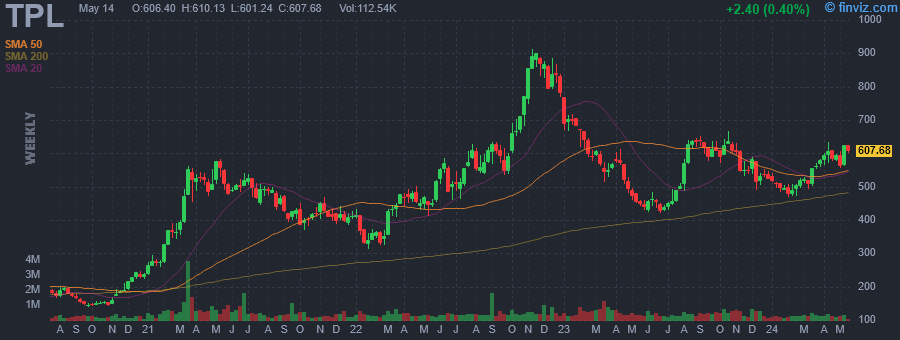
| Analyst Recom | 2.70 | Target Price | 660.71 |
| Avg Volume | 75.04K | 52W Range | 422.07 - 666.67 |
|
|
|
|
Texas Pacific Land Corporation engages in the land and resource management, and water services and operations businesses. The company owns a 1/128th nonparticipating perpetual oil and gas royalty interest (NPRI) under approximately 85,000 acres of land; a 1/16th NPRI under approximately 371,000 acres of land; and approximately 4,000 additional net royalty acres, total of approximately 195,000 NRA located in the western part of Texas. The Land and Resource Management segment manages surface acres of land, and oil and gas royalty interest in West Texas. This segment also engages in easements, such as transporting oil, gas and related hydrocarbons, power line and utility, and subsurface wellbore easements. In addition, this segment leases its land for processing, storage, and compression facilities and roads; and is involved in sale of materials, such as caliche, sand, and other material, as well as sells land. The Water Services and Operations segment provides full-service water offerings, including water sourcing, produced-water treatment, infrastructure development, and disposal solutions to operators in the Permian Basin. This segment also holds produced water royalties. Texas Pacific Land Corporation was founded in 1888 and is headquartered in Dallas, Texas. |
| Insider Trading |
Relationship |
Date |
Transaction |
Cost |
#Shares |
Value ($) |
#Shares Total |
SEC Form 4 |
| HORIZON KINETICS ASSET MANAGEM | 10% Owner | Apr 24 '24 | Buy | 589.01 | 3 | 1,767 | 1,084,953 | Apr 25 10:12 AM | | HORIZON KINETICS ASSET MANAGEM | 10% Owner | Apr 23 '24 | Buy | 587.81 | 3 | 1,763 | 1,084,950 | Apr 24 10:38 AM | | HORIZON KINETICS ASSET MANAGEM | 10% Owner | Apr 22 '24 | Buy | 585.81 | 3 | 1,757 | 1,084,947 | Apr 23 10:48 AM | | HORIZON KINETICS ASSET MANAGEM | 10% Owner | Apr 19 '24 | Buy | 582.60 | 3 | 1,748 | 1,084,944 | Apr 22 11:25 AM | | HORIZON KINETICS ASSET MANAGEM | 10% Owner | Apr 18 '24 | Buy | 582.40 | 3 | 1,747 | 1,084,941 | Apr 19 01:04 PM |
|
|
|
 |
| Market Cap | 3.61M | EPS (ttm) | -12.01 |
| P/E | - | EPS this Y | 76.49% |
| Forward P/E | - | EPS next Y | - |
| PEG | - | EPS past 5Y | - |
| P/S | 0.64 | EPS next 5Y | - |
| P/B | - | EPS Q/Q | 63.78% |
| Dividend | - | Sales Q/Q | -5.40% |
| Insider Own | 30.95% | Inst Own | 4.08% |
| Insider Trans | 388.58% | Inst Trans | - |
| Short Float | 4.01% | Earnings | Mar 26/a |
| Analyst Recom | 3.00 | Target Price | 3.00 |
| Avg Volume | 128.86K | 52W Range | 1.52 - 39.60 |
|
|
|
|
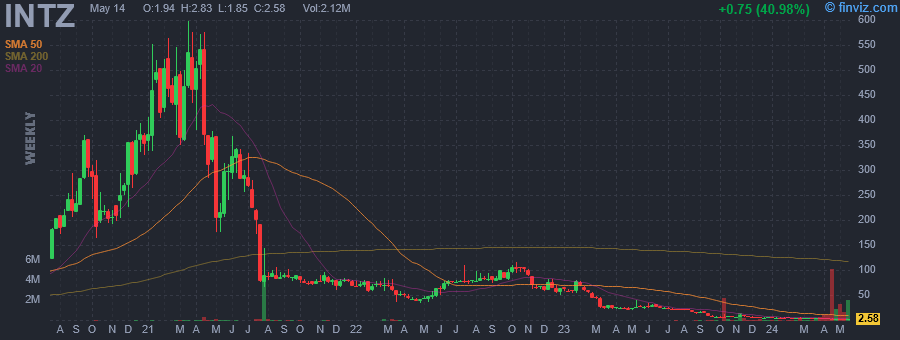
Intrusion, Inc. is a cybersecurity company, which offers customers access to its exclusive threat intelligence database containing the historical data, known associations, and reputational behavior of Internet Protocol addresses. Its solutions include INTRUSION Shield, INTRUSION TraceCop, and INTRUSION Savant. The company was founded by T. Joe Head and G. Ward Paxton in September 1983 and is headquartered in Plano, TX. |
| Insider Trading |
Relationship |
Date |
Transaction |
Cost |
#Shares |
Value ($) |
#Shares Total |
SEC Form 4 |
| Scott Anthony | Chief Executive Officer | Apr 22 '24 | Buy | 1.70 | 585,748 | 995,772 | 638,281 | Apr 25 08:11 AM | | PINSON KIMBERLY | Chief Financial Officer | Apr 22 '24 | Buy | 1.70 | 10,000 | 17,000 | 15,076 | Apr 25 08:10 AM | | LEVECCHIO ANTHONY J | Director | Apr 04 '24 | Option Exercise | 2.91 | 8,334 | 24,252 | 20,611 | Apr 04 06:46 PM | | Scott Anthony | Chief Executive Officer | Apr 02 '24 | Option Exercise | 2.91 | 33,334 | 97,002 | 52,533 | Apr 04 06:54 PM | | PINSON KIMBERLY | Chief Financial Officer | Apr 02 '24 | Option Exercise | 2.91 | 3,334 | 9,702 | 5,076 | Apr 04 06:51 PM |
|
|
| |
 |
| Market Cap | 71.82M | EPS (ttm) | -19.67 |
| P/E | - | EPS this Y | - |
| Forward P/E | - | EPS next Y | - |
| PEG | - | EPS past 5Y | 10.66% |
| P/S | 378.00 | EPS next 5Y | - |
| P/B | 5.44 | EPS Q/Q | 82.28% |
| Dividend | - | Sales Q/Q | -72.96% |
| Insider Own | 18.55% | Inst Own | 12.65% |
| Insider Trans | 17.09% | Inst Trans | -41.48% |
| Short Float | 3.65% | Earnings | Mar 20/a |
| Analyst Recom | - | Target Price | - |
| Avg Volume | 26.19K | 52W Range | 2.45 - 13.63 |
|
|
|
|
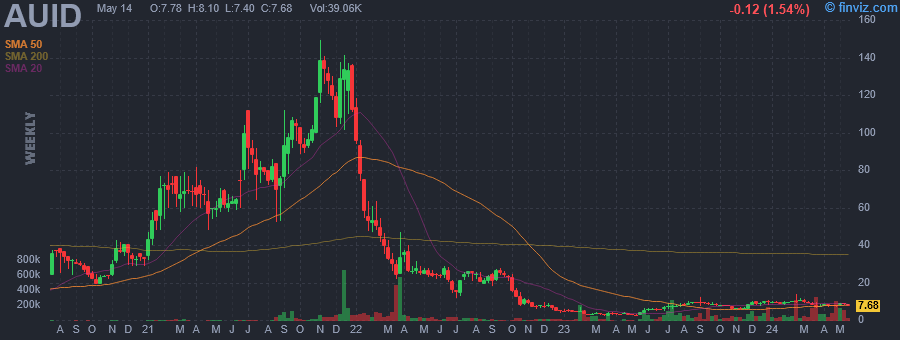
authID, Inc. engages in the delivery of secure, mobile, and biometric identity solutions. It operates through the Verified Authentication Business segment. The company was founded by Thomas R Snoke on September 21, 2011 and is headquartered in Denver, CO. |
| Insider Trading |
Relationship |
Date |
Transaction |
Cost |
#Shares |
Value ($) |
#Shares Total |
SEC Form 4 |
| Garchik Stephen Jeffrey | 10% Owner | Apr 23 '24 | Buy | 6.85 | 12,000 | 82,200 | 1,163,096 | Apr 25 08:00 AM | | Garchik Stephen Jeffrey | 10% Owner | Apr 12 '24 | Buy | 7.69 | 10,500 | 80,745 | 1,151,096 | Apr 15 05:15 PM | | Garchik Stephen Jeffrey | 10% Owner | Jan 31 '24 | Buy | 9.40 | 5,700 | 53,580 | 1,140,596 | Feb 01 07:00 PM | | Garchik Stephen Jeffrey | 10% Owner | Jan 30 '24 | Buy | 9.10 | 2,500 | 22,750 | 1,134,896 | Jan 30 08:25 PM | | Garchik Stephen Jeffrey | 10% Owner | Jan 25 '24 | Buy | 9.40 | 1,000 | 9,400 | 1,132,396 | Jan 26 06:08 AM |
|
|
|
 |
| Market Cap | 119.10M | EPS (ttm) | 2.60 |
| P/E | 6.02 | EPS this Y | -59.54% |
| Forward P/E | 10.79 | EPS next Y | 10.27% |
| PEG | - | EPS past 5Y | 18.59% |
| P/S | 0.91 | EPS next 5Y | - |
| P/B | 0.61 | EPS Q/Q | -64.11% |
| Dividend | 2.56% | Sales Q/Q | 12.20% |
| Insider Own | 9.75% | Inst Own | 55.25% |
| Insider Trans | 0.45% | Inst Trans | -2.06% |
| Short Float | 2.14% | Earnings | Apr 22/b |
| Analyst Recom | 2.00 | Target Price | 22.25 |
| Avg Volume | 23.38K | 52W Range | 15.20 - 25.97 |
|
|
|
|
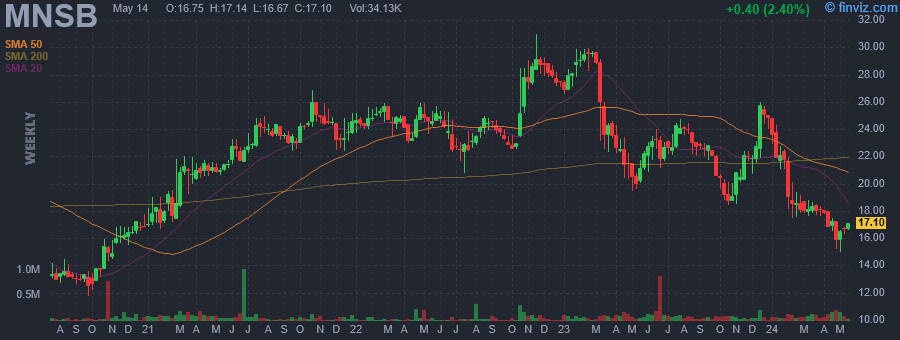
MainStreet Bancshares, Inc. is a holding company, which engages in the provision of banking solutions through MainStreet Bank. It offers products and services such as checking, deposits, loans, credit cards, mortgages, and savings. The company was founded on March 28, 2003 and is headquartered in Fairfax, VA. |
| Insider Trading |
Relationship |
Date |
Transaction |
Cost |
#Shares |
Value ($) |
#Shares Total |
SEC Form 4 |
| Brockett Charles C. | Director | Apr 24 '24 | Buy | 16.40 | 710 | 11,644 | 92,318 | Apr 25 07:35 AM | | Brockett Charles C. | Director | Apr 24 '24 | Buy | 16.40 | 450 | 7,380 | 852 | Apr 25 07:35 AM | | Vari Richard Alexander | Chief Accounting Officer | Apr 24 '24 | Buy | 16.05 | 310 | 4,976 | 15,739 | Apr 24 11:07 AM | | Brockett Charles C. | Director | Mar 01 '24 | Buy | 18.36 | 19 | 349 | 402 | Mar 01 03:55 PM | | DICK JEFF W | Chairman, President and CEO | Feb 29 '24 | Buy | 18.00 | 675 | 12,150 | 190,077 | Mar 01 09:36 AM |
|
|
| |
 |
| Market Cap | 3.36B | EPS (ttm) | -5.67 |
| P/E | - | EPS this Y | -10.17% |
| Forward P/E | - | EPS next Y | 7.57% |
| PEG | - | EPS past 5Y | - |
| P/S | - | EPS next 5Y | - |
| P/B | 7.28 | EPS Q/Q | 38.59% |
| Dividend | - | Sales Q/Q | - |
| Insider Own | 14.19% | Inst Own | 82.88% |
| Insider Trans | 3.16% | Inst Trans | 495.97% |
| Short Float | 11.42% | Earnings | Feb 29/a |
| Analyst Recom | 1.09 | Target Price | 59.33 |
| Avg Volume | 1.28M | 52W Range | 12.35 - 62.21 |
|
|
|
|
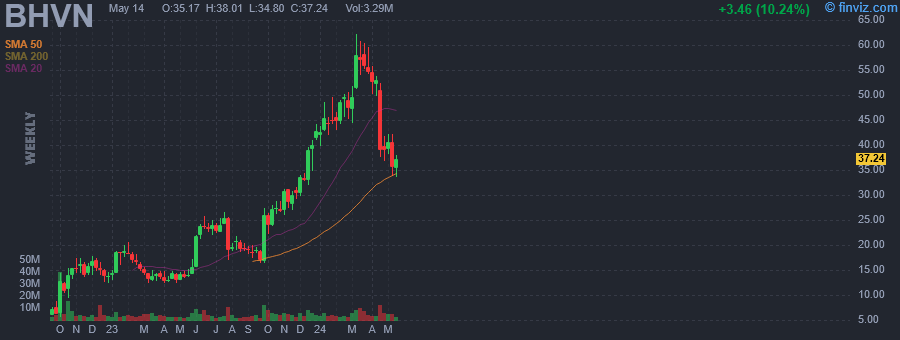
Biohaven Ltd. is a global clinical stage biopharmaceutical company, which engages in the discovery, development, and commercialization of therapies for people with neurological and neuropsychiatric diseases. The company was founded on May 2, 2022 and is headquartered in New Haven, CT. |
| Insider Trading |
Relationship |
Date |
Transaction |
Cost |
#Shares |
Value ($) |
#Shares Total |
SEC Form 4 |
| Bailey Gregory | Director | Apr 24 '24 | Buy | 39.18 | 25,503 | 999,169 | 1,600,071 | Apr 25 07:32 AM | | CHILDS JOHN W | Director | Apr 22 '24 | Buy | 41.00 | 195,121 | 7,999,961 | 4,096,512 | Apr 23 07:54 AM | | Coric Vlad | Chief Executive Officer | Apr 22 '24 | Buy | 41.00 | 121,951 | 4,999,991 | 1,788,417 | Apr 23 07:54 AM | | Bailey Gregory | Director | Apr 22 '24 | Buy | 41.00 | 48,780 | 1,999,980 | 1,574,568 | Apr 23 07:54 AM | | Antonijevic Irina | Director | Dec 29 '23 | Option Exercise | 0.00 | 11,000 | 0 | 13,535 | Dec 29 06:25 PM |
|
|
|
 |
| Market Cap | 17.93B | EPS (ttm) | 1.85 |
| P/E | 10.54 | EPS this Y | -13.57% |
| Forward P/E | 8.87 | EPS next Y | 13.59% |
| PEG | - | EPS past 5Y | 6.49% |
| P/S | 1.94 | EPS next 5Y | -0.88% |
| P/B | 1.16 | EPS Q/Q | -40.72% |
| Dividend | 4.93% | Sales Q/Q | 5.04% |
| Insider Own | 0.29% | Inst Own | 81.23% |
| Insider Trans | 0.81% | Inst Trans | 0.74% |
| Short Float | 3.31% | Earnings | Apr 19/b |
| Analyst Recom | 2.46 | Target Price | 21.59 |
| Avg Volume | 8.76M | 52W Range | 13.72 - 21.08 |
|
|
|
|
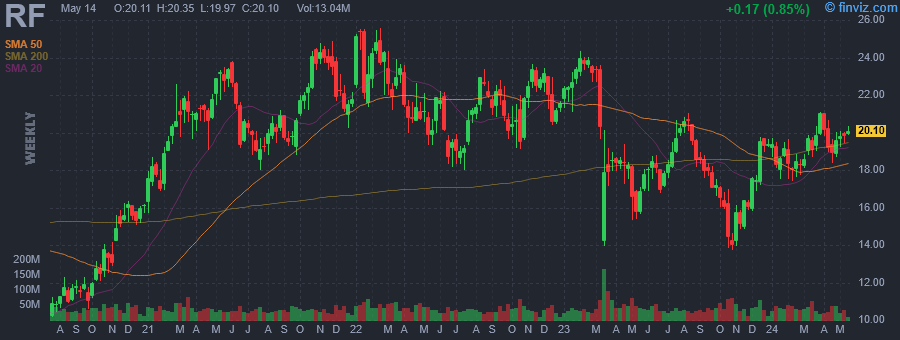
Regions Financial Corp. operates as a bank holding company. It provides traditional commercial, retail and mortgage banking services, as well as other financial services in the fields of investment banking, asset management, trust, mutual funds, securities brokerage, insurance and other financing. The firm operates through the following segments: Corporate Bank, Consumer Bank, Wealth Management, and Other. The Corporate Bank segment represents the commercial banking functions including commercial and industrial, commercial real estate and investor real estate lending. The Consumer Bank segment holds the branch network, including consumer banking products and services related to residential first mortgages, home equity lines and loans, small business loans, indirect loans, consumer credit cards and other consumer loans. The Wealth Management segment offers individuals, businesses, governmental institutions and non-profit entities a range of solutions to help protect, grow and transfer wealth. The Other segment includes the company's treasury function, the securities portfolio, wholesale funding activities, interest rate risk management activities and other corporate functions that are not related to a strategic business unit. The company was founded in 1971 and is headquartered in Birmingham, AL. |
| Insider Trading |
Relationship |
Date |
Transaction |
Cost |
#Shares |
Value ($) |
#Shares Total |
SEC Form 4 |
| RHODES WILLIAM C III | Director | Apr 23 '24 | Buy | 19.37 | 50,000 | 968,500 | 50,000 | Apr 24 07:48 PM | | RHODES WILLIAM C III | Director | Apr 17 '24 | Option Exercise | 0.00 | 1,179 | 0 | 1,279 | Apr 19 04:50 PM | | Rand Alison S. | Director | Apr 17 '24 | Option Exercise | 0.00 | 4,700 | 0 | 4,800 | Apr 19 04:50 PM | | JOHNSON JOIA M | Director | Apr 17 '24 | Option Exercise | 0.00 | 7,460 | 0 | 12,736 | Apr 19 04:50 PM | | Hill J Thomas | Director | Apr 17 '24 | Option Exercise | 0.00 | 7,460 | 0 | 30,567 | Apr 19 04:50 PM |
|
|
|
 |
| Market Cap | 156.49M | EPS (ttm) | -4.39 |
| P/E | - | EPS this Y | 50.56% |
| Forward P/E | - | EPS next Y | -13.87% |
| PEG | - | EPS past 5Y | - |
| P/S | - | EPS next 5Y | - |
| P/B | 2.64 | EPS Q/Q | -641.35% |
| Dividend | - | Sales Q/Q | - |
| Insider Own | 56.64% | Inst Own | 47.93% |
| Insider Trans | -2.54% | Inst Trans | 2.60% |
| Short Float | 2.27% | Earnings | Mar 28/b |
| Analyst Recom | 1.00 | Target Price | 19.33 |
| Avg Volume | 292.38K | 52W Range | 2.00 - 14.00 |
|
|
|
|
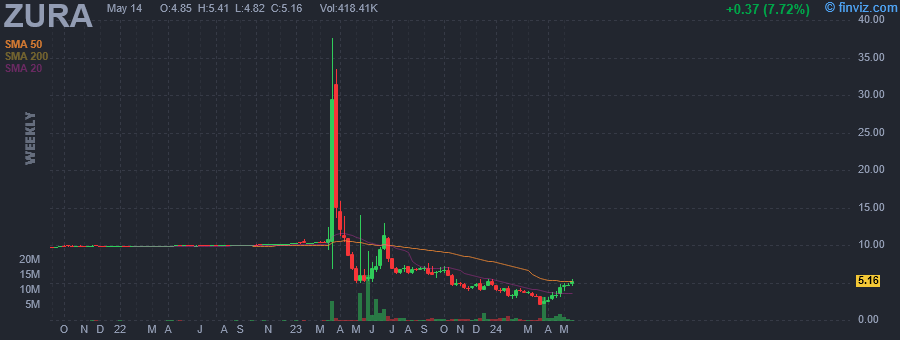
Zura Bio Ltd. is a clinical-stage biotechnology company that engages in the development of novel medicines for immune disorders. It focuses on the development of ZB-168, a treatment for Alopecia Areata and other inflammatory diseases. The company was founded by Someit Sidhu on January 18, 2022 and is headquartered in Henderson, NV. |
| Insider Trading |
Relationship |
Date |
Transaction |
Cost |
#Shares |
Value ($) |
#Shares Total |
SEC Form 4 |
| Sidhu Someit | Director | Apr 22 '24 | Buy | 3.13 | 1,186,901 | 3,715,000 | 1,186,901 | Apr 24 06:51 PM | | Munshi Amit | Director | Apr 22 '24 | Buy | 3.13 | 159,744 | 499,999 | 777,384 | Apr 24 06:52 PM | | Howell Michael | See Remarks | Apr 22 '24 | Buy | 3.13 | 7,987 | 24,999 | 7,987 | Apr 24 06:54 PM | | Nistala Kiran | Executive Vice President | Apr 22 '24 | Buy | 3.13 | 3,195 | 10,000 | 3,195 | Apr 24 06:53 PM | | Thiara Parvinder | Director | Dec 12 '23 | Sale | 4.00 | 2,000,000 | 8,000,000 | 4,801,633 | Dec 14 03:35 PM |
|
|
|
