 |
| Market Cap | 436.12M | EPS (ttm) | -0.66 |
| P/E | - | EPS this Y | - |
| Forward P/E | - | EPS next Y | - |
| PEG | - | EPS past 5Y | - |
| P/S | - | EPS next 5Y | - |
| P/B | - | EPS Q/Q | - |
| Dividend | 9.07% | Sales Q/Q | - |
| Insider Own | - | Inst Own | 40.44% |
| Insider Trans | - | Inst Trans | - |
| Short Float | 0.18% | Earnings | - |
| Analyst Recom | - | Target Price | - |
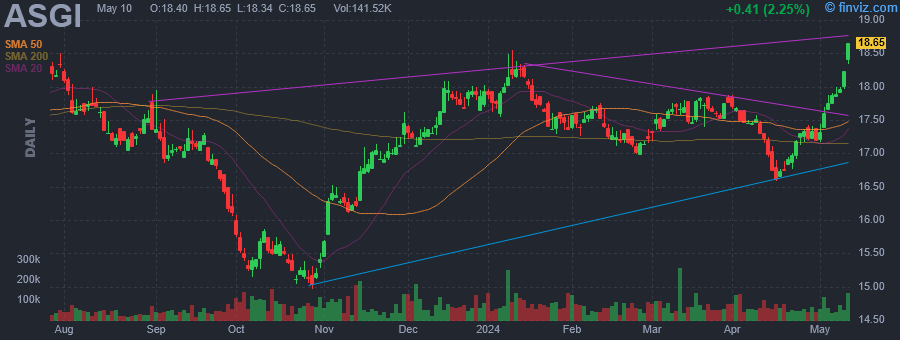
| Avg Volume | 75.82K | 52W Range | 14.96 - 18.55 |
|
|
|
|
Abrdn Global Infrastructure Income Fund seeks investment results that correspond generally to the price and yield performance, before fees and expenses, of the Northern Trust Real Assets Allocation IndexSM.Under normal circumstances, the fund will invest at least 80% of its total assets (exclusive of collateral held from securities lending) in the securities of the underlying index. The underlying index measures the performance of an optimized allocation to the underlying funds that is intended to provide exposures to certain real assets and minimize overall volatility of investment in the underlying funds. |
| Insider Trading |
Relationship |
Date |
Transaction |
Cost |
#Shares |
Value ($) |
#Shares Total |
SEC Form 4 |
| Saba Capital Management, L.P. | 10% Owner | Apr 23 '24 | Buy | 17.11 | 13,691 | 234,253 | 2,762,755 | Apr 23 07:56 PM | | Saba Capital Management, L.P. | 10% Owner | Apr 22 '24 | Buy | 16.89 | 6,129 | 103,519 | 2,749,064 | Apr 23 07:56 PM | | Goodson Alan R | Director of Adviser | Apr 18 '24 | Buy | 16.83 | 3,881 | 65,317 | 3,881 | Apr 19 07:41 AM | | Saba Capital Management, L.P. | 10% Owner | Apr 15 '24 | Buy | 17.01 | 2,281 | 38,800 | 2,742,927 | Apr 15 05:11 PM | | Saba Capital Management, L.P. | 10% Owner | Apr 11 '24 | Buy | 17.24 | 31,504 | 543,129 | 2,740,646 | Apr 12 02:58 PM |
|
|
 |
 |
| Market Cap | 40.46M | EPS (ttm) | -0.56 |
| P/E | - | EPS this Y | 53.28% |
| Forward P/E | 48.67 | EPS next Y | 105.26% |
| PEG | - | EPS past 5Y | 8.70% |
| P/S | 0.68 | EPS next 5Y | - |
| P/B | 2.23 | EPS Q/Q | 74.23% |
| Dividend | - | Sales Q/Q | -15.11% |
| Insider Own | 57.85% | Inst Own | 11.65% |
| Insider Trans | 1.06% | Inst Trans | -6.28% |
| Short Float | 2.50% | Earnings | Nov 30/b |
| Analyst Recom | - | Target Price | - |
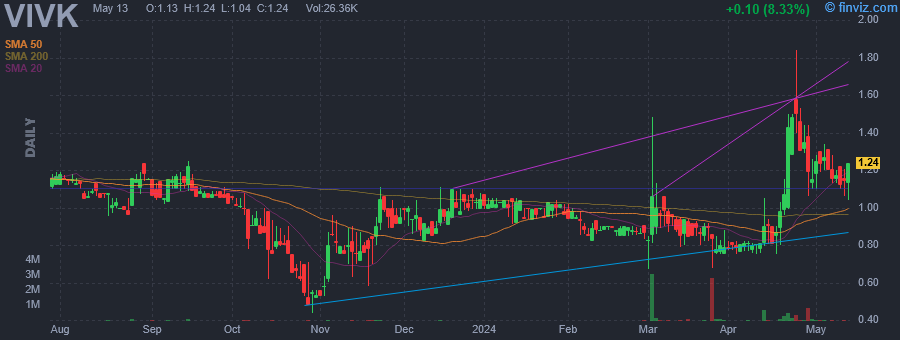
| Avg Volume | 151.74K | 52W Range | 0.44 - 1.50 |
|
|
|
|
Vivakor, Inc. engages in the operation, acquisition, and development of clean energy technologies and environmental solutions that focus on soil remediation. It specializes in the remediation of soil and the extraction of hydrocarbons, such as oil, from properties contaminated by or laden with heavy crude oil and other hydrocarbon-based substances. The company focuses on the remediation of contaminated soil and water resulting from either man-made spills or naturally occurring deposits of oil. Its primary focus is remediation of oil spills resulting from the Iraqi invasion of Kuwait and naturally occurring oil sands deposits in the Uinta basin located in Eastern Utah. The company was founded on November 1, 2006 and is headquartered in Dallas, TX. |
| Insider Trading |
Relationship |
Date |
Transaction |
Cost |
#Shares |
Value ($) |
#Shares Total |
SEC Form 4 |
| Ballengee James H. | Chief Executive Officer | Apr 22 '24 | Buy | 1.37 | 138,000 | 189,060 | 1,191,672 | Apr 23 07:39 PM | | Ballengee James H. | Chief Executive Officer | Apr 19 '24 | Buy | 1.12 | 30,000 | 33,600 | 1,053,672 | Apr 23 07:39 PM |
|
|
|
 |
| Market Cap | 346.95M | EPS (ttm) | 1.41 |
| P/E | 15.92 | EPS this Y | -10.34% |
| Forward P/E | 11.50 | EPS next Y | 49.85% |
| PEG | 0.53 | EPS past 5Y | - |
| P/S | 0.50 | EPS next 5Y | 30.00% |
| P/B | 1.60 | EPS Q/Q | 7.62% |
| Dividend | - | Sales Q/Q | 4.88% |
| Insider Own | 13.12% | Inst Own | 91.71% |
| Insider Trans | 8.70% | Inst Trans | -5.63% |
| Short Float | 30.93% | Earnings | Apr 11/b |
| Analyst Recom | 1.00 | Target Price | 31.20 |
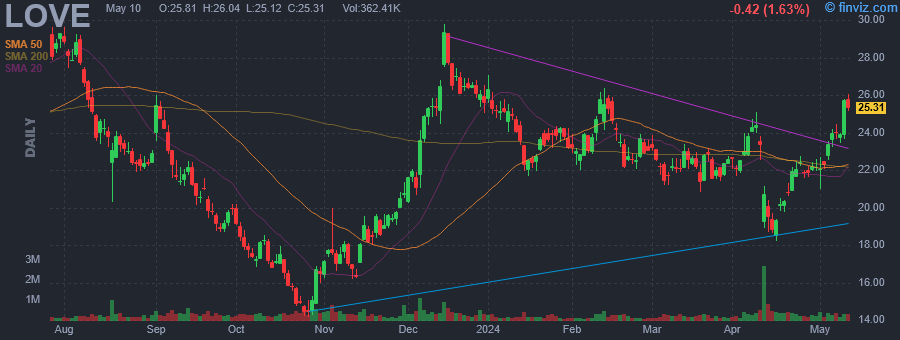
| Avg Volume | 312.61K | 52W Range | 14.18 - 29.81 |
|
|
|
|
The Lovesac Co. is a technology driven, omni-channel company. It designs, manufactures, and sells furniture comprised of modular couches called sactionals and foam beanbag chairs called sacs. Its products include sactionals, sacs, and accessories. The company was founded by Shawn David Nelson in 1995 and is headquartered in Stamford, CT. |
| Insider Trading |
Relationship |
Date |
Transaction |
Cost |
#Shares |
Value ($) |
#Shares Total |
SEC Form 4 |
| Siegner Keith R. | EVP and CFO | Apr 19 '24 | Buy | 20.80 | 4,800 | 99,864 | 4,800 | Apr 23 06:13 PM | | HEYER ANDREW R | Director | Apr 17 '24 | Buy | 20.23 | 8,144 | 164,755 | 37,282 | Apr 18 08:51 PM | | HEYER ANDREW R | Director | Apr 17 '24 | Buy | 20.23 | 6,226 | 125,952 | 241,518 | Apr 18 08:51 PM | | HEYER ANDREW R | Director | Apr 16 '24 | Buy | 18.76 | 3,856 | 72,330 | 3,856 | Apr 18 08:51 PM | | HEYER ANDREW R | Director | Apr 16 '24 | Buy | 18.74 | 3,774 | 70,709 | 235,292 | Apr 18 08:51 PM |
|
|
| |
 |
| Market Cap | 189.25M | EPS (ttm) | -1.47 |
| P/E | - | EPS this Y | 25.59% |
| Forward P/E | 189.94 | EPS next Y | 112.25% |
| PEG | - | EPS past 5Y | - |
| P/S | 0.25 | EPS next 5Y | 25.00% |
| P/B | 1.20 | EPS Q/Q | -47.93% |
| Dividend | - | Sales Q/Q | 2.73% |
| Insider Own | 4.51% | Inst Own | 102.20% |
| Insider Trans | 235.94% | Inst Trans | -9.66% |
| Short Float | 13.80% | Earnings | Mar 19/b |
| Analyst Recom | 2.00 | Target Price | 30.75 |
| Avg Volume | 78.34K | 52W Range | 14.20 - 32.90 |
|
|
|
Today 01:48PM
|
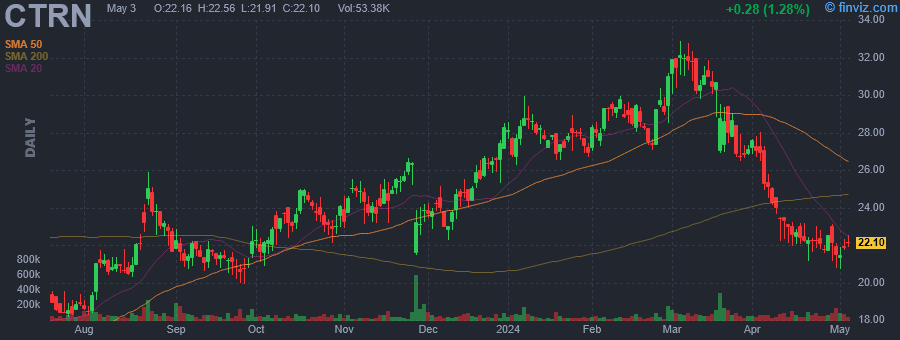
Hedge Fund and Insider Trading News: Bill Ackman, Appaloosa Management, Marshall Wace LLP, Centuri Holdings Inc (CTRI), Citi Trends, Inc. (CTRN), and More
(Insider Monkey) |
|
Mar-20-24 10:34AM
|
Citi Trends, Inc. (NASDAQ:CTRN) Q4 2023 Earnings Call Transcript
(Insider Monkey) |
|
Mar-19-24 11:23PM
|
Q4 2023 Citi Trends Inc Earnings Call
(Thomson Reuters StreetEvents) -6.32% |
|
03:45PM
|
Citi Trends (CTRN) Q4 2023 Earnings Call Transcript
(Motley Fool) |
|
10:52AM
|
CTRN Stock Earnings: Citi Trends Misses EPS, Misses Revenue for Q4 2023
(InvestorPlace) |
|
08:31AM
|
Citi Trends Inc (CTRN) Reports Mixed Fiscal 2023 Results Amidst Economic Challenges
(GuruFocus.com) |
|
07:02AM
|
Citi Trends: Fiscal Q4 Earnings Snapshot
(Associated Press Finance) |
|
06:45AM
|
Citi Trends Announces Fourth Quarter and Fiscal 2023 Results
(Business Wire) |
|
Mar-08-24 07:33PM
|
Peabody Energy, Citi Trends, and More Stocks See Action From Activist Investors
(Barrons.com) |
|
Mar-05-24 01:38PM
|
Hedge Fund and Insider Trading News: Chase Coleman, Crispin Odey, D.E. Shaw, Balyasny Asset Management, Devon Energy Corp (DVN), Citi Trends, Inc. (CTRN), and More
(Insider Monkey) |
|
Citi Trends, Inc. engages in the retail of urban fashion apparel, accessories, and home trends. It offers products under its Citi Steps and Red Ape brands. The company was founded in 1946 and is headquartered in Savannah, GA. |
| Insider Trading |
Relationship |
Date |
Transaction |
Cost |
#Shares |
Value ($) |
#Shares Total |
SEC Form 4 |
| Fund 1 Investments, LLC | 10% Owner | Apr 23 '24 | Buy | 22.30 | 29,000 | 646,639 | 1,864,367 | Apr 23 05:56 PM | | Fund 1 Investments, LLC | 10% Owner | Apr 22 '24 | Buy | 21.74 | 23,495 | 510,817 | 1,835,367 | Apr 23 05:56 PM | | Fund 1 Investments, LLC | 10% Owner | Apr 19 '24 | Buy | 22.15 | 13,000 | 287,912 | 1,811,872 | Apr 23 05:56 PM | | Fund 1 Investments, LLC | 10% Owner | Apr 17 '24 | Buy | 22.41 | 18,090 | 405,359 | 1,798,872 | Apr 17 05:48 PM | | Fund 1 Investments, LLC | 10% Owner | Apr 16 '24 | Buy | 22.58 | 12,000 | 271,013 | 1,780,782 | Apr 17 05:48 PM |
|
|
|
 |
| Market Cap | 93.34M | EPS (ttm) | -3.22 |
| P/E | - | EPS this Y | 81.51% |
| Forward P/E | 19.74 | EPS next Y | 116.52% |
| PEG | - | EPS past 5Y | - |
| P/S | 0.08 | EPS next 5Y | 23.00% |
| P/B | 0.21 | EPS Q/Q | 197.87% |
| Dividend | - | Sales Q/Q | 9.32% |
| Insider Own | 49.03% | Inst Own | 27.79% |
| Insider Trans | 0.09% | Inst Trans | -9.19% |
| Short Float | 12.73% | Earnings | Apr 11/b |
| Analyst Recom | 1.00 | Target Price | 5.50 |
| Avg Volume | 138.38K | 52W Range | 2.55 - 5.26 |
|
|
|
|
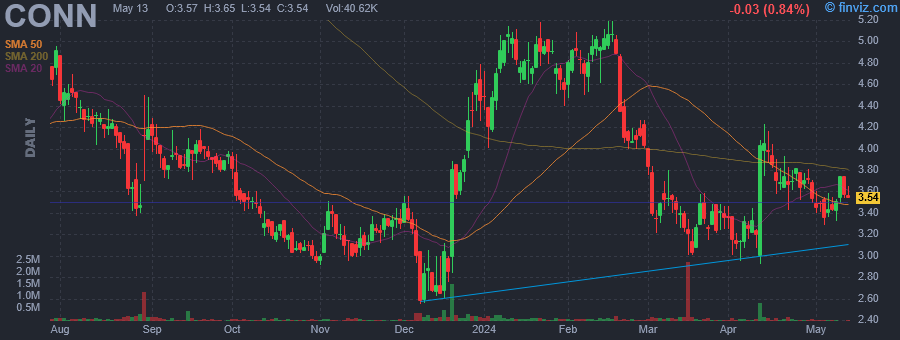
Conn's, Inc. is a holding company, which engages in the retail and provision of home goods and related services. Its products include furniture, appliances, and consumer electronics. It operates through the Retail and Credit segments. The Retail segment sells home appliances to the retail market, and owns and operates retail stores that offer furniture, home appliances, consumer electronics, and home office accessories. The Credit segment provides in-house consumer credit programs that offer standardized credit decisions, including down payment, limit amounts, and credit terms. The company was founded by Edward Eastham in 1890 and is headquartered in The Woodlands, TX. |
| Insider Trading |
Relationship |
Date |
Transaction |
Cost |
#Shares |
Value ($) |
#Shares Total |
SEC Form 4 |
| MARTIN DOUGLAS H | Director | Apr 23 '24 | Buy | 3.71 | 4,817 | 17,863 | 57,894 | Apr 23 05:27 PM | | MARTIN DOUGLAS H | Director | Apr 22 '24 | Buy | 3.70 | 4,000 | 14,800 | 53,077 | Apr 23 05:27 PM | | MARTIN DOUGLAS H | Director | Apr 19 '24 | Buy | 3.72 | 2,000 | 7,440 | 49,077 | Apr 23 05:27 PM | | Stephens Group, LLC | 10% Owner | Jul 19 '23 | Sale | 5.02 | 12,777 | 64,128 | 4,217,873 | Jul 20 05:27 PM |
|
|
| |
 |
| Market Cap | 519.09M | EPS (ttm) | -63.36 |
| P/E | - | EPS this Y | 82.75% |
| Forward P/E | - | EPS next Y | 3.18% |
| PEG | - | EPS past 5Y | -11.67% |
| P/S | - | EPS next 5Y | - |
| P/B | 3.05 | EPS Q/Q | 80.13% |
| Dividend | - | Sales Q/Q | - |
| Insider Own | 35.06% | Inst Own | 49.92% |
| Insider Trans | 0.56% | Inst Trans | -31.27% |
| Short Float | 2.08% | Earnings | Mar 26/a |
| Analyst Recom | 1.00 | Target Price | 130.00 |
| Avg Volume | 32.38K | 52W Range | 4.57 - 97.91 |
|
|
|
|
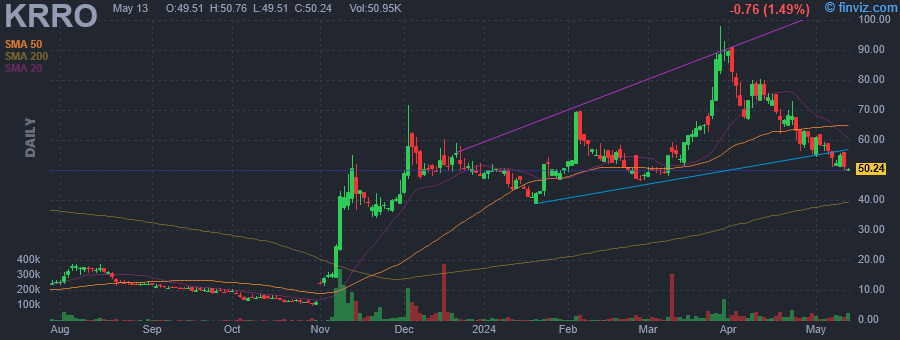
Korro Bio, Inc. is an RNA editing company, which engages in the discovery and development of genetic medicines. The company was founded by Nessan Bermingham, Jean-Francois Formela, Joshua Rosenthal, and Andrew Fraley in 2018 and is headquartered in Cambridge, MA. |
| Insider Trading |
Relationship |
Date |
Transaction |
Cost |
#Shares |
Value ($) |
#Shares Total |
SEC Form 4 |
| Atlas Venture Opportunity Fund | 10% Owner | Apr 22 '24 | Buy | 56.00 | 17,857 | 999,992 | 195,074 | Apr 23 05:23 PM | | Lucchino David L. | Director | Nov 22 '23 | Sale | 37.69 | 1,156 | 43,573 | 22,150 | Nov 27 08:48 PM | | Lucchino David L. | Director | Nov 10 '23 | Sale | 41.97 | 968 | 40,632 | 23,306 | Nov 22 04:05 PM | | Lucchino David L. | President and CEO | Aug 18 '23 | Sale | 0.60 | 2,865 | 1,719 | 636,801 | Aug 22 04:19 PM | | Mitrano Richard J. | VP Finance & Operations | Aug 18 '23 | Sale | 0.63 | 227 | 143 | 48,694 | Aug 22 04:21 PM |
|
|
|
 |
| Market Cap | 142.04M | EPS (ttm) | 0.18 |
| P/E | 56.91 | EPS this Y | -93.53% |
| Forward P/E | 20.19 | EPS next Y | 455.56% |
| PEG | 2.85 | EPS past 5Y | 34.54% |
| P/S | 0.68 | EPS next 5Y | 20.00% |
| P/B | 0.90 | EPS Q/Q | -87.98% |
| Dividend | 2.38% | Sales Q/Q | -25.57% |
| Insider Own | 15.71% | Inst Own | 57.89% |
| Insider Trans | 0.91% | Inst Trans | 23.10% |
| Short Float | 6.19% | Earnings | Apr 10/a |
| Analyst Recom | 5.00 | Target Price | 20.00 |
| Avg Volume | 143.71K | 52W Range | 8.08 - 19.58 |
|
|
|
|
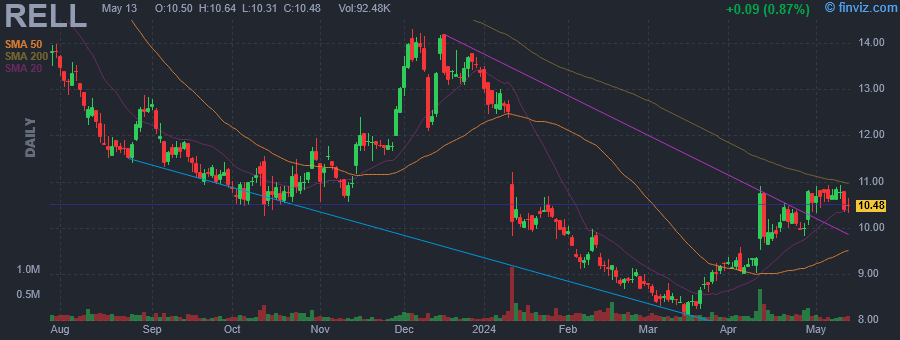
Richardson Electronics Ltd. engages in the provision of engineered solutions. It operates through the following segments: Power and Microwave Technologies Group (PMT), Green Energy Solutions GES), Canvys, and Healthcare. The PMT segment provides engineering solutions capabilities, power grid, and microwave tube business. The GES segment focuses on products for numerous green energy applications. The Canvys segment offers customized display solutions serving the corporate enterprise, financial, healthcare, industrial, and medical original equipment manufacturers markets. The Healthcare segment manufactures, refurbishes, and distributes replacement parts for the healthcare market including hospitals, medical centers, asset management companies, independent service organizations, and multi-vendor service providers. The company was founded on May 31, 1947 and is headquartered in LaFox, IL. |
| Insider Trading |
Relationship |
Date |
Transaction |
Cost |
#Shares |
Value ($) |
#Shares Total |
SEC Form 4 |
| Halverson Kenneth | Director | Apr 22 '24 | Buy | 10.05 | 2,500 | 25,122 | 5,000 | Apr 23 03:50 PM | | PLANTE PAUL J | Director | Apr 17 '24 | Buy | 9.96 | 5,000 | 49,800 | 5,000 | Apr 18 09:07 AM | | Benham James | Director | Apr 16 '24 | Buy | 10.01 | 2,500 | 25,031 | 5,000 | Apr 18 09:03 AM | | Benham James | Director | Jan 30 '24 | Buy | 9.99 | 2,500 | 24,975 | 2,500 | Feb 01 09:21 AM | | Halverson Kenneth | Director | Jan 29 '24 | Buy | 10.06 | 2,500 | 25,162 | 2,500 | Jan 31 09:06 AM |
|
|
| |
 |
| Market Cap | 121.46M | EPS (ttm) | 1.94 |
| P/E | 8.66 | EPS this Y | - |
| Forward P/E | - | EPS next Y | - |
| PEG | - | EPS past 5Y | 1.51% |
| P/S | 0.91 | EPS next 5Y | - |
| P/B | 0.66 | EPS Q/Q | 27.17% |
| Dividend | 2.38% | Sales Q/Q | 34.28% |
| Insider Own | 40.07% | Inst Own | 15.00% |
| Insider Trans | 0.19% | Inst Trans | 4.02% |
| Short Float | 0.10% | Earnings | Apr 17/b |
| Analyst Recom | 1.00 | Target Price | 18.50 |
| Avg Volume | 6.03K | 52W Range | 13.62 - 18.91 |
|
|
|
|
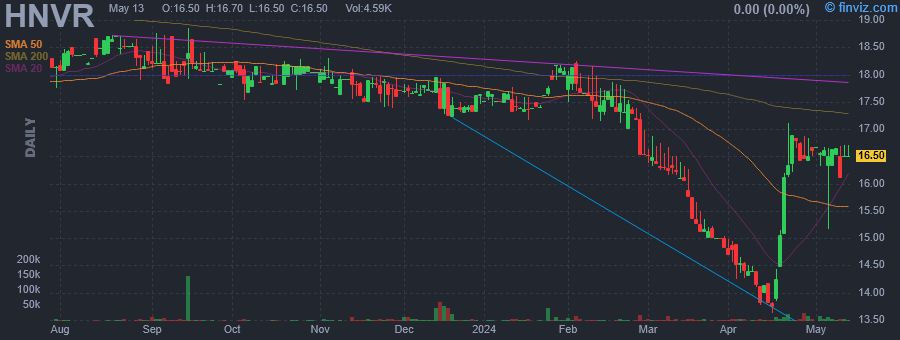
Hanover Bancorp, Inc. is a bank holding company, which engages in the provision of financial services and commercial banking products and services. It also offers multi-family and commercial mortgages, residential loans, business loans, and lines of credit. The company was founded on November 4, 2008 and is headquartered in New York, NY. |
| Insider Trading |
Relationship |
Date |
Transaction |
Cost |
#Shares |
Value ($) |
#Shares Total |
SEC Form 4 |
| Sisti Elena | Director | Apr 22 '24 | Buy | 16.95 | 2,000 | 33,900 | 101,878 | Apr 23 01:59 PM | | Wilcox McClelland W | President | Apr 22 '24 | Buy | 16.91 | 200 | 3,382 | 81,287 | Apr 23 12:30 PM | | PUORRO MICHAEL P | Chairman & CEO | Apr 22 '24 | Buy | 16.58 | 200 | 3,316 | 277,488 | Apr 23 12:28 PM | | Katz Michael David M.D. | Director | Apr 09 '24 | Option Exercise | 10.00 | 7,057 | 70,570 | 154,279 | Apr 09 01:55 PM | | Okun Philip A | Director | Mar 05 '24 | Option Exercise | 10.00 | 8,139 | 81,390 | 42,584 | Mar 05 01:56 PM |
|
|
|
 |
| Market Cap | 4.89B | EPS (ttm) | 1.24 |
| P/E | 11.02 | EPS this Y | -10.08% |
| Forward P/E | 8.81 | EPS next Y | 9.46% |
| PEG | 1.10 | EPS past 5Y | 3.24% |
| P/S | 2.08 | EPS next 5Y | 10.00% |
| P/B | 0.81 | EPS Q/Q | -19.46% |
| Dividend | 3.53% | Sales Q/Q | 20.72% |
| Insider Own | 1.32% | Inst Own | 79.72% |
| Insider Trans | 0.14% | Inst Trans | 1.26% |
| Short Float | 2.97% | Earnings | Apr 17/a |
| Analyst Recom | 1.56 | Target Price | 15.78 |
| Avg Volume | 2.19M | 52W Range | 10.09 - 14.19 |
|
|
|
|
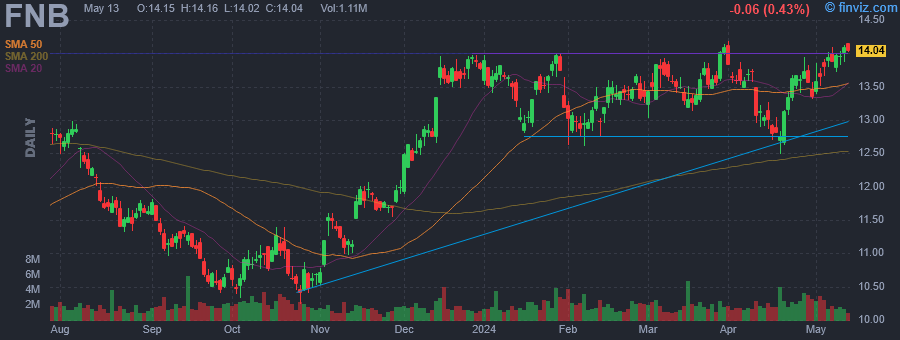
F.N.B. Corp. is a financial holding company, which engages in the provision of financial services to consumers, corporations, governments, and small to medium-sized businesses. It operates through the following segments: Community Banking, Wealth Management, Insurance, and Other. The Community Banking segment includes commercial and consumer banking services. The Wealth Management segment delivers wealth management services to individuals, corporations and retirement funds, as well as existing customers of community banking. The Insurance segment is a full-service insurance brokerage agency offering lines of commercial and personal insurance through major carriers. The Other segment offers mezzanine financing options for small to medium-sized businesses that need financial assistance beyond the parameters of typical commercial bank lending products. The company was founded in 1974 and is headquartered in Pittsburgh, PA. |
| Insider Trading |
Relationship |
Date |
Transaction |
Cost |
#Shares |
Value ($) |
#Shares Total |
SEC Form 4 |
| CAMPBELL WILLIAM B | Director | Apr 23 '24 | Buy | 13.48 | 2,500 | 33,712 | 149,458 | Apr 23 01:24 PM | | CAMPBELL WILLIAM B | Director | Feb 28 '24 | Buy | 13.52 | 1,500 | 20,274 | 146,888 | Feb 28 04:28 PM | | CAMPBELL WILLIAM B | Director | Feb 26 '24 | Buy | 13.41 | 2,500 | 33,522 | 145,388 | Feb 26 02:05 PM |
|
|
|
 |
| Market Cap | 85.12M | EPS (ttm) | -0.79 |
| P/E | - | EPS this Y | 31.65% |
| Forward P/E | - | EPS next Y | -9.26% |
| PEG | - | EPS past 5Y | 1.93% |
| P/S | 7.02 | EPS next 5Y | 20.00% |
| P/B | 1.05 | EPS Q/Q | -80.81% |
| Dividend | - | Sales Q/Q | -63.19% |
| Insider Own | 7.46% | Inst Own | 37.79% |
| Insider Trans | 1.04% | Inst Trans | -1.34% |
| Short Float | 16.77% | Earnings | Apr 15/a |
| Analyst Recom | 2.33 | Target Price | 3.00 |
| Avg Volume | 734.34K | 52W Range | 1.10 - 6.06 |
|
|
|
|
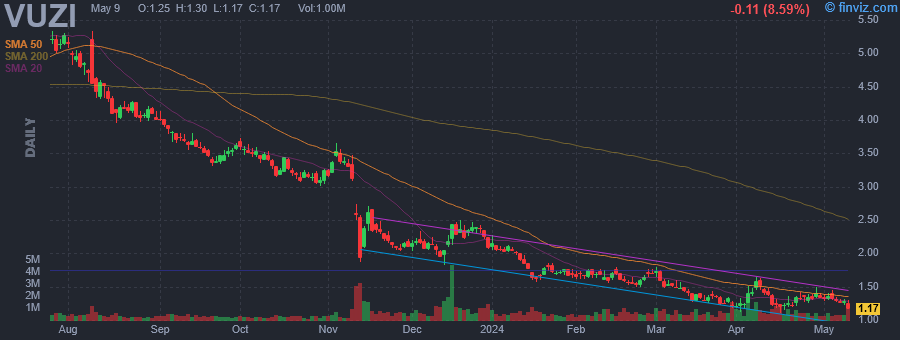
Vuzix Corp. is a supplier of Smart-Glasses and Augmented Reality technologies and products for the consumer and enterprise markets. Its products include personal display and wearable computing devices that offer users a portable viewing experience, provide solutions for mobility, wearable displays and augmented reality. The firm also holds 246 patents and patents pending and numerous IP licenses in the Video Eyewear field. It has offices in Rochester, NY, Oxford, UK, and Tokyo, Japan. The company was founded by Paul J. Travers in 1997 and is headquartered in West Henrietta, NY. |
| Insider Trading |
Relationship |
Date |
Transaction |
Cost |
#Shares |
Value ($) |
#Shares Total |
SEC Form 4 |
| Harned Timothy Heydenreich | Director | Apr 22 '24 | Buy | 1.31 | 20,000 | 26,188 | 186,016 | Apr 23 11:54 AM | | Travers Paul J | President and CEO | Apr 22 '24 | Buy | 1.25 | 14,500 | 18,163 | 2,859,670 | Apr 22 12:40 PM | | Travers Paul J | President and CEO | Apr 18 '24 | Buy | 1.34 | 7,500 | 10,062 | 2,845,170 | Apr 18 01:50 PM | | Travers Paul J | President and CEO | Nov 15 '23 | Buy | 2.57 | 7,500 | 19,274 | 2,837,670 | Nov 17 09:35 AM | | Kay Edward William Jr. | Director | Aug 16 '23 | Buy | 4.23 | 10,000 | 42,300 | 206,843 | Aug 17 12:10 PM |
|
|
|
