 |
| Market Cap | 1.54B | EPS (ttm) | 0.04 |
| P/E | 85.46 | EPS this Y | 181.51% |
| Forward P/E | 22.52 | EPS next Y | 20.54% |
| PEG | - | EPS past 5Y | - |
| P/S | 1.68 | EPS next 5Y | - |
| P/B | 2.44 | EPS Q/Q | 262.31% |
| Dividend | - | Sales Q/Q | -2.39% |
| Insider Own | 54.02% | Inst Own | 43.60% |
| Insider Trans | -1.06% | Inst Trans | 97.46% |
| Short Float | 1.74% | Earnings | Mar 14/a |
| Analyst Recom | 1.86 | Target Price | 6.31 |
| Avg Volume | 432.84K | 52W Range | 3.65 - 8.18 |
|
|
|
|
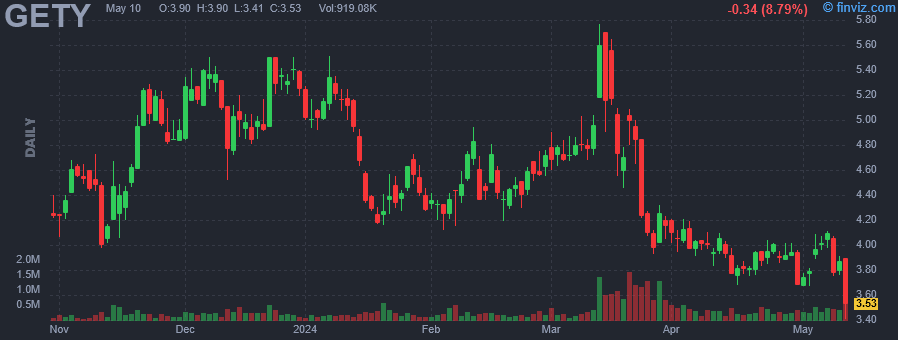
Getty Images Holdings, Inc. operates as a visual content creator and marketplace. It offers creative and editorial content solutions through its brands Getty Images, iStock, and Unsplash. The company was founded by Mark Harris Getty on March 14, 1995 and is headquartered in Seattle, WA. |
| Insider Trading |
Relationship |
Date |
Transaction |
Cost |
#Shares |
Value ($) |
#Shares Total |
SEC Form 4 |
| Chu Chinh | Director | Apr 12 '24 | Sale | 4.01 | 1,544 | 6,195 | 8,460,865 | Apr 15 04:30 PM | | Chu Chinh | Director | Apr 11 '24 | Sale | 4.04 | 38,488 | 155,484 | 8,462,409 | Apr 15 04:30 PM | | Chu Chinh | Director | Apr 09 '24 | Sale | 4.03 | 39,122 | 157,556 | 8,500,897 | Apr 11 05:08 PM | | Chu Chinh | Director | Apr 08 '24 | Sale | 4.00 | 10,121 | 40,507 | 8,540,019 | Apr 09 04:30 PM | | Chu Chinh | Director | Apr 05 '24 | Sale | 4.01 | 14,707 | 58,996 | 8,550,140 | Apr 09 04:30 PM |
|
|
 |
 |
| Market Cap | 84.03M | EPS (ttm) | -9.38 |
| P/E | - | EPS this Y | 29.53% |
| Forward P/E | - | EPS next Y | 28.37% |
| PEG | - | EPS past 5Y | -748.39% |
| P/S | 0.26 | EPS next 5Y | - |
| P/B | - | EPS Q/Q | 81.62% |
| Dividend | - | Sales Q/Q | -12.85% |
| Insider Own | 49.71% | Inst Own | 15.68% |
| Insider Trans | -0.07% | Inst Trans | -13.89% |
| Short Float | 5.99% | Earnings | Mar 12/a |
| Analyst Recom | 2.00 | Target Price | 13.14 |
| Avg Volume | 41.66K | 52W Range | 3.86 - 11.49 |
|
|
|
|
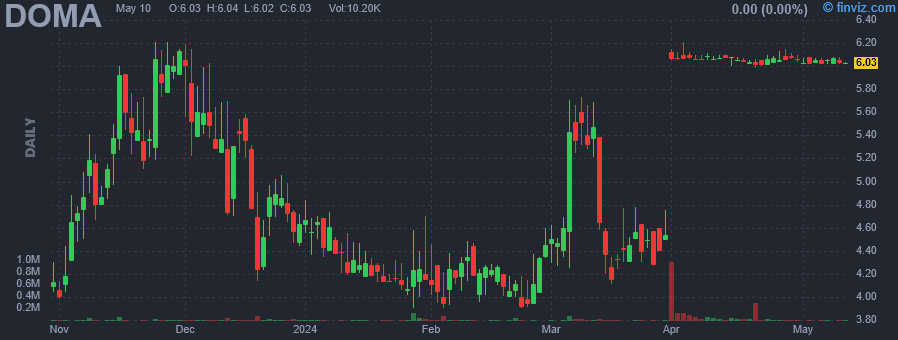
Doma Holdings, Inc. engages in the development of machine intelligence technology for residential and commercial real estate transactions. It operates through the following segments: Underwriting and Corporate and Other. The Underwriting segment reflects the sale and execution of underwriting and insurance services. The Corporate and Other segment reflects operations related to the execution of title, escrow and settlement services through Doma Enterprise channel. The company was founded by Max Simkoff in September 2016 and is headquartered in San Francisco, CA. |
| Insider Trading |
Relationship |
Date |
Transaction |
Cost |
#Shares |
Value ($) |
#Shares Total |
SEC Form 4 |
| Smith Michael Alan | EVP & Chief Financial Officer | Apr 12 '24 | Sale | 6.07 | 591 | 3,587 | 131,977 | Apr 15 04:24 PM | | Smith Michael Alan | EVP & Chief Financial Officer | Jan 19 '24 | Sale | 4.17 | 726 | 3,025 | 146,324 | Jan 22 04:43 PM | | Simkoff Maxwell | Chief Executive Officer | Jan 05 '24 | Sale | 4.49 | 462 | 2,075 | 331,919 | Jan 08 04:21 PM | | Smith Michael Alan | EVP & Chief Financial Officer | Jan 05 '24 | Sale | 4.49 | 168 | 755 | 147,050 | Jan 08 04:16 PM | | Simkoff Maxwell | Chief Executive Officer | Dec 04 '23 | Sale | 5.76 | 2,235 | 12,865 | 332,381 | Dec 06 04:40 PM |
|
|
|
 |
| Market Cap | 17.25B | EPS (ttm) | 0.87 |
| P/E | 104.30 | EPS this Y | 76.91% |
| Forward P/E | 34.64 | EPS next Y | 70.46% |
| PEG | 2.43 | EPS past 5Y | - |
| P/S | 7.13 | EPS next 5Y | 43.00% |
| P/B | 3.46 | EPS Q/Q | 8269.23% |
| Dividend | - | Sales Q/Q | 25.23% |
| Insider Own | 2.03% | Inst Own | 98.66% |
| Insider Trans | -4.53% | Inst Trans | 2.05% |
| Short Float | 1.65% | Earnings | Apr 24/a |
| Analyst Recom | 1.73 | Target Price | 109.75 |
| Avg Volume | 1.38M | 52W Range | 76.02 - 100.38 |
|
|
|
|
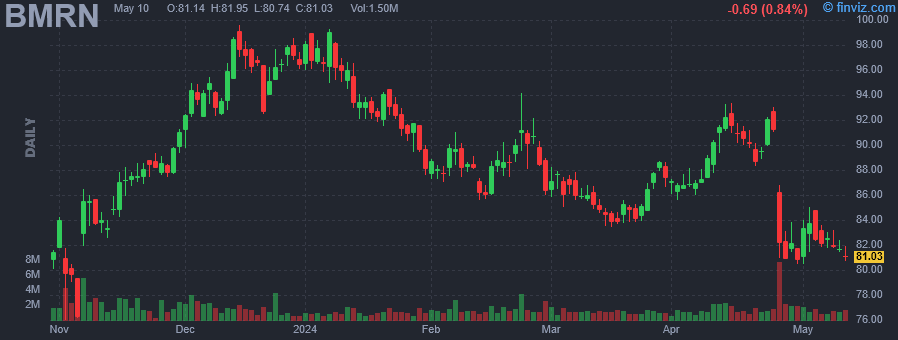
BioMarin Pharmaceutical, Inc. engages in the development and commercialization of therapies for people with serious and life-threatening rare diseases and medical conditions. Its pipeline products include Valoctocogene roxaparvovec, Vosoritide, and BMN 307. The company was founded by John C. Klock, Christopher M. Starr and Grant W. Denison on March 21, 1997, and is headquartered in San Rafael, CA. |
| Insider Trading |
Relationship |
Date |
Transaction |
Cost |
#Shares |
Value ($) |
#Shares Total |
SEC Form 4 |
| BIENAIME JEAN JACQUES | Director | Apr 12 '24 | Option Exercise | 63.10 | 20,000 | 1,262,000 | 494,994 | Apr 15 04:21 PM | | BIENAIME JEAN JACQUES | Director | Apr 12 '24 | Sale | 91.26 | 20,000 | 1,825,200 | 474,994 | Apr 15 04:21 PM | | BIENAIME JEAN JACQUES | Director | Apr 11 '24 | Option Exercise | 63.10 | 20,000 | 1,262,000 | 494,994 | Apr 15 04:21 PM | | BIENAIME JEAN JACQUES | Director | Apr 11 '24 | Sale | 90.99 | 20,000 | 1,819,800 | 474,994 | Apr 15 04:21 PM | | Burkhart Erin | GVP, Chief Accounting Officer | Apr 10 '24 | Sale | 90.00 | 2,286 | 205,740 | 16,156 | Apr 12 03:07 PM |
|
|
| |
 |
| Market Cap | 471.83M | EPS (ttm) | -0.95 |
| P/E | - | EPS this Y | -68.92% |
| Forward P/E | - | EPS next Y | -28.37% |
| PEG | - | EPS past 5Y | - |
| P/S | - | EPS next 5Y | - |
| P/B | 1.73 | EPS Q/Q | 41.33% |
| Dividend | - | Sales Q/Q | - |
| Insider Own | 61.38% | Inst Own | 43.18% |
| Insider Trans | -0.13% | Inst Trans | - |
| Short Float | 4.34% | Earnings | Mar 26/b |
| Analyst Recom | 2.00 | Target Price | 9.55 |
| Avg Volume | 129.04K | 52W Range | 4.06 - 12.42 |
|
|
|
|
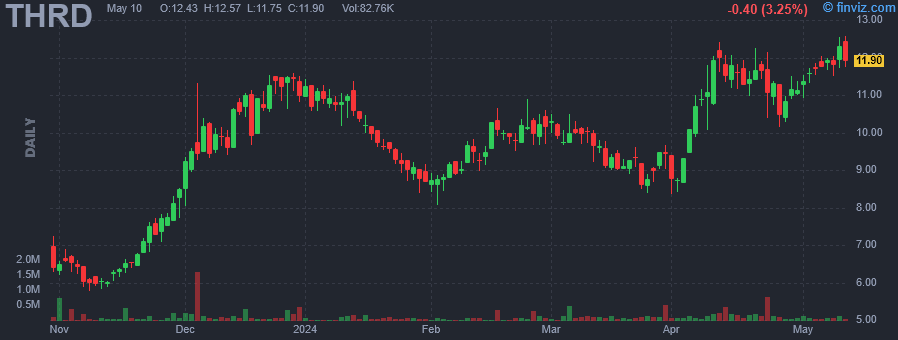
Third Harmonic Bio, Inc. develops pharmaceutical products for the treatment of allergic and immune diseases and disorders. It focuses on the development of the next wave of medicine for the treatment of allergic and inflammatory diseases. The company was founded on April 25, 2019 and is headquartered in San Francisco, CA. |
| Insider Trading |
Relationship |
Date |
Transaction |
Cost |
#Shares |
Value ($) |
#Shares Total |
SEC Form 4 |
| Holles Natalie C. | CEO | Apr 11 '24 | Option Exercise | 4.20 | 13,558 | 56,944 | 1,232,394 | Apr 15 04:14 PM | | Holles Natalie C. | CEO | Apr 11 '24 | Sale | 12.19 | 13,558 | 165,214 | 1,218,836 | Apr 15 04:14 PM | | Person Julie | CHIEF ADMINISTRATIVE OFFICER | Apr 04 '24 | Option Exercise | 4.20 | 1,107 | 4,649 | 1,107 | Apr 08 05:21 PM | | Person Julie | CHIEF ADMINISTRATIVE OFFICER | Apr 04 '24 | Sale | 10.00 | 1,107 | 11,070 | 0 | Apr 08 05:21 PM | | Person Julie | Chief Administrative Officer | Dec 05 '23 | Option Exercise | 4.20 | 12,863 | 54,025 | 12,863 | Dec 07 04:04 PM |
|
|
|
 |
| Market Cap | 11.91B | EPS (ttm) | 12.95 |
| P/E | 8.83 | EPS this Y | 10.09% |
| Forward P/E | 8.40 | EPS next Y | 0.06% |
| PEG | - | EPS past 5Y | 20.57% |
| P/S | 1.17 | EPS next 5Y | -0.05% |
| P/B | 1.70 | EPS Q/Q | 32.22% |
| Dividend | 0.77% | Sales Q/Q | 9.42% |
| Insider Own | 1.13% | Inst Own | 92.65% |
| Insider Trans | -13.51% | Inst Trans | -3.88% |
| Short Float | 2.67% | Earnings | Feb 20/a |
| Analyst Recom | 2.05 | Target Price | 129.97 |
| Avg Volume | 1.40M | 52W Range | 59.46 - 130.63 |
|
|
|
|
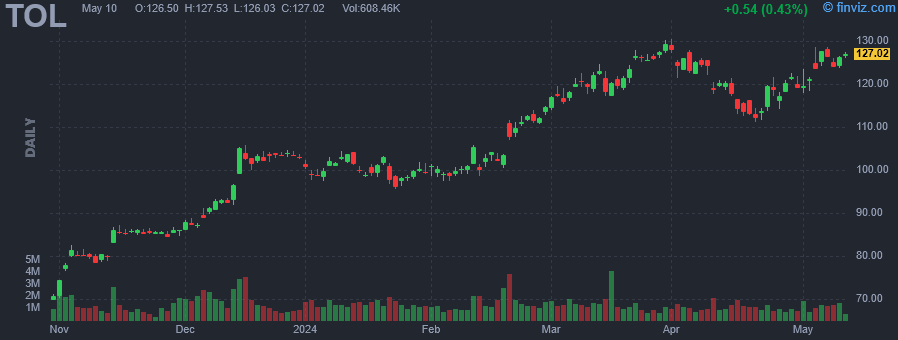
Toll Brothers, Inc. engages in the design, building, marketing, and arranging of financing for detached and attached homes in residential communities. It operates through the following geographical segments: North Region, Mid-Atlantic Region, South Region, Mountain Region, and Pacific Region. The company was founded by Robert I. Toll, and Bruce E. Toll in May 1967 and is headquartered in Fort Washington, PA. |
| Insider Trading |
Relationship |
Date |
Transaction |
Cost |
#Shares |
Value ($) |
#Shares Total |
SEC Form 4 |
| East Stephen F. | Director | Apr 15 '24 | Sale | 119.32 | 1,500 | 178,980 | 9,389 | Apr 15 04:07 PM | | SHAPIRO PAUL E | Director | Apr 03 '24 | Sale | 123.22 | 2,500 | 308,050 | 120,107 | Apr 03 04:20 PM | | Connor Martin P. | Chief Financial Officer | Mar 20 '24 | Sale | 123.90 | 5,000 | 619,500 | 44,721 | Mar 21 04:05 PM | | Yearley Douglas C. Jr. | Chief Executive Officer | Mar 04 '24 | Option Exercise | 32.85 | 50,000 | 1,642,500 | 396,382 | Mar 05 04:03 PM | | Yearley Douglas C. Jr. | Chief Executive Officer | Mar 04 '24 | Sale | 118.85 | 50,000 | 5,942,601 | 346,382 | Mar 05 04:03 PM |
|
|
| |
 |
| Market Cap | 54.07B | EPS (ttm) | -1.42 |
| P/E | - | EPS this Y | 119.87% |
| Forward P/E | 92.30 | EPS next Y | 413.82% |
| PEG | - | EPS past 5Y | -16.86% |
| P/S | 6.26 | EPS next 5Y | - |
| P/B | 7.93 | EPS Q/Q | 76.67% |
| Dividend | - | Sales Q/Q | 26.68% |
| Insider Own | 28.70% | Inst Own | 63.37% |
| Insider Trans | -2.38% | Inst Trans | -0.78% |
| Short Float | 3.93% | Earnings | May 01/a |
| Analyst Recom | 1.84 | Target Price | 136.56 |
| Avg Volume | 3.62M | 52W Range | 56.59 - 143.34 |
|
|
|
|
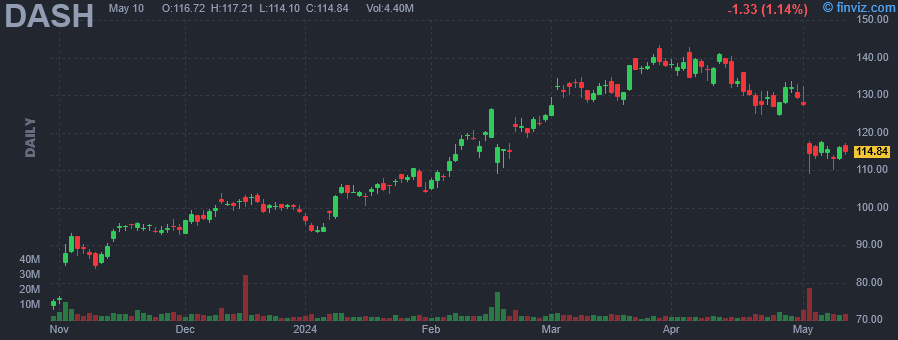
DoorDash, Inc. engages in the design, development, and operation of a food delivery and logistics platform. It serves consumers in the United States, Canada, and Australia. The company was founded by Andy Fang, Tony Xu, Stanley Tang, and Evan Moore on January 12, 2013, and is headquartered in San Francisco, CA. |
| Insider Trading |
Relationship |
Date |
Transaction |
Cost |
#Shares |
Value ($) |
#Shares Total |
SEC Form 4 |
| Fang Andy | Director | Apr 12 '24 | Option Exercise | 0.20 | 66,195 | 13,239 | 102,677 | Apr 15 04:05 PM | | Fang Andy | Director | Apr 12 '24 | Sale | 138.93 | 66,195 | 9,196,587 | 36,482 | Apr 15 04:05 PM | | Fang Andy | Director | Apr 11 '24 | Option Exercise | 0.20 | 66,195 | 13,239 | 102,677 | Apr 15 04:05 PM | | Fang Andy | Director | Apr 11 '24 | Sale | 139.31 | 66,195 | 9,221,472 | 36,482 | Apr 15 04:05 PM | | Brown Shona L | Director | Apr 04 '24 | Sale | 141.60 | 700 | 99,120 | 70,111 | Apr 08 04:05 PM |
|
|
|
 |
| Market Cap | 3.58B | EPS (ttm) | - |
| P/E | - | EPS this Y | - |
| Forward P/E | - | EPS next Y | - |
| PEG | - | EPS past 5Y | - |
| P/S | - | EPS next 5Y | - |
| P/B | - | EPS Q/Q | - |
| Dividend | - | Sales Q/Q | - |
| Insider Own | 0.00% | Inst Own | - |
| Insider Trans | - | Inst Trans | - |
| Short Float | - | Earnings | - |
| Analyst Recom | - | Target Price | - |
| Avg Volume | 2.94M | 52W Range | 22.61 - 24.70 |
|
|
|
|
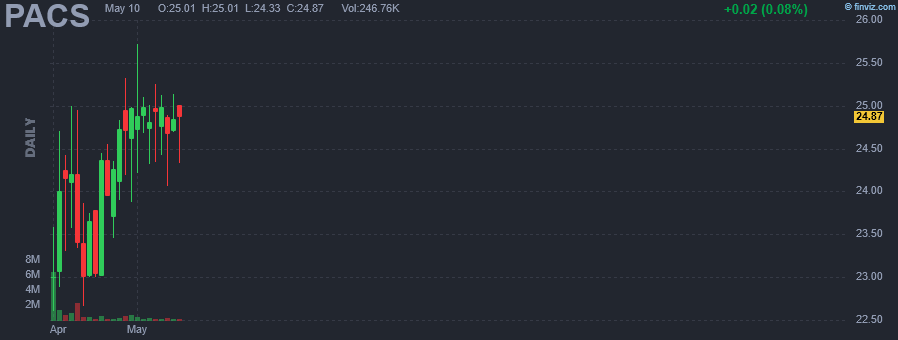
PACS Group, Inc. is a post-acute healthcare company, primarily focuses on delivering skilled nursing care through a portfolio of independently operated facilities. It also provides senior care, assisted living, and independent living options in some communities. The company provides services under brand name is :Pacs post acute, Pacs serives, Pacs properties and Pacs ventures. PACS Group was founded by Jason Murray and Mark Hancock on January 1, 2013 and is headquartered in Farmington, UT. |
| Insider Trading |
Relationship |
Date |
Transaction |
Cost |
#Shares |
Value ($) |
#Shares Total |
SEC Form 4 |
| Murray Jason Hulse | Co-Founder, CEO & Chairman | Apr 15 '24 | Sale | 21.00 | 1,607,142 | 33,749,982 | 62,754,551 | Apr 15 04:02 PM | | Hancock Mark | Co-Founder & Exec. Vice Chair. | Apr 15 '24 | Sale | 21.00 | 1,607,142 | 33,749,982 | 62,754,551 | Apr 15 04:02 PM |
|
|
| |
 |
| Market Cap | 3.33B | EPS (ttm) | 3.64 |
| P/E | 14.25 | EPS this Y | 22.35% |
| Forward P/E | 10.83 | EPS next Y | 7.72% |
| PEG | 0.98 | EPS past 5Y | 47.77% |
| P/S | 1.93 | EPS next 5Y | 14.50% |
| P/B | - | EPS Q/Q | -18.16% |
| Dividend | - | Sales Q/Q | -0.40% |
| Insider Own | 1.87% | Inst Own | 109.70% |
| Insider Trans | -1.32% | Inst Trans | -4.94% |
| Short Float | 4.67% | Earnings | Feb 28/b |
| Analyst Recom | 1.83 | Target Price | 65.55 |
| Avg Volume | 859.48K | 52W Range | 40.87 - 61.30 |
|
|
|
|
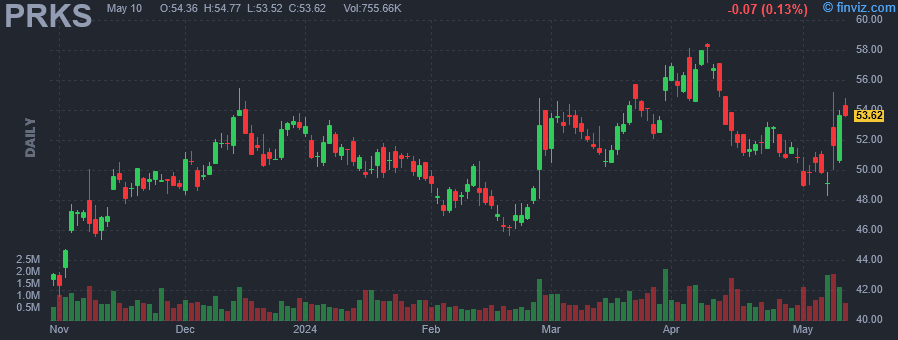
United Parks & Resorts, Inc. is a holding company, which engages in the ownership and operation of theme parks. Its portfolio includes SeaWorld, Busch Gardens, Aquatica, Discovery Cove, Sesame Place, and Sea Rescue. The company was founded in 1959 and is headquartered in Orlando, FL. |
| Insider Trading |
Relationship |
Date |
Transaction |
Cost |
#Shares |
Value ($) |
#Shares Total |
SEC Form 4 |
| Miller Kyle Robert | See Remarks | Apr 15 '24 | Sale | 53.87 | 1,000 | 53,870 | 36,961 | Apr 15 04:00 PM | | Miller Kyle Robert | See Remarks | Mar 18 '24 | Sale | 52.50 | 1,000 | 52,500 | 37,961 | Mar 19 04:00 PM | | Surrett Byron | See Remarks | Mar 15 '24 | Sale | 50.50 | 5,083 | 256,692 | 15,306 | Mar 19 04:00 PM | | Surrett Byron | See Remarks | Mar 05 '24 | Sale | 53.48 | 1,082 | 57,865 | 10,586 | Mar 06 04:00 PM | | Miller Kyle Robert | See Remarks | Feb 28 '24 | Sale | 52.50 | 2,000 | 105,000 | 23,709 | Mar 01 04:00 PM |
|
|
|
 |
| Market Cap | 198.70M | EPS (ttm) | 2.02 |
| P/E | 8.63 | EPS this Y | -20.86% |
| Forward P/E | 4.65 | EPS next Y | 56.90% |
| PEG | 0.66 | EPS past 5Y | - |
| P/S | 0.45 | EPS next 5Y | 13.00% |
| P/B | - | EPS Q/Q | -78.06% |
| Dividend | - | Sales Q/Q | -18.64% |
| Insider Own | 64.57% | Inst Own | 20.92% |
| Insider Trans | -3.21% | Inst Trans | 1.83% |
| Short Float | 2.20% | Earnings | Mar 07/b |
| Analyst Recom | 1.00 | Target Price | 28.33 |
| Avg Volume | 22.54K | 52W Range | 12.65 - 45.63 |
|
|
|
|
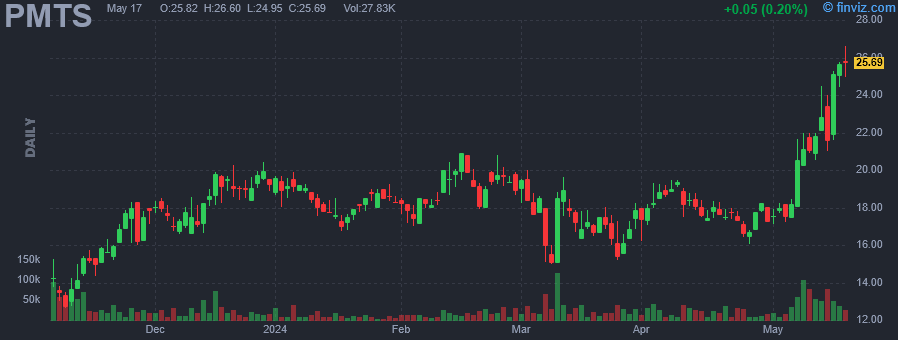
CPI Card Group, Inc. engages in the provision of financial payment card solutions. It operates through the following business segments: U.S. Debit and Credit, U.S. Prepaid Debit, and Other. The U.S. Debit and Credit segment produces Financial Payment Cards and provides integrated card services to card-issuing banks in the U.S. The U.S. Prepaid Debit segment provides integrated card services to Prepaid Debit Card program managers in the U.S. The Other segment consists of corporate expenses and less significant operations that generated sales from the production of Financial Payment, retail gift, card personalization, and fulfillment services in Canada. The company was founded in June 2007 and is headquartered in Littleton, CO. |
| Insider Trading |
Relationship |
Date |
Transaction |
Cost |
#Shares |
Value ($) |
#Shares Total |
SEC Form 4 |
| Parallel49 Equity, ULC | 10% Owner | Apr 05 '24 | Sale | 18.03 | 244,314 | 4,404,004 | 6,314,511 | Apr 15 01:51 PM | | Riley H Sanford | Director | Jun 09 '23 | Buy | 23.35 | 2,500 | 58,380 | 7,500 | Jun 09 09:14 PM | | Riley H Sanford | Director | Jun 08 '23 | Buy | 24.05 | 2,628 | 63,200 | 5,000 | Jun 09 09:14 PM | | Riley H Sanford | Director | Jun 07 '23 | Buy | 24.37 | 2,372 | 57,804 | 2,372 | Jun 09 09:14 PM |
|
|
|
 |
| Market Cap | 348.44M | EPS (ttm) | 0.30 |
| P/E | 38.63 | EPS this Y | - |
| Forward P/E | - | EPS next Y | - |
| PEG | - | EPS past 5Y | - |
| P/S | 14.05 | EPS next 5Y | - |
| P/B | 0.89 | EPS Q/Q | 1076.00% |
| Dividend | 4.56% | Sales Q/Q | 7.20% |
| Insider Own | - | Inst Own | 38.94% |
| Insider Trans | - | Inst Trans | - |
| Short Float | 0.09% | Earnings | - |
| Analyst Recom | - | Target Price | - |
| Avg Volume | 59.52K | 52W Range | 9.86 - 12.31 |
|
|
|
|
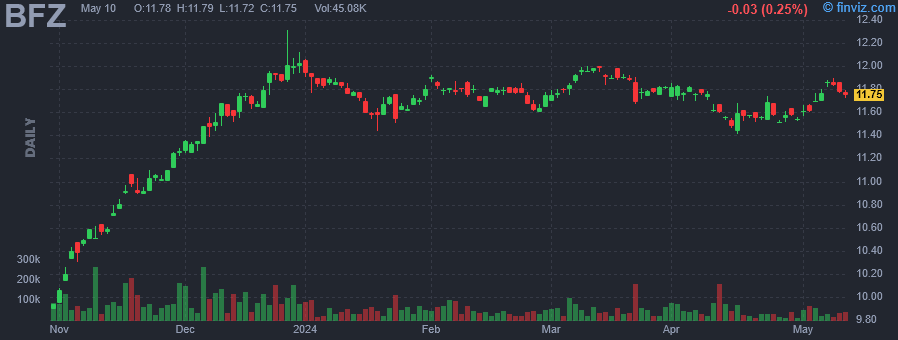
BlackRock California Municipal Income Trust is a closed ended fixed income mutual fund launched by BlackRock, Inc. It is managed by BlackRock Advisors, LLC. The fund invests in fixed income markets. It invests primarily in investment grade municipal bonds that are exempt from regular federal and California income taxes. BlackRock California Municipal Income Trust was formed on July 31, 2001 and is domiciled in United States. |
| Insider Trading |
Relationship |
Date |
Transaction |
Cost |
#Shares |
Value ($) |
#Shares Total |
SEC Form 4 |
| Saba Capital Management, L.P. | 10% Owner | Apr 02 '24 | Buy | 11.79 | 8,359 | 98,553 | 5,239,568 | Apr 03 01:32 PM | | Saba Capital Management, L.P. | 10% Owner | Apr 01 '24 | Buy | 11.76 | 6,109 | 71,842 | 5,231,209 | Apr 03 01:32 PM | | Saba Capital Management, L.P. | 10% Owner | Mar 28 '24 | Buy | 11.82 | 40,094 | 473,911 | 5,225,100 | Apr 01 08:37 AM | | Saba Capital Management, L.P. | 10% Owner | Mar 25 '24 | Buy | 11.77 | 23,774 | 279,820 | 5,185,006 | Mar 27 09:06 AM | | Saba Capital Management, L.P. | 10% Owner | Mar 22 '24 | Buy | 11.79 | 17,184 | 202,599 | 5,161,232 | Mar 25 11:24 AM |
|
|
|
