 |
| Market Cap | 848.01M | EPS (ttm) | 0.84 |
| P/E | 11.29 | EPS this Y | 14.51% |
| Forward P/E | 8.15 | EPS next Y | 20.21% |
| PEG | 1.88 | EPS past 5Y | -3.99% |
| P/S | 1.40 | EPS next 5Y | 6.00% |
| P/B | 0.71 | EPS Q/Q | -33.27% |
| Dividend | 5.79% | Sales Q/Q | 42.74% |
| Insider Own | 2.97% | Inst Own | 79.18% |
| Insider Trans | -1.25% | Inst Trans | 1.00% |
| Short Float | 1.41% | Earnings | Apr 24/a |
| Analyst Recom | 1.80 | Target Price | 12.80 |
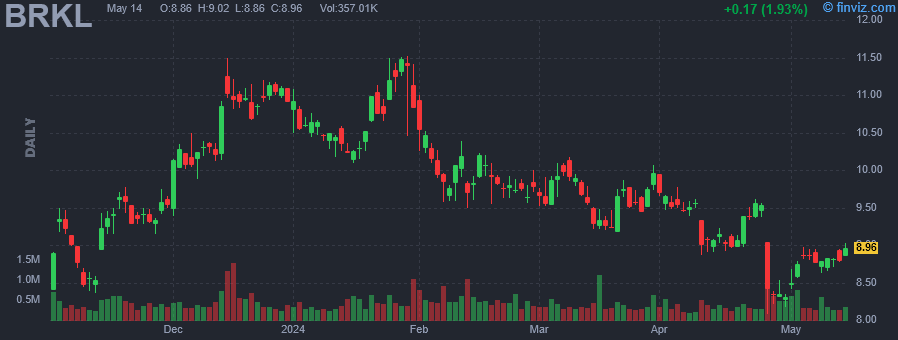
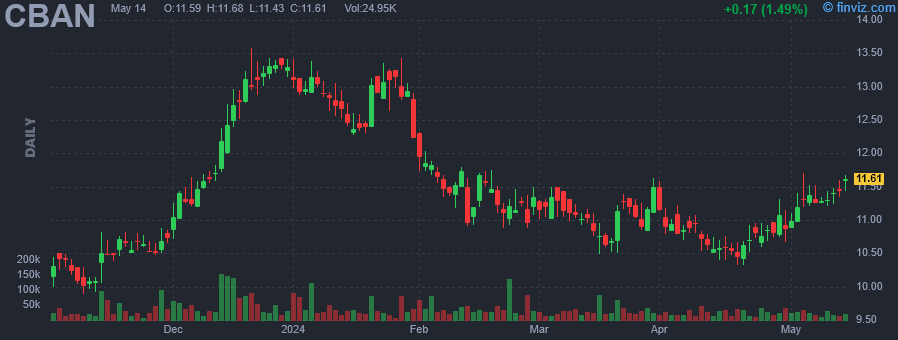
| Avg Volume | 452.23K | 52W Range | 7.00 - 11.52 |
|
|
|
|
Brookline Bancorp, Inc. is a multi-bank holding company that engages in the provision of financial solutions through its subsidiaries. The firm offers a range of commercial, business, and retail banking services, including cash management products, on-line banking services, consumer and residential loans, and investment services for small to mid-sized businesses and retail customers. It also provides equipment financing services. The company was founded on November 1, 1997 and is headquartered in Boston, MA. |
| Insider Trading |
Relationship |
Date |
Transaction |
Cost |
#Shares |
Value ($) |
#Shares Total |
SEC Form 4 |
| Cosman James M | Chief Operations Officer | Mar 12 '24 | Sale | 9.66 | 16,000 | 154,560 | 69,873 | Mar 13 04:11 PM | | Cosman James M | Chief Operations Officer | Mar 08 '24 | Sale | 10.00 | 16,000 | 160,000 | 69,873 | Mar 08 04:32 PM | | HACKETT JOHN A | Director | Nov 07 '23 | Sale | 9.13 | 3,500 | 31,955 | 37,998 | Nov 07 03:01 PM | | Hill Willard I JR | Director | Nov 02 '23 | Buy | 8.55 | 2,000 | 17,100 | 23,631 | Nov 03 10:00 AM | | Goldrick Michael P | CEO PCSB Bank | Jun 06 '23 | Buy | 8.71 | 5,000 | 43,550 | 14,152 | Jun 06 12:58 PM |
|
|
 |
 |
| Market Cap | 335.01M | EPS (ttm) | 1.27 |
| P/E | 9.54 | EPS this Y | -16.80% |
| Forward P/E | 9.78 | EPS next Y | 17.03% |
| PEG | 0.64 | EPS past 5Y | 6.76% |
| P/S | 1.47 | EPS next 5Y | 15.00% |
| P/B | 0.93 | EPS Q/Q | -37.59% |
| Dividend | - | Sales Q/Q | 18.51% |
| Insider Own | 29.11% | Inst Own | 47.30% |
| Insider Trans | -0.62% | Inst Trans | -0.25% |
| Short Float | 1.19% | Earnings | Apr 24/a |
| Analyst Recom | 1.00 | Target Price | 14.17 |
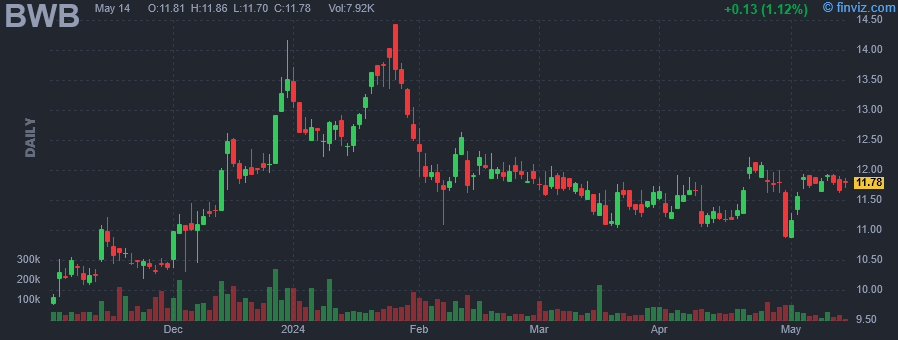
| Avg Volume | 58.44K | 52W Range | 7.90 - 14.43 |
|
|
|
|
Bridgewater Bancshares, Inc. is a holding company, which provides retail and commercial loan and deposit services. It offers deposits, lending, professional services, and business services. The company was founded by Jerry J. Baack and Jeffrey D. Shellberg in 2005 and is headquartered in St. Louis Park, MN. |
| Insider Trading |
Relationship |
Date |
Transaction |
Cost |
#Shares |
Value ($) |
#Shares Total |
SEC Form 4 |
| Johnson James S. | Director | Mar 06 '24 | Sale | 11.62 | 12,590 | 146,320 | 94,063 | Mar 06 05:11 PM | | Johnson James S. | Director | Mar 06 '24 | Sale | 11.66 | 10,000 | 116,558 | 59,250 | Mar 06 05:11 PM | | Baack Jerry J. | PRESIDENT & CEO | Jan 31 '24 | Sale | 13.00 | 14,489 | 188,428 | 1,222,862 | Jan 31 06:07 PM | | Baack Jerry J. | PRESIDENT & CEO | Jan 30 '24 | Sale | 13.11 | 15,687 | 205,677 | 1,237,351 | Jan 31 06:07 PM | | Trutna Thomas P. | Director | Dec 27 '23 | Option Exercise | 3.00 | 40,000 | 120,000 | 112,972 | Dec 29 04:10 PM |
|
|
|
 |
| Market Cap | 8.46B | EPS (ttm) | 16.51 |
| P/E | 22.98 | EPS this Y | 7.95% |
| Forward P/E | 16.67 | EPS next Y | 11.97% |
| PEG | 3.43 | EPS past 5Y | 6.61% |
| P/S | 1.19 | EPS next 5Y | 6.70% |
| P/B | 2.61 | EPS Q/Q | 1.74% |
| Dividend | - | Sales Q/Q | 11.19% |
| Insider Own | 1.32% | Inst Own | 88.53% |
| Insider Trans | -0.43% | Inst Trans | -0.50% |
| Short Float | 1.12% | Earnings | Apr 24/a |
| Analyst Recom | 1.73 | Target Price | 400.48 |
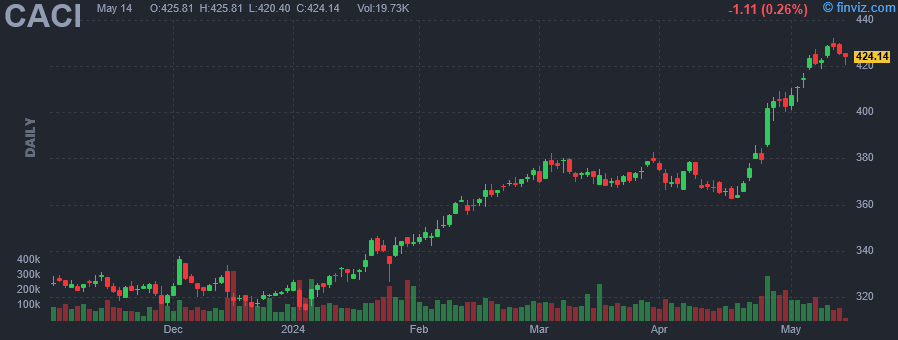
| Avg Volume | 119.73K | 52W Range | 293.69 - 385.70 |
|
|
|
|
CACI International, Inc. operates as holding company, which engages in the provision of information solutions and services in support of national security missions and government transformation for intelligence, defense, and federal civilian customers. It operates through the Domestic Operations and International Operations segment. The Domestic Operations segment offers information solutions and services to U.S. federal government agencies, state and local governments, and commercial enterprises to different market areas, including business systems, command and control, communications, cyber security, enterprise information technology (IT), health, intelligence services, investigation and litigation support, logistics and material readiness, and surveillance and reconnaissance. The International Operations segment includes the provision of IT services and proprietary data and software products, serving commercial and government customers. The company was founded by Herb Karr and Harry Markowitz in July 1962 and is headquartered in Reston, VA. |
| Insider Trading |
Relationship |
Date |
Transaction |
Cost |
#Shares |
Value ($) |
#Shares Total |
SEC Form 4 |
| Plunkett Debora A | Director | Mar 13 '24 | Sale | 373.82 | 270 | 100,931 | 2,146 | Mar 15 04:55 PM | | Koegel J William JR | EVP, General Counsel | Mar 06 '24 | Sale | 377.48 | 500 | 188,740 | 23,385 | Mar 08 01:51 PM | | Johnson Gregory G | Director | Feb 12 '24 | Sale | 361.69 | 150 | 54,254 | 6,446 | Feb 13 04:38 PM | | Plunkett Debora A | Director | Dec 13 '23 | Sale | 327.72 | 350 | 114,702 | 2,284 | Dec 19 05:35 PM | | Johnson Gregory G | Director | Sep 14 '23 | Sale | 319.82 | 125 | 39,978 | 5,998 | Sep 15 03:37 PM |
|
|
| |
 |
| Market Cap | 1.30B | EPS (ttm) | 6.09 |
| P/E | 8.39 | EPS this Y | 7.74% |
| Forward P/E | 7.57 | EPS next Y | 4.65% |
| PEG | - | EPS past 5Y | 29.04% |
| P/S | 1.78 | EPS next 5Y | - |
| P/B | 1.82 | EPS Q/Q | 8.84% |
| Dividend | 0.39% | Sales Q/Q | 19.75% |
| Insider Own | 1.66% | Inst Own | 94.50% |
| Insider Trans | -4.73% | Inst Trans | 0.19% |
| Short Float | 6.88% | Earnings | Apr 24/a |
| Analyst Recom | 2.33 | Target Price | 63.00 |
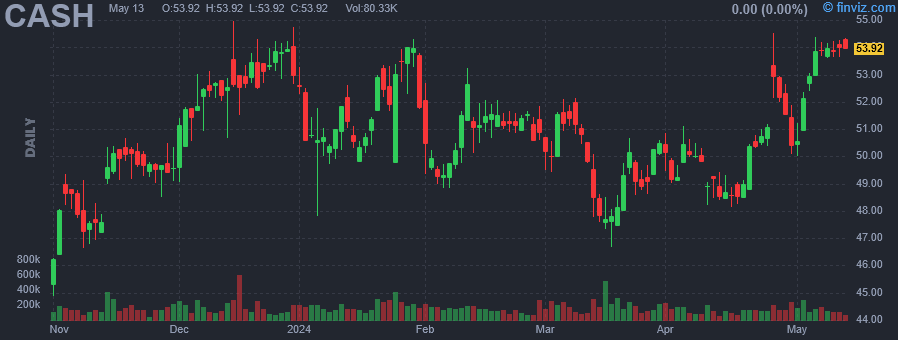
| Avg Volume | 178.72K | 52W Range | 39.90 - 60.49 |
|
|
|
|
Pathward Financial, Inc. operates as a financial holding company, which provides savings and loan services. The firm operates through the following business segments: Consumer, Commercial, and Corporate Services and Other. The Consumer segment provides meta payment systems (MPS), consumer credit products, warehouse finance and other tax services. The Commercial segment includes the Crestmark and AFS divisions. The Corporate Services and Other segment consists of certain shared services, treasury, retained community bank portfolio and student loan lending portfolio. The company was founded on June 14, 1993 and is headquartered in Sioux Falls, SD. |
| Insider Trading |
Relationship |
Date |
Transaction |
Cost |
#Shares |
Value ($) |
#Shares Total |
SEC Form 4 |
| Sharett Anthony M. | President | Mar 15 '24 | Sale | 47.50 | 1,000 | 47,500 | 33,146 | Mar 18 05:38 PM | | Herrick Glen William | EVP, Exec. Adv | Dec 01 '23 | Sale | 50.50 | 13,854 | 699,627 | 91,145 | Dec 01 04:08 PM | | Herrick Glen William | EVP, Exec. Adv | Nov 29 '23 | Sale | 50.50 | 165 | 8,332 | 104,999 | Dec 01 04:08 PM | | Herrick Glen William | EVP, CFO | Nov 21 '23 | Sale | 50.50 | 11 | 556 | 105,164 | Nov 24 05:06 PM | | Herrick Glen William | EVP, CFO | Nov 17 '23 | Sale | 50.50 | 5,970 | 301,485 | 105,175 | Nov 21 04:52 PM |
|
|
|
 |
| Market Cap | 188.95M | EPS (ttm) | 1.24 |
| P/E | 8.70 | EPS this Y | 1.55% |
| Forward P/E | 6.85 | EPS next Y | 19.85% |
| PEG | 1.24 | EPS past 5Y | -2.38% |
| P/S | 1.18 | EPS next 5Y | 7.00% |
| P/B | 0.74 | EPS Q/Q | 1.21% |
| Dividend | 4.18% | Sales Q/Q | 24.77% |
| Insider Own | 7.17% | Inst Own | 53.40% |
| Insider Trans | -4.13% | Inst Trans | -0.33% |
| Short Float | 0.36% | Earnings | Apr 24/a |
| Analyst Recom | 2.00 | Target Price | 14.50 |
| Avg Volume | 36.14K | 52W Range | 8.59 - 13.58 |
|
|
|
|
Colony Bankcorp, Inc. is a bank holding company, which engages in the stockholder and investor relations functions through its subsidiary, Colony Bank. It operates through the following segments: Banking Division, Mortgage Division, and Small Business Specialty Lending Division. The Banking Division segment offers full service financial services including commercial loans, consumer loans and deposit accounts. The Mortgage Division segment consists of sales and servicing of one-to-four family residential mortgage loans. The Small Business Specialty Lending Division segment focuses on the selling and servicing of SBA and USDA government guaranteed loans. The company was founded on November 8, 1982 and is headquartered in Fitzgerald, GA. |
| Insider Trading |
Relationship |
Date |
Transaction |
Cost |
#Shares |
Value ($) |
#Shares Total |
SEC Form 4 |
| Bateman Leonard H JR | EVP & Chief Credit Officer | Feb 23 '24 | Buy | 11.11 | 1,009 | 11,214 | 10,440 | Feb 26 04:54 PM | | Shelnutt Derek | CFO | Feb 14 '24 | Buy | 11.08 | 100 | 1,108 | 8,039 | Feb 14 04:32 PM | | Fountain T Heath | President and CEO | Feb 02 '24 | Buy | 11.94 | 800 | 9,552 | 52,888 | Feb 05 04:13 PM | | Fountain T Heath | President and CEO | Feb 02 '24 | Buy | 11.92 | 400 | 4,769 | 22,248 | Feb 05 04:13 PM | | Wyatt Harold | Director | Dec 15 '23 | Sale | 12.58 | 1,000 | 12,580 | 2,600 | Dec 18 04:20 PM |
|
|
| |
 |
| Market Cap | 2.61B | EPS (ttm) | 8.04 |
| P/E | 10.21 | EPS this Y | 23.58% |
| Forward P/E | 7.19 | EPS next Y | 14.22% |
| PEG | 1.13 | EPS past 5Y | 20.47% |
| P/S | 0.71 | EPS next 5Y | 9.06% |
| P/B | 1.09 | EPS Q/Q | 14.73% |
| Dividend | 1.16% | Sales Q/Q | 1.37% |
| Insider Own | 11.03% | Inst Own | 89.02% |
| Insider Trans | 0.00% | Inst Trans | -0.80% |
| Short Float | 4.69% | Earnings | Apr 24/a |
| Analyst Recom | 3.60 | Target Price | 94.40 |
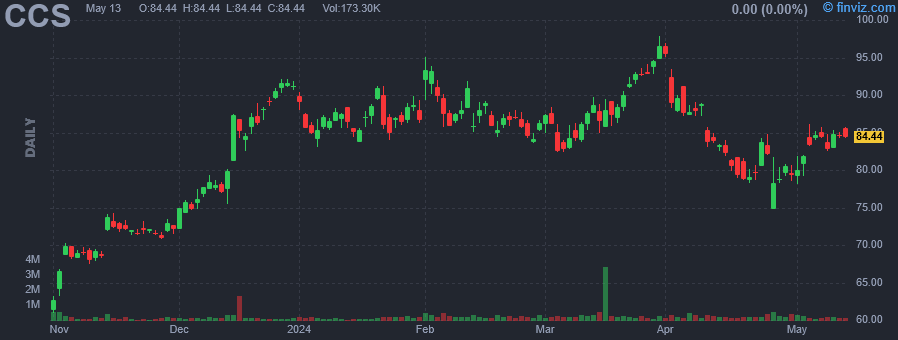
| Avg Volume | 347.18K | 52W Range | 58.01 - 97.92 |
|
|
|
|
Century Communities, Inc. engages in the development, design, construction, marketing and sale of single-family attached and detached homes. It operates through the following segments: West, Mountain, Texas, Southeast, Century Complete, and Financial Services. The West segment refers to projects in California and Washington. The Mountain segment represents projects in Arizona, Colorado, Nevada and Utah. The Texas segment is composed of projects in Houston, San Antonio and Austin. The Southeast segment consists of projects in Florida, Georgia, North Carolina, South Carolina and Tennessee. The Century Complete segment includes the revenue from the company's Century Complete brand, which has operations over 11 states. The Financial Services segment provides mortgage, title, and insurance services to homebuyers. The company was founded by Dale Francescon and Robert J. Francescon in 2002 and is headquartered in Greenwood Village, CO. |
| Insider Trading |
Relationship |
Date |
Transaction |
Cost |
#Shares |
Value ($) |
#Shares Total |
SEC Form 4 |
| MESSENGER DAVID L | CFO and Secretary | Jun 08 '23 | Sale | 70.13 | 45,000 | 3,155,634 | 175,001 | Jun 09 04:57 PM | | DIXON JOHN SCOTT | Assistant CFO | May 01 '23 | Sale | 66.72 | 3,173 | 211,703 | 0 | May 02 04:58 PM |
|
|
|
 |
| Market Cap | 9.09B | EPS (ttm) | 5.45 |
| P/E | 22.62 | EPS this Y | 9.45% |
| Forward P/E | 17.56 | EPS next Y | 28.63% |
| PEG | 12.57 | EPS past 5Y | 27.90% |
| P/S | 3.69 | EPS next 5Y | 1.80% |
| P/B | 10.29 | EPS Q/Q | 5700.76% |
| Dividend | 0.32% | Sales Q/Q | 16.89% |
| Insider Own | 9.30% | Inst Own | 78.38% |
| Insider Trans | 0.00% | Inst Trans | 0.10% |
| Short Float | 2.84% | Earnings | Apr 24/a |
| Analyst Recom | 1.30 | Target Price | 145.11 |
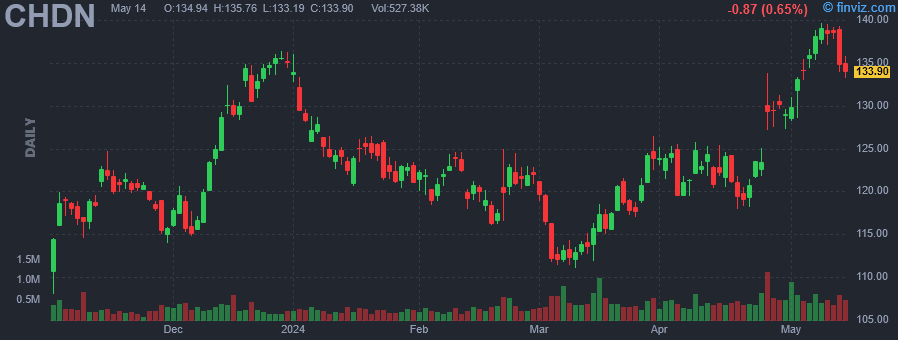
| Avg Volume | 397.13K | 52W Range | 106.45 - 150.45 |
|
|
|
|
Churchill Downs, Inc. operates as a provider of pari-mutuel horse racing, online account wagering on horse racing and casino gaming. It operates through the following business segments: Racing, Casino, Online Wagering, Corporate, and Other Investments. The Racing segment includes Churchill Downs Racetrack, Arlington Park Racecourse, Calder Race Course, and Fair Grounds Race Course. The Casinos segment includes Oxford Casino, Riverwalk Casino Hotel, Harlow's Casino Resort and Spa, Calder Casino, Fair Grounds Slots, Video Services and equity investment. The Online Wagering segment offers simulcasting and interactive wagering hub. The Corporate segment includes miscellaneous and other revenue, compensation expense, professional fees and other general and administrative expenses not allocated to other operating segments. The Other Investments and Corporate segment consists of United Tote Company and United Tote Canada, Capital View Casino and Resort, Bluff Media, and minor investments. The company was founded in 1875 and is headquartered in Louisville, KY. |
| Insider Trading |
Relationship |
Date |
Transaction |
Cost |
#Shares |
Value ($) |
#Shares Total |
SEC Form 4 |
| Adams Maureen | EVP, Gaming Operations | Feb 10 '24 | Option Exercise | 0.00 | 2,118 | 0 | 11,892 | Feb 13 04:04 PM | | Blackwell Bradley K. | EVP, General Counsel | Feb 10 '24 | Option Exercise | 0.00 | 3,212 | 0 | 23,185 | Feb 13 04:04 PM | | Mudd William E | President and COO | Dec 31 '23 | Option Exercise | 0.00 | 13,192 | 0 | 617,216 | Jan 03 04:41 PM | | Dall Marcia A | EVP, and CFO | Dec 31 '23 | Option Exercise | 0.00 | 8,570 | 0 | 135,072 | Jan 03 04:47 PM | | Blackwell Bradley K. | SVP, General Counsel | Dec 31 '23 | Option Exercise | 0.00 | 1,468 | 0 | 20,650 | Jan 03 04:40 PM |
|
|
| |
 |
| Market Cap | 9.36B | EPS (ttm) | 17.92 |
| P/E | 34.49 | EPS this Y | 15.85% |
| Forward P/E | 24.32 | EPS next Y | 8.07% |
| PEG | 3.04 | EPS past 5Y | 7.95% |
| P/S | 4.13 | EPS next 5Y | 11.35% |
| P/B | 8.39 | EPS Q/Q | 42.88% |
| Dividend | 0.26% | Sales Q/Q | 7.18% |
| Insider Own | 2.43% | Inst Own | 95.97% |
| Insider Trans | -11.01% | Inst Trans | 1.15% |
| Short Float | 3.06% | Earnings | Apr 24/a |
| Analyst Recom | 1.50 | Target Price | 688.75 |
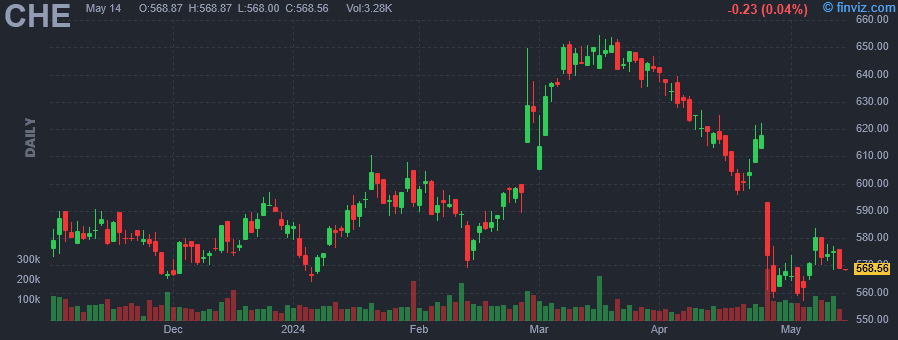
| Avg Volume | 79.63K | 52W Range | 492.84 - 654.62 |
|
|
|
|
Chemed Corp. engages in the provision of healthcare and maintenance services. It operates through the VITAS and Roto-Rooter segments. The VITAS segment offers hospice and palliative care services to patients through a network of physicians, registered nurses, home health aides, social workers, clergy, and volunteers. The Roto-Rooter segment includes plumbing, drain cleaning, water restoration, and other related services to residential and commercial customers. The company was founded in 1970 and is headquartered in Cincinnati, OH. |
| Insider Trading |
Relationship |
Date |
Transaction |
Cost |
#Shares |
Value ($) |
#Shares Total |
SEC Form 4 |
| LEE SPENCER S | executive vice president | Mar 28 '24 | Option Exercise | 106.59 | 13,000 | 1,385,670 | 33,760 | Apr 01 11:43 AM | | LEE SPENCER S | executive vice president | Mar 28 '24 | Sale | 641.65 | 2,000 | 1,283,300 | 20,760 | Apr 01 11:43 AM | | Witzeman Michael D | VP & Chief Financial Officer | Mar 21 '24 | Sale | 643.14 | 2,650 | 1,704,321 | 2,882 | Mar 22 01:21 PM | | Judkins Brian C | VP and Chief Legal Officer | Mar 20 '24 | Option Exercise | 443.22 | 11,958 | 5,300,013 | 12,580 | Mar 22 11:26 AM | | Witzeman Michael D | VP & Chief Financial Officer | Mar 20 '24 | Option Exercise | 413.19 | 2,600 | 1,074,294 | 5,887 | Mar 22 01:21 PM |
|
|
|
 |
| Market Cap | 6.60B | EPS (ttm) | 1.57 |
| P/E | 22.03 | EPS this Y | 10.33% |
| Forward P/E | 14.32 | EPS next Y | 22.53% |
| PEG | 1.05 | EPS past 5Y | 5.66% |
| P/S | 1.75 | EPS next 5Y | 20.90% |
| P/B | 3.95 | EPS Q/Q | 18.25% |
| Dividend | 1.09% | Sales Q/Q | -4.29% |
| Insider Own | 0.78% | Inst Own | 105.19% |
| Insider Trans | -1.80% | Inst Trans | -0.74% |
| Short Float | 4.13% | Earnings | Apr 24/a |
| Analyst Recom | 1.56 | Target Price | 41.75 |
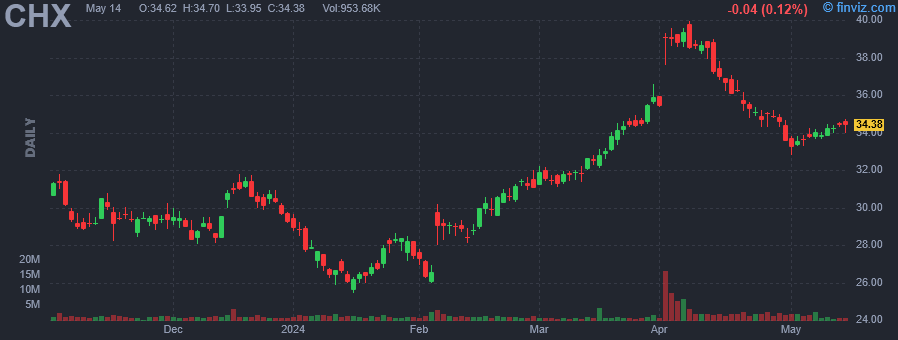
| Avg Volume | 2.14M | 52W Range | 24.98 - 39.95 |
|
|
|
|
ChampionX Corp. engages in the provision of chemistry solutions, artificial lift systems, and engineered equipment and technologies. It operates through the following segments: Production Chemical Technologies, Production and Automation Technologies, Drilling Technologies, and Reservoir Chemical Technologies. The Production Chemical Technologies segment offers products and services that cover a broad range of onshore and offshore chemical solutions in production and midstream operations. The Production and Automation Technologies focuses on offering products, technologies, and services that facilitate the safe, efficient, and cost-effective extraction of oil and gas through artificial lift and digital automation applications. The Drilling Technologies provides polycrystalline diamond cutter inserts, bearings, valves, and mining tools. The Reservoir Chemical Technologies relates to chemistry-oriented solutions and technologies. The company was founded in 1882 and is headquartered in The Woodlands, TX. |
| Insider Trading |
Relationship |
Date |
Transaction |
Cost |
#Shares |
Value ($) |
#Shares Total |
SEC Form 4 |
| O'Dell William Jr. | See remarks | Mar 28 '24 | Sale | 36.00 | 27,178 | 978,408 | 57,748 | Mar 28 06:43 PM | | Bryant Deric D. | See remarks | Oct 03 '23 | Sale | 35.02 | 6,540 | 229,014 | 298,619 | Oct 03 06:04 PM | | Bryant Deric D. | See remarks | Oct 02 '23 | Sale | 35.24 | 12,232 | 431,072 | 305,159 | Oct 03 06:04 PM | | Somasundaram Sivasankaran | President & CEO | Sep 07 '23 | Option Exercise | 34.13 | 20,000 | 682,600 | 475,499 | Sep 11 05:49 PM | | Bryant Deric D. | See remarks | Sep 01 '23 | Sale | 37.07 | 18,772 | 695,824 | 317,391 | Sep 05 05:45 PM |
|
|
|
 |
| Market Cap | 774.60M | EPS (ttm) | 0.86 |
| P/E | 19.19 | EPS this Y | 14.43% |
| Forward P/E | 13.18 | EPS next Y | 37.02% |
| PEG | 0.94 | EPS past 5Y | -15.27% |
| P/S | 1.52 | EPS next 5Y | 20.40% |
| P/B | 3.45 | EPS Q/Q | -5.76% |
| Dividend | 0.24% | Sales Q/Q | 0.50% |
| Insider Own | 0.93% | Inst Own | 101.59% |
| Insider Trans | 0.00% | Inst Trans | 0.52% |
| Short Float | 14.19% | Earnings | Apr 24/a |
| Analyst Recom | 3.40 | Target Price | 18.88 |
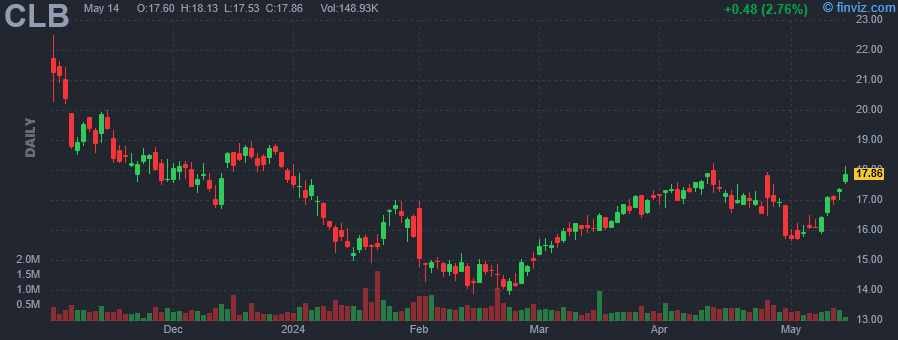
| Avg Volume | 434.57K | 52W Range | 13.82 - 27.94 |
|
|
|
|
Core Laboratories, Inc. provides proprietary and patented reservoir description and production enhancement services. The company was founded on May 1, 2023 and is headquartered in Houston, TX. |
| Insider Trading |
Relationship |
Date |
Transaction |
Cost |
#Shares |
Value ($) |
#Shares Total |
SEC Form 4 |
| ANASTASIO CURT | Director | Apr 01 '24 | Option Exercise | 0.00 | 6,419 | 0 | 6,419 | Apr 02 05:00 PM | | Carnes Martha Z. | Director | Apr 01 '24 | Option Exercise | 0.00 | 6,419 | 0 | 37,011 | Apr 02 05:02 PM | | Klingensmith Harvey Robert | Director | Apr 01 '24 | Option Exercise | 0.00 | 6,419 | 0 | 32,645 | Apr 02 05:05 PM | | Murray Katherine | Director | Apr 01 '24 | Option Exercise | 0.00 | 6,419 | 0 | 11,904 | Apr 02 05:08 PM | | Straughen Michael | Director | Apr 01 '24 | Option Exercise | 0.00 | 6,419 | 0 | 22,886 | Apr 02 05:10 PM |
|
|
|
