 |
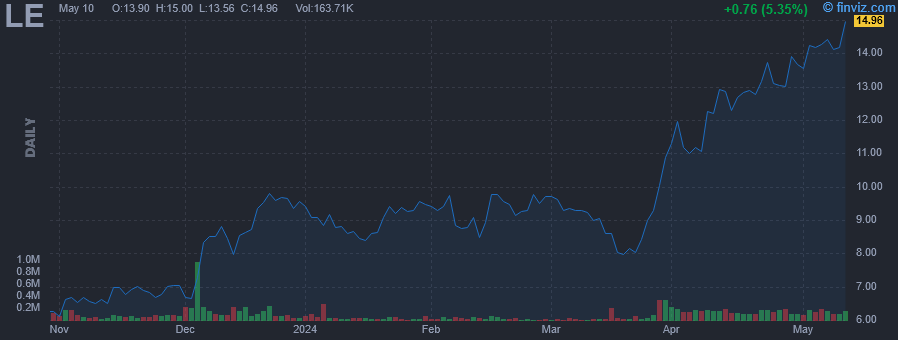
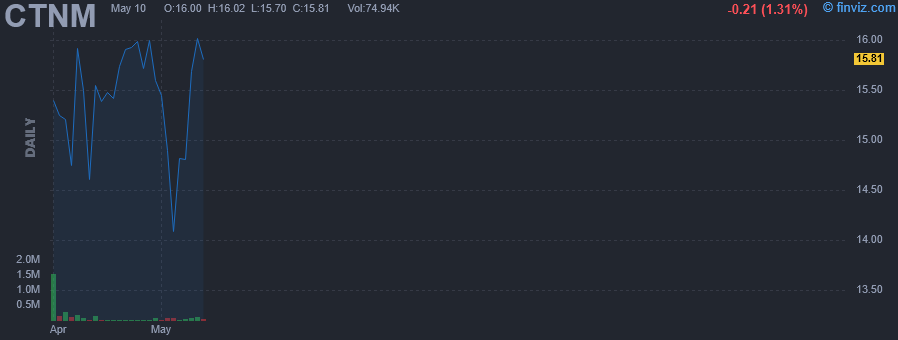
| Market Cap | 404.33M | EPS (ttm) | -4.10 |
| P/E | - | EPS this Y | 215.56% |
| Forward P/E | 35.67 | EPS next Y | 107.69% |
| PEG | - | EPS past 5Y | - |
| P/S | 0.27 | EPS next 5Y | 20.00% |
| P/B | 1.67 | EPS Q/Q | -172.61% |
| Dividend | - | Sales Q/Q | -2.79% |
| Insider Own | 64.34% | Inst Own | 31.23% |
| Insider Trans | 0.00% | Inst Trans | -7.97% |
| Short Float | 4.82% | Earnings | Mar 27/b |
| Analyst Recom | 1.00 | Target Price | 14.00 |
| Avg Volume | 78.46K | 52W Range | 5.98 - 13.02 |
|
|
|
|
Lands' End, Inc. operates as a digital retailer of casual clothing, accessories, and footwear, as well as home products. It operates through the following segments: US eCommerce, Japan eCommerce, Outfitters, Europe eCommerce, Japan eCommerce, Third Party, and Retail. The company was founded by Gary C. Comer in 1963 and is headquartered in Dodgeville, WI. |
| Insider Trading |
Relationship |
Date |
Transaction |
Cost |
#Shares |
Value ($) |
#Shares Total |
SEC Form 4 |
| Rieger Angela S. | Chief Transformation Officer | Mar 19 '24 | Option Exercise | 0.00 | 3,013 | 0 | 54,387 | Mar 20 04:06 PM | | McCRACKEN BERNARD LOUIS III | CFO and Treasurer | Mar 19 '24 | Option Exercise | 0.00 | 1,252 | 0 | 22,744 | Mar 20 04:08 PM | | GRAY PETER L | CCO, CAO and General Counsel | Mar 19 '24 | Option Exercise | 0.00 | 5,234 | 0 | 109,081 | Mar 20 04:09 PM | | McCRACKEN BERNARD LOUIS III | CFO and Treasurer | Mar 18 '24 | Option Exercise | 0.00 | 932 | 0 | 21,840 | Mar 20 04:08 PM | | Rieger Angela S. | Chief Transformation Officer | Mar 18 '24 | Option Exercise | 0.00 | 2,270 | 0 | 52,117 | Mar 20 04:06 PM |
|
|
 |
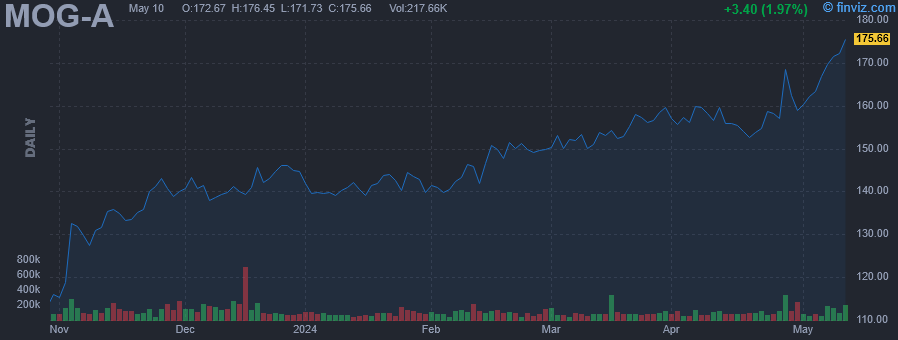 |
| Market Cap | 4.92B | EPS (ttm) | 5.38 |
| P/E | 28.66 | EPS this Y | 12.79% |
| Forward P/E | 19.04 | EPS next Y | 16.63% |
| PEG | 3.97 | EPS past 5Y | 14.79% |
| P/S | 1.44 | EPS next 5Y | 7.21% |
| P/B | 2.88 | EPS Q/Q | 2.69% |
| Dividend | 0.71% | Sales Q/Q | 12.68% |
| Insider Own | 11.82% | Inst Own | 88.75% |
| Insider Trans | -0.35% | Inst Trans | -1.94% |
| Short Float | 0.90% | Earnings | Apr 26/b |
| Analyst Recom | 1.67 | Target Price | 158.33 |
| Avg Volume | 109.10K | 52W Range | 87.84 - 161.04 |
|
|
|
|
Moog, Inc. is a designer, manufacturer, and systems integrator of precision motion and fluid controls and systems for applications in aerospace and defense and industrial markets. It operates through the following segments: Aircraft Controls, Space and Defense Controls, and Industrial Systems. The Aircraft Controls segment designs, manufactures, and integrates primary and secondary flight controls for military and commercial aircraft and provides aftermarket support. The Space and Defense Controls segment is involved in controlling satellites, space vehicles, launch vehicles, armored combat vehicles, tactical and strategic missiles, security and surveillance, and other defense applications. The Industrial Systems segment engages in customizing machine performance components and systems utilizing electrohydraulic, electromechanical, and control technologies in applications involving motion control, fluid control, and power and data management across a variety of markets. The company was founded by William C. Moog, Arthur Moog, and Lou Geyer in 1951 and is headquartered in East Aurora, NY. |
| Insider Trading |
Relationship |
Date |
Transaction |
Cost |
#Shares |
Value ($) |
#Shares Total |
SEC Form 4 |
| TRABERT MARK JOSEPH | Chief Operating Officer | Mar 18 '24 | Option Exercise | 75.72 | 16,181 | 1,225,238 | 16,549 | Mar 20 01:34 PM | | ATHOE MAUREEN MARY | Vice President | Dec 12 '23 | Sale | 140.22 | 2,896 | 406,081 | 0 | Dec 13 12:30 PM | | ATHOE MAUREEN MARY | Vice President | Dec 11 '23 | Sale | 138.22 | 3,372 | 466,074 | 2,896 | Dec 13 12:30 PM | | Scannell John | Director | Dec 05 '23 | Sale | 140.93 | 3,500 | 493,258 | 39,728 | Dec 06 03:12 PM | | Scannell John | Director | Dec 05 '23 | Sale | 140.93 | 3,500 | 493,258 | 35,846 | Dec 06 03:12 PM |
|
|
|
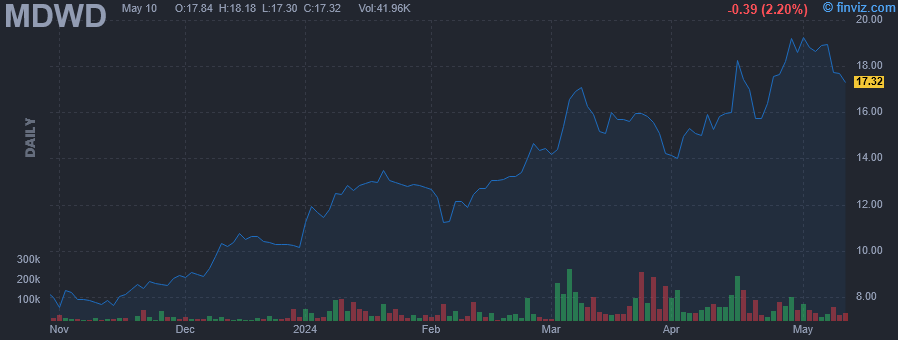 |
| Market Cap | 165.51M | EPS (ttm) | -0.77 |
| P/E | - | EPS this Y | -157.33% |
| Forward P/E | - | EPS next Y | 3.63% |
| PEG | - | EPS past 5Y | -22.25% |
| P/S | 8.86 | EPS next 5Y | - |
| P/B | 5.09 | EPS Q/Q | 83.95% |
| Dividend | - | Sales Q/Q | -54.05% |
| Insider Own | 28.24% | Inst Own | 27.18% |
| Insider Trans | 0.00% | Inst Trans | - |
| Short Float | 2.39% | Earnings | Mar 21/b |
| Analyst Recom | 1.00 | Target Price | 28.50 |
| Avg Volume | 69.94K | 52W Range | 7.10 - 18.66 |
|
|
|
|
MediWound Ltd. is a biopharmaceutical company, which engages in the development, manufacture, and commercialization of products to address needs in the fields of severe burns, chronic wounds, and other hard-to-heal wounds. Its product NexoBrid, is an orphan biologic for eschar removal in severe burns. The company was founded by Lior Rosenberg and Marian Gorecki in January 2000 and is headquartered in Yavne, Israel. |
|
| |
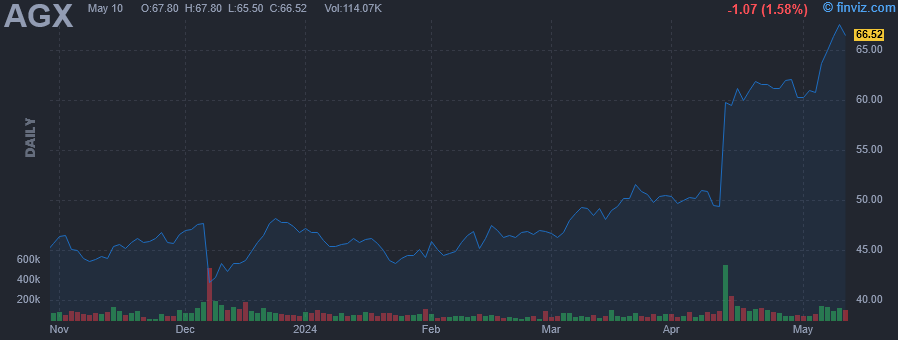 |
| Market Cap | 795.06M | EPS (ttm) | 2.39 |
| P/E | 25.14 | EPS this Y | 56.07% |
| Forward P/E | 13.45 | EPS next Y | 19.71% |
| PEG | 2.51 | EPS past 5Y | -6.35% |
| P/S | 1.39 | EPS next 5Y | 10.00% |
| P/B | 2.73 | EPS Q/Q | -11.34% |
| Dividend | 1.83% | Sales Q/Q | 38.54% |
| Insider Own | 5.22% | Inst Own | 80.65% |
| Insider Trans | 0.00% | Inst Trans | -3.80% |
| Short Float | 0.54% | Earnings | Apr 11/a |
| Analyst Recom | 1.00 | Target Price | 65.00 |
| Avg Volume | 70.38K | 52W Range | 37.37 - 61.79 |
|
|
|
|
Argan, Inc. is a construction company, which engages in the operations of its wholly owned subsidiaries. It operates through the following business segments: Power Industry Services, Telecommunications Infrastructure Services, and Industrial Fabrication and Field Services. The Power Industry Services segment includes engineering, procurement, construction, commissioning, maintenance, project development, and technical consulting services to the power generation market. The Telecommunications Infrastructure Services segment offers project management, construction, installation, and maintenance services. The Industrial Fabrication and Field Services segment provides primarily on-site services that support new plant construction and additions, maintenance turnarounds, shutdowns, and emergency mobilizations for industrial plants. It also operates through the United States, Republic of Ireland, United Kingdom, and Other geographical segments. The company was founded by Rainer H. Bosselmann in May 1961 and is headquartered in Rockville, MD. |
| Insider Trading |
Relationship |
Date |
Transaction |
Cost |
#Shares |
Value ($) |
#Shares Total |
SEC Form 4 |
| Flanders Cynthia | Director | Oct 12 '23 | Buy | 46.53 | 1,500 | 69,795 | 16,500 | Oct 12 06:04 PM | | Watson David Hibbert | PRESIDENT AND CEO | Oct 09 '23 | Option Exercise | 33.81 | 5,000 | 169,050 | 32,824 | Oct 11 04:15 PM | | Flanders Cynthia | Director | Oct 05 '23 | Buy | 26.88 | 7,000 | 188,160 | 22,000 | Oct 12 06:04 PM | | Flanders Cynthia | Director | Oct 05 '23 | Sale | 46.00 | 7,000 | 322,000 | 15,000 | Oct 12 06:04 PM | | Deily Richard H | CHIEF FINANCIAL OFFICER, SVP | Sep 13 '23 | Option Exercise | 0.00 | 2,220 | 0 | 6,838 | Sep 28 04:15 PM |
|
|
|
 |
| Market Cap | 386.75M | EPS (ttm) | - |
| P/E | - | EPS this Y | - |
| Forward P/E | - | EPS next Y | - |
| PEG | - | EPS past 5Y | - |
| P/S | - | EPS next 5Y | - |
| P/B | - | EPS Q/Q | - |
| Dividend | - | Sales Q/Q | - |
| Insider Own | 55.54% | Inst Own | 13.08% |
| Insider Trans | 0.00% | Inst Trans | - |
| Short Float | - | Earnings | - |
| Analyst Recom | - | Target Price | - |
| Avg Volume | 341.09K | 52W Range | 13.90 - 16.00 |
|
|
|
|
Contineum Therapeutics, Inc. is a clinical stage biopharmaceutical company, which focuses on discovering and developing novel, oral small molecule therapies for neuroscience, inflammation, and immunology indications with high unmet need. The company was founded by Daniel S. Lorrain on May 9, 2017 and is headquartered in San Diego, CA. |
|
| |
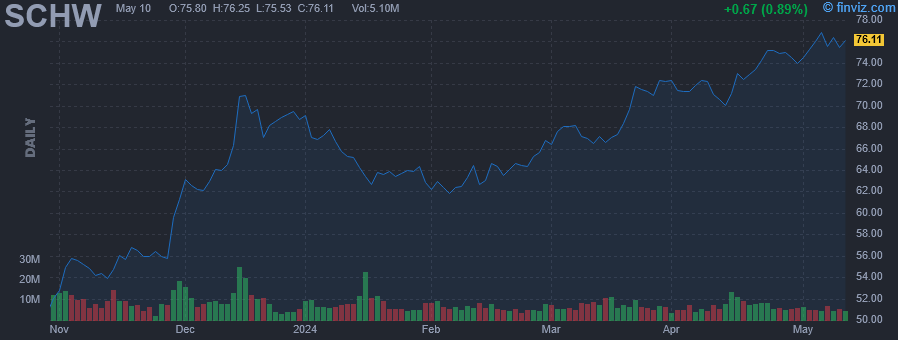 |
| Market Cap | 128.76B | EPS (ttm) | 2.39 |
| P/E | 30.39 | EPS this Y | 9.64% |
| Forward P/E | 16.33 | EPS next Y | 29.33% |
| PEG | 2.13 | EPS past 5Y | 0.75% |
| P/S | 5.03 | EPS next 5Y | 14.24% |
| P/B | 4.05 | EPS Q/Q | -18.29% |
| Dividend | 1.43% | Sales Q/Q | 1.35% |
| Insider Own | 5.94% | Inst Own | 85.25% |
| Insider Trans | -0.37% | Inst Trans | -0.60% |
| Short Float | 0.90% | Earnings | Apr 15/b |
| Analyst Recom | 1.96 | Target Price | 78.80 |
| Avg Volume | 7.59M | 52W Range | 45.65 - 73.65 |
|
|
|
|
The Charles Schwab Corp. is a savings and loan holding company, which engages in the provision of wealth management, securities brokerage, banking, asset management, custody, and financial advisory services. It operates through the Investor Services and Advisor Services segments. The Investor Services segment includes retail brokerage and banking services to individual investors, and retirement plan services, as well as other corporate brokerage services, to businesses and their employees. The Advisor Services segment provides custodial, trading, retirement business, and support services, as well as retirement business services to independent registered investment advisors, independent retirement advisors, and record keepers. The company was founded by Charles R. Schwab in 1986 and is headquartered in Westlake, TX. |
| Insider Trading |
Relationship |
Date |
Transaction |
Cost |
#Shares |
Value ($) |
#Shares Total |
SEC Form 4 |
| Ellis Stephen A | Director | Mar 26 '24 | Option Exercise | 27.45 | 2,165 | 59,429 | 7,395 | Mar 28 09:40 PM | | ADAMS JOHN K JR | Director | Mar 22 '24 | Option Exercise | 30.08 | 15,701 | 472,330 | 60,152 | Mar 26 07:51 PM | | ADAMS JOHN K JR | Director | Mar 22 '24 | Sale | 72.64 | 15,701 | 1,140,539 | 44,451 | Mar 26 07:51 PM | | Murtagh Nigel J | Chief Risk Officer | Mar 21 '24 | Option Exercise | 26.39 | 12,948 | 341,698 | 94,394 | Mar 25 09:05 PM | | Craig Jonathan M. | Please see remarks | Mar 21 '24 | Option Exercise | 26.39 | 4,977 | 131,343 | 0 | Mar 25 07:28 PM |
|
|
|
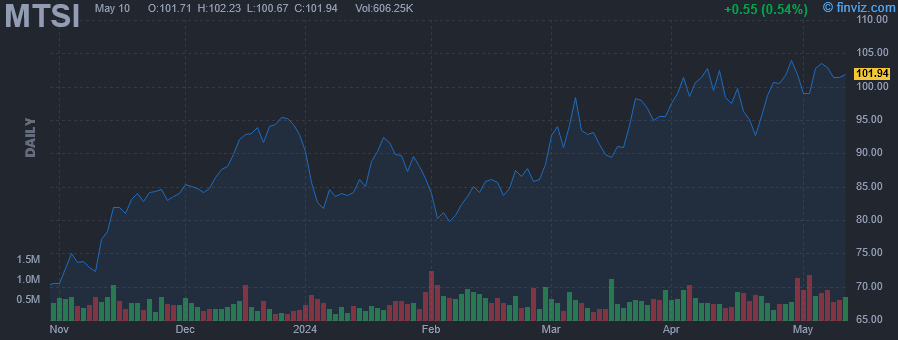 |
| Market Cap | 6.95B | EPS (ttm) | 1.04 |
| P/E | 92.65 | EPS this Y | -5.26% |
| Forward P/E | 29.32 | EPS next Y | 28.54% |
| PEG | 6.18 | EPS past 5Y | - |
| P/S | 11.11 | EPS next 5Y | 15.00% |
| P/B | 6.79 | EPS Q/Q | -58.10% |
| Dividend | - | Sales Q/Q | -12.75% |
| Insider Own | 21.19% | Inst Own | 80.61% |
| Insider Trans | -9.79% | Inst Trans | 4.81% |
| Short Float | 7.62% | Earnings | Feb 01/b |
| Analyst Recom | 2.00 | Target Price | 96.08 |
| Avg Volume | 526.09K | 52W Range | 48.53 - 104.59 |
|
|
|
|
MACOM Technology Solutions Holdings, Inc. engages in designing, developing, manufacturing, and marketing semiconductors and modules. The firm is involved in the provision of products for telecommunications (Telecom), industrial and defense (I&D), and data center industries. The company was founded on March 25, 2009 and is headquartered in Lowell, MA. |
| Insider Trading |
Relationship |
Date |
Transaction |
Cost |
#Shares |
Value ($) |
#Shares Total |
SEC Form 4 |
| Dennehy Robert | SVP, Operations | Mar 15 '24 | Sale | 88.88 | 2,370 | 210,646 | 32,827 | Mar 19 05:19 PM | | Hwang Donghyun Thomas | SVP, Global Sales | Mar 11 '24 | Sale | 92.24 | 9,397 | 866,823 | 48,325 | Mar 13 04:50 PM | | OCAMPO SUSAN | Director | Feb 29 '24 | Sale | 88.00 | 34,186 | 3,008,368 | 6,886,661 | Feb 29 07:00 PM | | OCAMPO SUSAN | Director | Feb 27 '24 | Sale | 88.03 | 4,370 | 384,691 | 6,920,847 | Feb 29 07:00 PM | | OCAMPO SUSAN | Director | Feb 26 '24 | Sale | 88.00 | 20,733 | 1,824,504 | 6,925,217 | Feb 26 07:37 PM |
|
|
| |
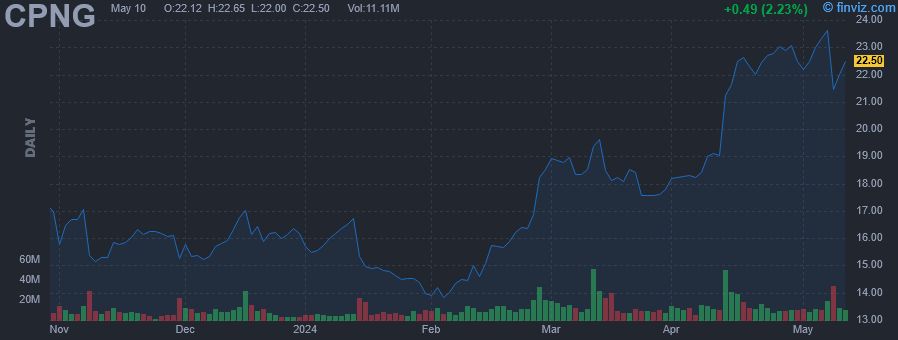 |
| Market Cap | 40.58B | EPS (ttm) | 0.75 |
| P/E | 30.10 | EPS this Y | -61.51% |
| Forward P/E | 36.76 | EPS next Y | 113.23% |
| PEG | - | EPS past 5Y | - |
| P/S | 1.66 | EPS next 5Y | - |
| P/B | 9.91 | EPS Q/Q | 902.11% |
| Dividend | - | Sales Q/Q | 23.17% |
| Insider Own | 34.58% | Inst Own | 50.19% |
| Insider Trans | -11.22% | Inst Trans | 0.00% |
| Short Float | 2.46% | Earnings | Feb 27/a |
| Analyst Recom | 1.71 | Target Price | 22.93 |
| Avg Volume | 14.22M | 52W Range | 13.51 - 22.83 |
|
|
|
|
Coupang, Inc. engages in operating an e-commerce platform. It operates through the following segments: Product Commerce and Developing Offerings segments. The Product Commerce segment provides core retail and marketplace offerings and Rocket Fresh, as well as advertising products associated with these offerings. The Developing Offerings segment includes nascent offerings and services, including Coupang Eats, Coupang Play, international and fintech initiatives. The company was founded in 2010 and is headquartered in Seattle, WA. |
| Insider Trading |
Relationship |
Date |
Transaction |
Cost |
#Shares |
Value ($) |
#Shares Total |
SEC Form 4 |
| Rogers Harold | See Remarks | Mar 18 '24 | Sale | 18.25 | 139,080 | 2,538,210 | 394,192 | Mar 19 05:21 PM | | MEHTA NEIL | Director | Mar 14 '24 | Sale | 18.68 | 1,600,000 | 29,894,831 | 48,006,135 | Mar 18 09:32 PM | | SVF Investments (UK) Ltd | 10% Owner | Mar 13 '24 | Sale | 19.60 | 15,000,000 | 294,000,000 | 349,542,259 | Mar 14 09:00 PM | | SVF Investments (UK) Ltd | 10% Owner | Mar 12 '24 | Sale | 19.01 | 31,614,154 | 600,927,187 | 364,542,259 | Mar 14 09:00 PM | | Kang Hanseung | Rep Director, Business Mngmt | Mar 12 '24 | Sale | 19.25 | 48,000 | 924,000 | 519,987 | Mar 13 04:48 PM |
|
|
|
 |
| Market Cap | 121.99M | EPS (ttm) | 0.20 |
| P/E | 57.88 | EPS this Y | - |
| Forward P/E | - | EPS next Y | - |
| PEG | - | EPS past 5Y | - |
| P/S | - | EPS next 5Y | - |
| P/B | 2.09 | EPS Q/Q | 171.63% |
| Dividend | - | Sales Q/Q | - |
| Insider Own | 55.13% | Inst Own | 66.38% |
| Insider Trans | -1.78% | Inst Trans | 4.19% |
| Short Float | 0.00% | Earnings | - |
| Analyst Recom | - | Target Price | - |
| Avg Volume | 46.41K | 52W Range | 10.61 - 11.50 |
|
|
|
|
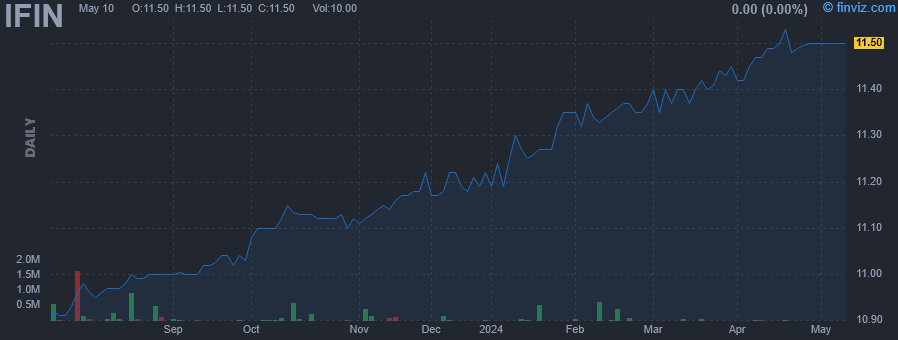
InFinT Acquisition Corp. is a blank check company. It engages in the business of effecting a business combination with one or more businesses. The company was founded by Kevin Chen on March 8, 2021 and is headquartered in New York, NY. |
| Insider Trading |
Relationship |
Date |
Transaction |
Cost |
#Shares |
Value ($) |
#Shares Total |
SEC Form 4 |
| COWEN INC. | 10% Owner | Feb 22 '24 | Sale | 11.35 | 100,574 | 1,141,515 | 274,304 | Feb 23 04:34 PM | | COWEN INC. | 10% Owner | Feb 21 '24 | Sale | 11.36 | 5,000 | 56,800 | 374,878 | Feb 23 04:34 PM |
|
|
|
 |
| Market Cap | 836.59M | EPS (ttm) | 1.59 |
| P/E | 10.38 | EPS this Y | 10.30% |
| Forward P/E | 8.94 | EPS next Y | -8.54% |
| PEG | 5.19 | EPS past 5Y | 20.30% |
| P/S | 3.46 | EPS next 5Y | 2.00% |
| P/B | 0.97 | EPS Q/Q | 149.80% |
| Dividend | 9.10% | Sales Q/Q | 12.00% |
| Insider Own | 0.20% | Inst Own | 22.30% |
| Insider Trans | 0.00% | Inst Trans | -6.13% |
| Short Float | 0.73% | Earnings | May 07/a |
| Analyst Recom | 2.60 | Target Price | 16.12 |
| Avg Volume | 205.02K | 52W Range | 12.87 - 16.64 |
|
|
|
Apr-11-24 04:05PM
|
Carlyle Secured Lending, Inc. Schedules Earnings Release and Quarterly Earnings Call to Discuss its First Quarter Ended March 31, 2024 Financial Results
(GlobeNewswire) |
|
Mar-04-24 06:05AM
|
Carlyle Secured Lending, Inc. Names Justin Plouffe CEO and Member of the Board of Directors
(GlobeNewswire) |
|
Feb-26-24 05:49PM
|
Carlyle Secured Lending, Inc. Announces Fourth Quarter and Full Year 2023 Financial Results, Increases Base Dividend to $0.40 Per Common Share and Declares First Quarter 2024 Dividends of $0.48 Per Common Share
(GlobeNewswire) |
|
05:31PM
|
Carlyle Secured Lending Inc (CGBD) Announces Dividend Increase and Steady Performance in Q4 and ...
(GuruFocus.com) |
|
Jan-23-24 04:39PM
|
Carlyle Secured Lending, Inc. Schedules Fourth Quarter and Full Year 2023 Financial Results and Investor Conference Call
(GlobeNewswire) |
|
Jan-17-24 05:20PM
|
Carlyle Secured Lending, Inc. Schedules Fourth Quarter and Full Year 2023 Financial Results and Investor Conference Call
(GlobeNewswire) |
|
Nov-13-23 03:31PM
|
Carlyle Secured Lending, Inc. Prices Public Offering of 8.20% Notes Due 2028
(GlobeNewswire) |
|
Nov-07-23 05:31PM
|
Carlyle Secured Lending, Inc. Announces Third Quarter 2023 Financial Results, Declares Fourth Quarter 2023 Dividends of $0.44 Per Common Share
(GlobeNewswire) |
|
Oct-13-23 11:02AM
|
Carlyle Secured Lending, Inc. Schedules Third Quarter 2023 Financial Results and Investor Conference Call
(GlobeNewswire) |
|
Aug-08-23 04:24PM
|
Carlyle Secured Lending, Inc. Announces Second Quarter 2023 Financial Results, Declares Third Quarter 2023 Dividends of $0.44 Per Common Share
(GlobeNewswire) |
|
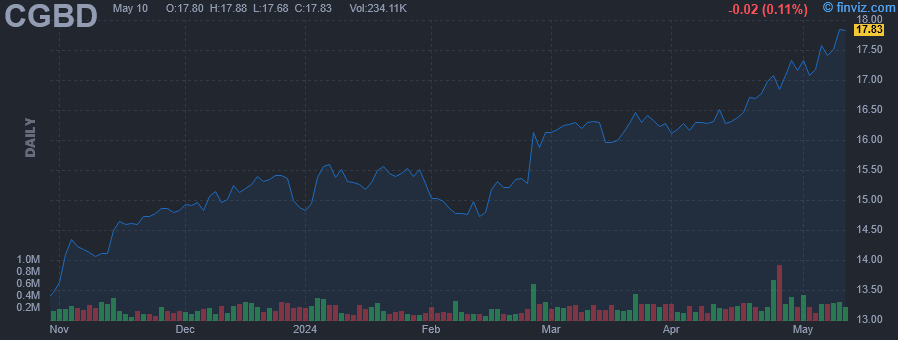
Carlyle Secured Lending, Inc. is business development company specializing in first lien debt, senior secured loans, second lien senior secured loan unsecured debt, mezzanine debt and investments in equities. It specializes in directly investing. It specializes in middle market. It targets healthcare and pharmaceutical, aerospace and defense, high tech industries, business services, software, beverage food and tobacco, hotel gamming and leisure, banking finance insurance and in real estate sector. The fund seeks to invest across United States of America, Luxembourg, Cayman Islands, Cyprus, and United Kingdom. It invests in companies with EBITDA between $25 million and $100 million. |
| Insider Trading |
Relationship |
Date |
Transaction |
Cost |
#Shares |
Value ($) |
#Shares Total |
SEC Form 4 |
| Popov Alexander | VP and Head of Illiquid Credit | Aug 30 '23 | Buy | 14.78 | 5,000 | 73,900 | 32,977 | Aug 31 04:27 PM | | LeeKong Aren C. | CEO and President | Jun 09 '23 | Buy | 14.74 | 3,394 | 50,028 | 25,156 | Jun 13 04:38 PM | | LeeKong Aren C. | CEO and President | Jun 05 '23 | Buy | 14.19 | 6 | 85 | 21,762 | Jun 06 04:00 PM | | LeeKong Aren C. | CEO and President | Jun 01 '23 | Buy | 13.73 | 1,454 | 19,963 | 21,756 | Jun 02 04:06 PM | | LeeKong Aren C. | CEO and President | May 31 '23 | Buy | 13.65 | 1,454 | 19,847 | 20,302 | Jun 01 04:16 PM |
|
|
|
