 |
| Market Cap | 36.24B | EPS (ttm) | 1.04 |
| P/E | 93.08 | EPS this Y | 34.34% |
| Forward P/E | 31.64 | EPS next Y | 28.66% |
| PEG | 3.29 | EPS past 5Y | 82.85% |
| P/S | 5.19 | EPS next 5Y | 28.30% |
| P/B | 25.98 | EPS Q/Q | -112.91% |
| Dividend | 0.07% | Sales Q/Q | 7.76% |
| Insider Own | 3.52% | Inst Own | 83.15% |
| Insider Trans | -20.80% | Inst Trans | 3.02% |
| Short Float | 3.59% | Earnings | Apr 24/b |
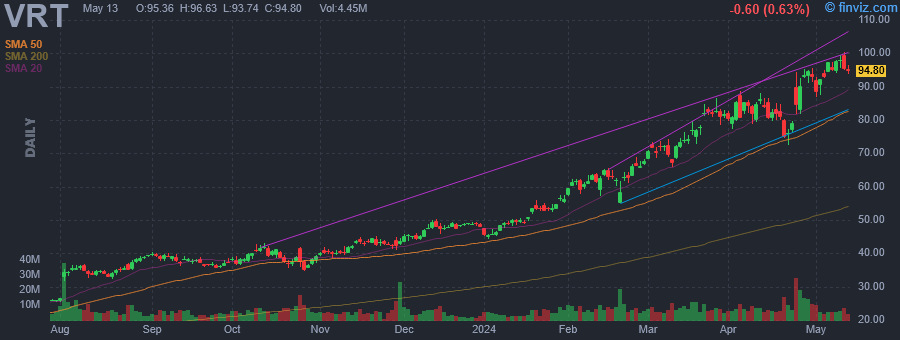
| Analyst Recom | 1.21 | Target Price | 102.03 |
| Avg Volume | 8.96M | 52W Range | 15.18 - 104.76 |
|
|
|
|
Vertiv Holdings Co. engages in the design, manufacture, and service of critical digital infrastructure technology that powers, cools, deploys, secures and maintains electronics that process, store and transmit data. It also offers power management products, thermal management products, integrated rack systems, modular solutions, and management systems for monitoring and controlling digital infrastructure. It operates through the following segments: Americas, Asia Pacific, and Europe, Middle East and Africa (EMEA). The Americas segment offers critical infrastructure and solutions, integrated rack solutions, and services and spares. The Asia Pacific segment includes products and services sold for applications within the data center, communication networks, and commercial or industrial markets throughout China, India, and the rest of Asia. The EMEA segment sells products and services for applications within the data center, communication networks and commercial/industrial markets. The company was founded on February 7, 2020 and is headquartered in Columbus, OH. |
| Insider Trading |
Relationship |
Date |
Transaction |
Cost |
#Shares |
Value ($) |
#Shares Total |
SEC Form 4 |
| FRADIN ROGER | Director | May 15 '24 | Sale | 103.91 | 33,333 | 3,463,692 | 100,000 | May 17 05:03 PM | | FRADIN ROGER | Director | May 15 '24 | Sale | 103.86 | 16,667 | 1,731,110 | 218,333 | May 17 05:03 PM | | Cui Yibin Edward | President - Greater China | May 04 '24 | Sale | 94.39 | 668 | 63,053 | 19,452 | May 07 09:02 PM | | Karlborg Anders | EVP, Man., Logistics and Op Ex | May 03 '24 | Option Exercise | 12.05 | 46,206 | 556,782 | 69,209 | May 07 09:04 PM | | Karlborg Anders | EVP, Man., Logistics and Op Ex | May 03 '24 | Sale | 93.75 | 46,206 | 4,331,790 | 23,003 | May 07 09:04 PM |
|
|
 |
 |
| Market Cap | 50.97B | EPS (ttm) | 3.47 |
| P/E | 27.19 | EPS this Y | -46.38% |
| Forward P/E | 22.39 | EPS next Y | 59.70% |
| PEG | - | EPS past 5Y | 37.42% |
| P/S | 6.68 | EPS next 5Y | -6.30% |
| P/B | 7.20 | EPS Q/Q | -74.32% |
| Dividend | 1.81% | Sales Q/Q | -40.62% |
| Insider Own | 2.08% | Inst Own | 93.32% |
| Insider Trans | -0.52% | Inst Trans | -2.55% |
| Short Float | 5.39% | Earnings | May 06/a |
| Analyst Recom | 1.69 | Target Price | 100.27 |
| Avg Volume | 5.33M | 52W Range | 68.75 - 96.14 |
|
|
|
|
Microchip Technology, Inc. engages in the provision of semiconductor products. It operates through the Semiconductor Products and Technology Licensing segments. The Semiconductor Products segment is involved in designing, developing, manufacturing, and marketing microcontrollers, development tools and analog, interface, mixed signal, connectivity devices, and timing products. The Technology Licensing segment offers license fees and royalties associated with technology licenses for the use of SuperFlash embedded flash and Smartbits one-time programmable technologies. The company was founded on February 14, 1989, and is headquartered in Chandler, AZ. |
| Insider Trading |
Relationship |
Date |
Transaction |
Cost |
#Shares |
Value ($) |
#Shares Total |
SEC Form 4 |
| DREHOBL STEPHEN V | Senior VP, MCU8/MCU16 BU | May 16 '24 | Sale | 95.06 | 7,830 | 744,320 | 79,509 | May 17 05:03 PM | | SANGHI STEVE | Executive Chair | May 15 '24 | Option Exercise | 95.36 | 23,138 | 2,206,440 | 10,107,171 | May 17 05:04 PM | | MOORTHY GANESH | President & CEO | May 15 '24 | Option Exercise | 95.36 | 17,460 | 1,664,986 | 803,880 | May 17 05:04 PM | | DREHOBL STEPHEN V | Senior VP, MCU8/MCU16 BU | May 15 '24 | Option Exercise | 95.36 | 7,181 | 684,780 | 87,863 | May 17 05:03 PM | | Bjornholt James Eric | Senior VP and CFO | May 15 '24 | Option Exercise | 95.36 | 5,581 | 532,204 | 37,112 | May 17 05:02 PM |
|
|
|
 |
| Market Cap | 10.45B | EPS (ttm) | -5.76 |
| P/E | - | EPS this Y | 12.52% |
| Forward P/E | - | EPS next Y | 35.02% |
| PEG | - | EPS past 5Y | -86.59% |
| P/S | 2.10 | EPS next 5Y | - |
| P/B | 1.29 | EPS Q/Q | -1.93% |
| Dividend | - | Sales Q/Q | 82.15% |
| Insider Own | 28.33% | Inst Own | 44.73% |
| Insider Trans | -0.02% | Inst Trans | 7.70% |
| Short Float | 20.58% | Earnings | May 07/a |
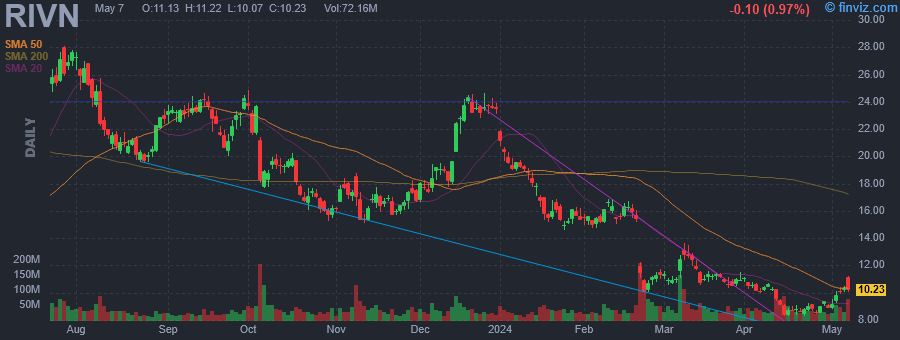
| Analyst Recom | 2.14 | Target Price | 14.49 |
| Avg Volume | 49.07M | 52W Range | 8.26 - 28.06 |
|
|
|
|
Rivian Automotive, Inc. engages in the design, development, and manufacture of category-defining electric vehicles and accessories. The company was founded by Robert J. Scaringe in June 2009 and is headquartered in Irvine, CA. |
| Insider Trading |
Relationship |
Date |
Transaction |
Cost |
#Shares |
Value ($) |
#Shares Total |
SEC Form 4 |
| McDonough Claire | Chief Financial Officer | May 16 '24 | Sale | 10.25 | 3,210 | 32,902 | 405,422 | May 17 05:01 PM | | Baker Jeff | Chief Accounting Officer | Mar 11 '24 | Sale | 13.18 | 31,425 | 414,219 | 52,415 | Mar 12 08:47 PM | | Gruner Kjell | Chief Commercial Officer | Mar 08 '24 | Sale | 12.81 | 19,935 | 255,367 | 407,787 | Mar 12 08:47 PM | | McDonough Claire | Chief Financial Officer | Feb 16 '24 | Sale | 16.20 | 2,946 | 47,725 | 155,749 | Feb 20 07:17 PM | | McDonough Claire | Chief Financial Officer | Nov 16 '23 | Sale | 17.08 | 3,265 | 55,766 | 173,030 | Nov 17 08:00 PM |
|
|
| |
 |
| Market Cap | 10.63B | EPS (ttm) | -4.00 |
| P/E | - | EPS this Y | 25.39% |
| Forward P/E | 17.27 | EPS next Y | 16.99% |
| PEG | - | EPS past 5Y | -34.56% |
| P/S | 2.53 | EPS next 5Y | 19.60% |
| P/B | 1.17 | EPS Q/Q | 83.34% |
| Dividend | - | Sales Q/Q | 4.02% |
| Insider Own | 7.41% | Inst Own | 79.67% |
| Insider Trans | -0.51% | Inst Trans | 1.61% |
| Short Float | 1.58% | Earnings | May 07/a |
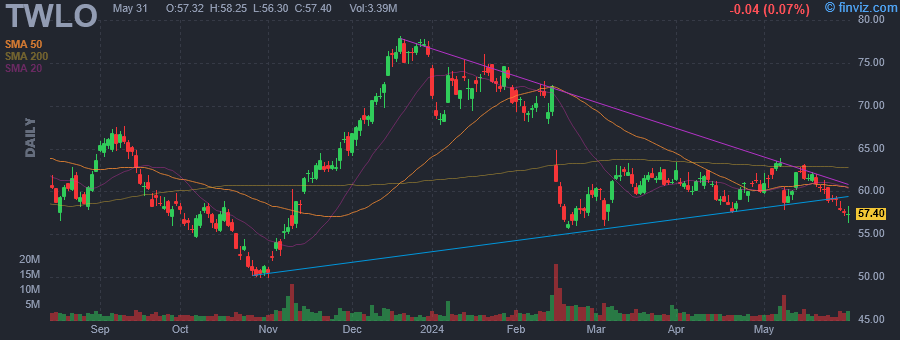
| Analyst Recom | 2.26 | Target Price | 69.29 |
| Avg Volume | 3.10M | 52W Range | 47.37 - 78.16 |
|
|
|
May-16-24 09:00AM
|
Investors Heavily Search Twilio Inc. (TWLO): Here is What You Need to Know
(Zacks) |
|
May-09-24 01:02AM
|
Twilio Inc (TWLO): A Strategic SWOT Insight
(GuruFocus.com) |
|
May-08-24 04:24PM
|
These Stocks Moved the Most Today: Shopify, Uber, Lyft, Intel, Tesla, Tripadvisor, DoubleVerify, ZoomInfo, Affirm, and More
(Barrons.com) -7.50% |
|
04:10PM
|
Twilio to Participate in 52nd Annual J.P. Morgan Global Technology, Media and Communications Conference
(Business Wire) |
|
02:20PM
|
These Stocks Are Moving the Most Today: Shopify, Uber, Lyft, Intel, Tesla, Tripadvisor, DoubleVerify, ZoomInfo, Affirm, and More
(Barrons.com) |
|
12:22PM
|
Why Twilio (TWLO) Stock Is Trading Lower Today
(StockStory) |
|
12:18PM
|
Baird Adjusts Price Target on Twilio to $65 From $70, Keeps Neutral Rating
(MT Newswires) |
|
11:51AM
|
Twilio Inc. (NYSE:TWLO) Q1 2024 Earnings Call Transcript
(Insider Monkey) |
|
11:00AM
|
Twilio Q1 Results Likely Mark Start of Recovery, Macquarie Says
(MT Newswires) |
|
09:50AM
|
Twilio (TWLO) is a Top-Ranked Momentum Stock: Should You Buy?
(Zacks) |
|
Twilio, Inc. engages in the development of communications software, cloud-based platforms, and services. It operates through Twilio Communications and Twilio Segments. The Twilio Communications segment includes the platforms Messaging and Voice. The Twilio Segment involves Segment, Engage, Flex, Email, and others. The company was founded by John Wolthuis, Jeffery G. Lawson, and Evan Cooke in March 2008 and is headquartered in San Francisco, CA. |
| Insider Trading |
Relationship |
Date |
Transaction |
Cost |
#Shares |
Value ($) |
#Shares Total |
SEC Form 4 |
| Wagner Dana | Chief Legal Officer, Secretary | May 15 '24 | Sale | 61.69 | 2,009 | 123,939 | 164,976 | May 17 05:01 PM | | Viggiano Aidan | Chief Financial Officer | May 15 '24 | Sale | 61.68 | 1,980 | 122,135 | 229,228 | May 17 04:57 PM | | Viggiano Aidan | Chief Financial Officer | Apr 04 '24 | Sale | 60.79 | 3,375 | 205,166 | 231,036 | Apr 08 05:54 PM | | Wagner Dana | Chief Legal Officer, Secretary | Apr 04 '24 | Sale | 61.43 | 841 | 51,664 | 166,773 | Apr 08 06:03 PM | | Shipchandler Khozema | Chief Executive Officer | Apr 01 '24 | Sale | 62.13 | 10,961 | 681,058 | 335,982 | Apr 03 06:44 PM |
|
|
|
 |
| Market Cap | 8.85B | EPS (ttm) | -0.02 |
| P/E | - | EPS this Y | 21.20% |
| Forward P/E | 24.06 | EPS next Y | 10.04% |
| PEG | - | EPS past 5Y | 6.36% |
| P/S | 5.47 | EPS next 5Y | 7.70% |
| P/B | 3.91 | EPS Q/Q | 107.32% |
| Dividend | - | Sales Q/Q | 6.34% |
| Insider Own | 56.05% | Inst Own | 43.15% |
| Insider Trans | -0.32% | Inst Trans | 1.12% |
| Short Float | 4.22% | Earnings | May 01/a |
| Analyst Recom | 1.65 | Target Price | 38.42 |
| Avg Volume | 2.04M | 52W Range | 15.16 - 39.80 |
|
|
|
|
Informatica, Inc. engages in the development of an intelligent data management cloud platform. Its software connects, manages, and unifies data across any multi-cloud hybrid system. The company was founded in 1993 and is headquartered in Redwood City, CA. |
| Insider Trading |
Relationship |
Date |
Transaction |
Cost |
#Shares |
Value ($) |
#Shares Total |
SEC Form 4 |
| Schweitzer John Arthur | EVP & CHIEF REVENUE OFFICER | May 16 '24 | Sale | 29.97 | 8,358 | 250,456 | 454,207 | May 17 05:01 PM | | Schweitzer John Arthur | EVP & CHIEF REVENUE OFFICER | May 15 '24 | Option Exercise | 20.00 | 56,000 | 1,120,000 | 518,565 | May 17 05:01 PM | | Pellowski Mark | CHIEF ACCOUNTING OFFICER | May 15 '24 | Option Exercise | 8.70 | 10,026 | 87,226 | 156,830 | May 17 05:01 PM | | Schweitzer John Arthur | EVP & CHIEF REVENUE OFFICER | May 15 '24 | Sale | 30.29 | 56,000 | 1,696,184 | 462,565 | May 17 05:01 PM | | Pellowski Mark | CHIEF ACCOUNTING OFFICER | May 15 '24 | Sale | 30.28 | 10,026 | 303,567 | 146,804 | May 17 05:01 PM |
|
|
| |
 |
| Market Cap | 1.65B | EPS (ttm) | -0.58 |
| P/E | - | EPS this Y | 52.31% |
| Forward P/E | 12.62 | EPS next Y | 13.23% |
| PEG | - | EPS past 5Y | 1.08% |
| P/S | 2.58 | EPS next 5Y | - |
| P/B | 2.37 | EPS Q/Q | 82.61% |
| Dividend | - | Sales Q/Q | 14.73% |
| Insider Own | 11.59% | Inst Own | 74.15% |
| Insider Trans | -1.41% | Inst Trans | 0.85% |
| Short Float | 4.64% | Earnings | May 08/a |
| Analyst Recom | 1.40 | Target Price | 15.60 |
| Avg Volume | 1.61M | 52W Range | 6.28 - 15.73 |
|
|
|
|
Magnite, Inc. provides a technology solution to automate the purchase and sale of digital advertising inventory for buyers and sellers. It features applications and services for digital advertising sellers including websites, mobile applications, and other digital media properties. The company was founded by Frank Addante, Duc Chau, Craig Roah, Julie Mattern and Brian D. Baumgart on April 20, 2007 and is headquartered in New York, NY. |
| Insider Trading |
Relationship |
Date |
Transaction |
Cost |
#Shares |
Value ($) |
#Shares Total |
SEC Form 4 |
| Soroca Adam Lee | CHIEF PRODUCT OFFICER | May 16 '24 | Sale | 12.00 | 23,453 | 281,436 | 461,252 | May 17 05:00 PM | | Day David | CHIEF FINANCIAL OFFICER | May 16 '24 | Sale | 12.00 | 19,370 | 232,440 | 491,863 | May 17 05:00 PM | | Buckley Sean Patrick | CHIEF REVENUE OFFICER | May 16 '24 | Sale | 12.50 | 16,925 | 211,562 | 407,557 | May 17 05:00 PM | | Buonasera David | CHIEF TECHNOLOGY OFFICER | May 16 '24 | Sale | 12.50 | 5,500 | 68,750 | 271,862 | May 17 04:15 PM | | BARRETT MICHAEL G. | CEO | May 15 '24 | Sale | 9.02 | 75,000 | 676,500 | 1,152,493 | May 17 05:01 PM |
|
|
|
 |
| Market Cap | 104.87M | EPS (ttm) | -0.27 |
| P/E | - | EPS this Y | 14.29% |
| Forward P/E | - | EPS next Y | 75.00% |
| PEG | - | EPS past 5Y | 59.45% |
| P/S | 5.36 | EPS next 5Y | -0.47% |
| P/B | 9.61 | EPS Q/Q | 4.48% |
| Dividend | - | Sales Q/Q | 8.93% |
| Insider Own | 22.65% | Inst Own | 34.63% |
| Insider Trans | 1.00% | Inst Trans | -0.49% |
| Short Float | 2.72% | Earnings | May 08/a |
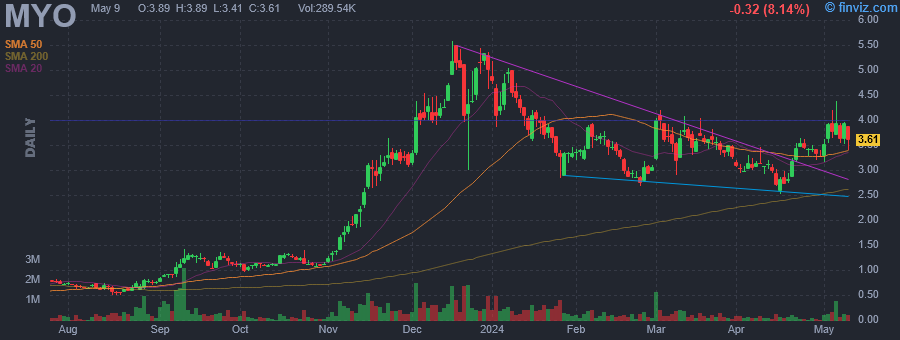
| Analyst Recom | 1.00 | Target Price | 6.50 |
| Avg Volume | 275.86K | 52W Range | 0.37 - 5.58 |
|
|
|
|
Myomo, Inc. is a wearable medical robotics company, which engages in the business of developing, designing, and producing myoelectric orthotics for people with neuromuscular disorders. The firm is also involved in selling products through various other sales channels including through orthotics and prosthetics providers, veterans' administration, and to distributors in certain accounts and geographic markets. The company was founded by Stephen Kelly, John McBean, Mira Sahney, and Kailas N. Narendran on September 1, 2004 and is headquartered in Boston, MA. |
| Insider Trading |
Relationship |
Date |
Transaction |
Cost |
#Shares |
Value ($) |
#Shares Total |
SEC Form 4 |
| Kovelman Harry | Chief Medical Officer | May 15 '24 | Sale | 3.69 | 35,426 | 130,839 | 98,009 | May 17 04:57 PM | | KIRK THOMAS F | Director | Mar 14 '24 | Buy | 3.50 | 50,000 | 175,000 | 186,499 | Mar 18 07:48 AM | | KIRK THOMAS F | Director | Nov 20 '23 | Buy | 3.10 | 50,000 | 155,000 | 136,499 | Dec 14 07:46 PM | | Morris Milton Mayo | Director | Sep 08 '23 | Buy | 1.06 | 15,000 | 15,867 | 77,933 | Sep 11 05:05 PM | | GUDONIS PAUL R | Chief Executive Officer | Aug 30 '23 | Buy | 0.74 | 48,400 | 36,039 | 878,245 | Aug 31 06:26 PM |
|
|
| |
 |
| Market Cap | 2.74B | EPS (ttm) | -0.60 |
| P/E | - | EPS this Y | 284.83% |
| Forward P/E | 18.45 | EPS next Y | 86.64% |
| PEG | - | EPS past 5Y | -13.65% |
| P/S | 2.72 | EPS next 5Y | - |
| P/B | 4.98 | EPS Q/Q | 31.35% |
| Dividend | - | Sales Q/Q | 32.01% |
| Insider Own | 28.25% | Inst Own | 56.80% |
| Insider Trans | -0.86% | Inst Trans | 12.15% |
| Short Float | 5.37% | Earnings | May 01/a |
| Analyst Recom | 1.45 | Target Price | 22.30 |
| Avg Volume | 1.60M | 52W Range | 13.60 - 27.95 |
|
|
|
|
Remitly Global, Inc. engages in the provision of digital financial services for immigrants and their families. The company was founded by Matthew B. Oppenheimer and Joshua Hug on October 3, 2018 and is headquartered in Seattle, WA. |
| Insider Trading |
Relationship |
Date |
Transaction |
Cost |
#Shares |
Value ($) |
#Shares Total |
SEC Form 4 |
| Yoakum Rene | EVP, Customer and Culture | May 15 '24 | Option Exercise | 1.70 | 15,000 | 25,500 | 96,137 | May 17 04:57 PM | | Yoakum Rene | EVP, Customer and Culture | May 15 '24 | Sale | 14.24 | 15,000 | 213,530 | 81,137 | May 17 04:57 PM | | Oppenheimer Matthew B. | Chief Executive Officer | May 14 '24 | Sale | 14.24 | 10,416 | 148,324 | 4,636,357 | May 15 04:20 PM | | Oppenheimer Matthew B. | Chief Executive Officer | May 13 '24 | Sale | 14.32 | 10,416 | 149,157 | 4,646,773 | May 15 04:20 PM | | Oppenheimer Matthew B. | Chief Executive Officer | Apr 25 '24 | Sale | 17.94 | 10,416 | 186,863 | 4,657,189 | Apr 26 04:40 PM |
|
|
|
 |
| Market Cap | 670.82M | EPS (ttm) | 5.62 |
| P/E | 7.76 | EPS this Y | -6.84% |
| Forward P/E | 6.60 | EPS next Y | 6.47% |
| PEG | 2.04 | EPS past 5Y | 7.35% |
| P/S | 0.81 | EPS next 5Y | 3.80% |
| P/B | - | EPS Q/Q | -35.04% |
| Dividend | 4.98% | Sales Q/Q | -3.52% |
| Insider Own | 2.75% | Inst Own | 96.54% |
| Insider Trans | -0.27% | Inst Trans | -3.06% |
| Short Float | 6.76% | Earnings | May 08/b |
| Analyst Recom | 2.00 | Target Price | 56.12 |
| Avg Volume | 313.67K | 52W Range | 41.76 - 69.05 |
|
|
|
|
Dine Brands Global, Inc. owns and franchises casual and family dining restaurants. It operates through the following segments: Franchise, Rental, Company Restaurant, and Financing Operations. The Franchise Operations segment consists of royalties, fees, and other income for Applebee's and IHOP franchised and area licensed restaurants. The Rental Operations segment covers rental income derived from lease or sublease agreements covering IHOP and Applebee's franchised restaurants. The Company Restaurant segment includes retail sales from IHOP company-operated restaurants. The Financing Operations segment includes interest income from receivables for equipment leases and franchise fee notes generally associated with IHOP franchised restaurants developed before 2003. The company was founded by Jerry Lapin, Al Lapin, Jr. and Albert Kallis on July 7, 1958 and is headquartered in Pasadena, CA. |
| Insider Trading |
Relationship |
Date |
Transaction |
Cost |
#Shares |
Value ($) |
#Shares Total |
SEC Form 4 |
| Hyter Michael | Director | May 15 '24 | Sale | 45.47 | 1,155 | 52,518 | 3,381 | May 17 04:55 PM | | Berk Howard M | Director | Mar 01 '24 | Option Exercise | 49.06 | 1,663 | 81,610 | 35,078 | Mar 05 09:53 PM | | COLLYNS SUSAN | Director | Mar 01 '24 | Option Exercise | 49.06 | 1,663 | 81,610 | 6,326 | Mar 05 09:53 PM | | DAHL RICHARD J | Director | Mar 01 '24 | Option Exercise | 49.06 | 1,663 | 81,610 | 1,663 | Mar 05 09:54 PM | | Hyter Michael | Director | Mar 01 '24 | Option Exercise | 49.06 | 1,663 | 81,610 | 4,536 | Mar 05 09:54 PM |
|
|
|
 |
| Market Cap | 5.49B | EPS (ttm) | 4.96 |
| P/E | 9.94 | EPS this Y | -16.18% |
| Forward P/E | 9.54 | EPS next Y | 19.90% |
| PEG | 0.38 | EPS past 5Y | 2.32% |
| P/S | 2.16 | EPS next 5Y | 26.16% |
| P/B | 0.76 | EPS Q/Q | -17.87% |
| Dividend | 1.78% | Sales Q/Q | 2.89% |
| Insider Own | 7.11% | Inst Own | 100.16% |
| Insider Trans | -1.73% | Inst Trans | -2.71% |
| Short Float | 3.98% | Earnings | May 06/a |
| Analyst Recom | 1.43 | Target Price | 56.29 |
| Avg Volume | 1.59M | 52W Range | 33.33 - 52.31 |
|
|
|
|
Air Lease Corp. engages in the provision of an aircraft leasing business. It focuses on purchasing new commercial jet transport aircraft directly from aircraft manufacturers and leasing those aircraft to airlines throughout the world with the intention to generate attractive returns on equity. The company was founded by Steven F. Udvar-Hazy in January 2010 and is headquartered in Los Angeles, CA. |
| Insider Trading |
Relationship |
Date |
Transaction |
Cost |
#Shares |
Value ($) |
#Shares Total |
SEC Form 4 |
| Willis Gregory B | EVP AND CFO | May 15 '24 | Sale | 50.06 | 11,270 | 564,192 | 67,099 | May 17 04:55 PM | | Khatibi Alex A | EVP | Mar 15 '24 | Sale | 47.37 | 11,199 | 530,447 | 76,300 | Mar 19 08:05 PM | | Levy Grant A | EVP | Mar 15 '24 | Sale | 46.82 | 7,500 | 351,165 | 150,815 | Mar 19 08:03 PM | | Khatibi Alex A | EVP | Mar 05 '24 | Sale | 43.11 | 11,198 | 482,740 | 87,499 | Mar 07 07:49 PM | | Korde Kishore | EVP | Feb 26 '24 | Sale | 39.70 | 16,593 | 658,664 | 112,375 | Feb 27 08:25 PM |
|
|
|
