 |
| Market Cap | 867.96M | EPS (ttm) | 3.26 |
| P/E | 11.65 | EPS this Y | -67.45% |
| Forward P/E | 7.63 | EPS next Y | 74.47% |
| PEG | - | EPS past 5Y | - |
| P/S | 0.08 | EPS next 5Y | - |
| P/B | 1.49 | EPS Q/Q | -85.59% |
| Dividend | 2.11% | Sales Q/Q | 12.67% |
| Insider Own | 23.22% | Inst Own | 68.70% |
| Insider Trans | -1.65% | Inst Trans | -3.94% |
| Short Float | 23.61% | Earnings | May 07/a |
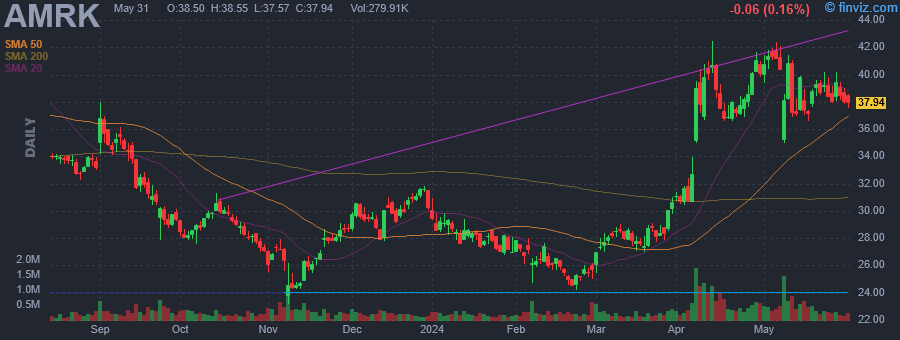
| Analyst Recom | 1.50 | Target Price | 38.75 |
| Avg Volume | 413.95K | 52W Range | 23.14 - 42.48 |
|
|
| Today | Downgrade |
Northland Capital |
Outperform → Market Perform |
|
|
|
|
A-Mark Precious Metals, Inc. engages in the trading of gold, silver, platinum, and palladium bullion numismatic coins, and related products. It operates through the following segments: Wholesale Trading and Ancillary Services, Direct-to-Consumer, and Secured Lending. The Wholesale Trading and Ancillary Services segment is involved in the distribution and purchasing of metal products from sovereign and private mints. The Direct-to-Consumer segment provides access to a multitude of products through its wholly owned subsidiaries. The Secured Lending segment includes coin and precious metal dealers, investors, and collectors. The company was founded by Steven C. Markoff on April 9, 1965 and is headquartered in El Segundo, CA. |
| Insider Trading |
Relationship |
Date |
Transaction |
Cost |
#Shares |
Value ($) |
#Shares Total |
SEC Form 4 |
| ROBERTS GREGORY N | Chief Executive Officer | Mar 01 '24 | Option Exercise | 6.40 | 3,904 | 24,986 | 32,106 | Mar 05 11:34 AM | | ROBERTS GREGORY N | Chief Executive Officer | Mar 01 '24 | Sale | 26.15 | 3,904 | 102,099 | 28,202 | Mar 05 11:34 AM | | ROBERTS GREGORY N | Chief Executive Officer | Feb 29 '24 | Option Exercise | 6.40 | 8,696 | 55,654 | 36,898 | Mar 01 04:53 PM | | ROBERTS GREGORY N | Chief Executive Officer | Feb 29 '24 | Sale | 25.30 | 8,696 | 220,047 | 28,202 | Mar 01 04:53 PM | | ROBERTS GREGORY N | Chief Executive Officer | Feb 28 '24 | Option Exercise | 6.40 | 16,000 | 102,400 | 44,202 | Mar 01 04:53 PM |
|
|
 |
 |
| Market Cap | 738.54M | EPS (ttm) | -8.19 |
| P/E | - | EPS this Y | -26.59% |
| Forward P/E | - | EPS next Y | 86.57% |
| PEG | - | EPS past 5Y | 0.08% |
| P/S | 0.47 | EPS next 5Y | - |
| P/B | 2.57 | EPS Q/Q | -609.09% |
| Dividend | - | Sales Q/Q | 0.30% |
| Insider Own | 1.35% | Inst Own | 77.64% |
| Insider Trans | 2.32% | Inst Trans | -11.63% |
| Short Float | 8.58% | Earnings | May 06/a |
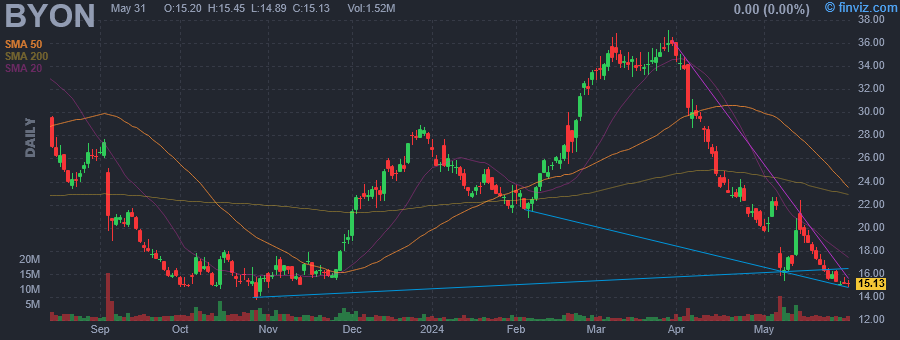
| Analyst Recom | 2.50 | Target Price | 29.71 |
| Avg Volume | 1.68M | 52W Range | 13.71 - 39.27 |
|
|
| Today | Downgrade |
Needham |
Buy → Hold |
|
| Today | Reiterated |
Maxim Group |
Buy |
$50 → $36 |
|
|
|
Beyond, Inc. engages in the provision of an e-commerce platform. It offers furniture and home furnishing products and services. The company was founded on May 5, 1997 and is headquartered in Midvale, UT. |
| Insider Trading |
Relationship |
Date |
Transaction |
Cost |
#Shares |
Value ($) |
#Shares Total |
SEC Form 4 |
| Burkey Joanna Catherine | Director | Mar 04 '24 | Sale | 33.54 | 2,543 | 85,292 | 4,332 | Mar 04 06:18 PM | | Burkey Joanna Catherine | Director | Mar 01 '24 | Option Exercise | 0.00 | 6,875 | 1 | 6,875 | Mar 04 06:18 PM | | LEMONIS MARCUS | EXECUTIVE CHAIRMAN OF BOARD | Feb 22 '24 | Buy | 27.17 | 3,650 | 99,170 | 169,898 | Feb 22 04:02 PM | | Nielsen David J. | DIVISION CEO OVERSTOCK | Feb 22 '24 | Buy | 27.05 | 370 | 10,008 | 57,086 | Feb 26 06:05 AM | | Nielsen David J. | INTERIM CEO & PRESIDENT | Feb 04 '24 | Option Exercise | 0.00 | 3,334 | 0 | 58,097 | Feb 06 06:22 PM |
|
|
|
 |
| Market Cap | 592.48M | EPS (ttm) | -1.77 |
| P/E | - | EPS this Y | 24.15% |
| Forward P/E | 12.42 | EPS next Y | 8.70% |
| PEG | - | EPS past 5Y | -64.67% |
| P/S | 2.32 | EPS next 5Y | 47.20% |
| P/B | 0.69 | EPS Q/Q | 27.29% |
| Dividend | - | Sales Q/Q | 7.23% |
| Insider Own | 1.73% | Inst Own | 45.40% |
| Insider Trans | 0.00% | Inst Trans | 3.59% |
| Short Float | 6.03% | Earnings | May 07/a |
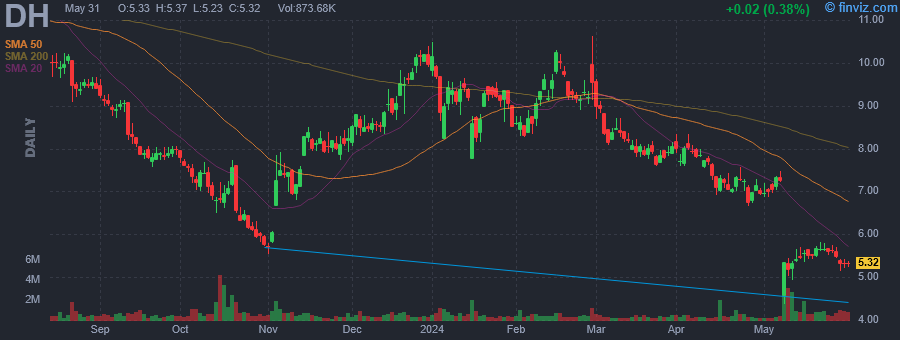
| Analyst Recom | 2.38 | Target Price | 9.55 |
| Avg Volume | 500.36K | 52W Range | 5.53 - 12.45 |
|
|
| Today | Downgrade |
Morgan Stanley |
Overweight → Equal-Weight |
$11.50 → $9 |
|
|
|
Definitive Healthcare Corp. engages in the provision of healthcare commercial intelligence. Its solution offers information on healthcare providers and their activities to help the customers optimize from product development to go-to-market planning, sales, and marketing execution. The company was founded by Jason Kranzt in February 2011 and is headquartered in Framingham, MA. |
| Insider Trading |
Relationship |
Date |
Transaction |
Cost |
#Shares |
Value ($) |
#Shares Total |
SEC Form 4 |
| SEA VII Management, LLC | Director | Aug 24 '23 | Sale | 9.39 | 6,656 | 62,500 | 1,441,657 | Aug 24 07:00 PM | | SEA VII Management, LLC | Director | May 12 '23 | Sale | 9.11 | 6,240 | 56,846 | 1,743,478 | May 15 04:05 PM |
|
|
| |
 |
| Market Cap | 3.16B | EPS (ttm) | 0.38 |
| P/E | 48.50 | EPS this Y | 4.75% |
| Forward P/E | 19.66 | EPS next Y | 19.17% |
| PEG | 2.50 | EPS past 5Y | 82.60% |
| P/S | 5.35 | EPS next 5Y | 19.40% |
| P/B | 2.89 | EPS Q/Q | -43.58% |
| Dividend | - | Sales Q/Q | 14.84% |
| Insider Own | 18.91% | Inst Own | 87.18% |
| Insider Trans | -47.61% | Inst Trans | 2.08% |
| Short Float | 5.14% | Earnings | May 07/a |
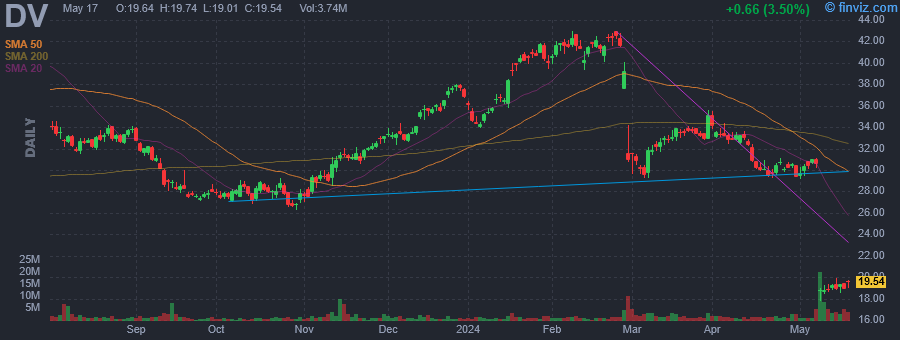
| Analyst Recom | 1.59 | Target Price | 33.13 |
| Avg Volume | 2.03M | 52W Range | 26.23 - 43.00 |
|
|
| Today | Downgrade |
KeyBanc Capital Markets |
Overweight → Sector Weight |
|
|
|
Today 01:25PM
|
Why DoubleVerify Stock Got Crushed Today
(Motley Fool) -39.66% |
|
12:22PM
|
Why DoubleVerify (DV) Shares Are Falling Today
(StockStory) |
|
12:04PM
|
Baird Adjusts Price Target on DoubleVerify to $34 From $42, Keeps Outperform Rating
(MT Newswires) |
|
11:22AM
|
These Stocks Are Moving the Most Today: Shopify, Uber, Lyft, Intel, Tesla, Rivian, Tripadvisor, DoubleVerify, ZoomInfo, and More
(Barrons.com) |
|
11:14AM
|
Stifel Adjusts Price Target on DoubleVerify Holdings to $25 From $37, Maintains Buy Rating
(MT Newswires) |
|
10:50AM
|
Stocks to Watch Wednesday: Shopify, Uber, Reddit, Intel
(The Wall Street Journal) |
|
09:37AM
|
DoubleVerify Stock Plunges After Software Company Cuts Outlook
(The Wall Street Journal) |
|
09:06AM
|
DoubleVerify Sees Uneven Spending Patterns. Analysts Dump Their Buy Ratings.
(Barrons.com) |
|
08:51AM
|
Why Is DoubleVerify (DV) Stock Down 39% Today?
(InvestorPlace) |
|
07:42AM
|
Top Premarket Decliners
(MT Newswires) |
|
DoubleVerify Holdings, Inc. engages in the development of software platforms for digital media measurement, data, and analytics. Its software, Pinnacle, is integrated across the entire digital advertising ecosystem including programmatic platforms, social media channels, and digital publishers. The company was founded on August 16, 2017 and is headquartered in New York, NY. |
| Insider Trading |
Relationship |
Date |
Transaction |
Cost |
#Shares |
Value ($) |
#Shares Total |
SEC Form 4 |
| Eddleman Julie | Global Chief Comm. Officer | Apr 26 '24 | Option Exercise | 0.00 | 12,322 | 0 | 152,124 | Apr 30 04:47 PM | | Allais Nicola T | Chief Financial Officer | Apr 24 '24 | Option Exercise | 2.01 | 5,292 | 10,637 | 78,322 | Apr 25 04:04 PM | | Allais Nicola T | Chief Financial Officer | Apr 24 '24 | Sale | 30.86 | 5,292 | 163,289 | 73,030 | Apr 25 04:04 PM | | Allais Nicola T | Chief Financial Officer | Apr 23 '24 | Option Exercise | 2.01 | 5,292 | 10,637 | 78,322 | Apr 25 04:04 PM | | Allais Nicola T | Chief Financial Officer | Apr 23 '24 | Sale | 29.69 | 5,292 | 157,110 | 73,030 | Apr 25 04:04 PM |
|
|
|
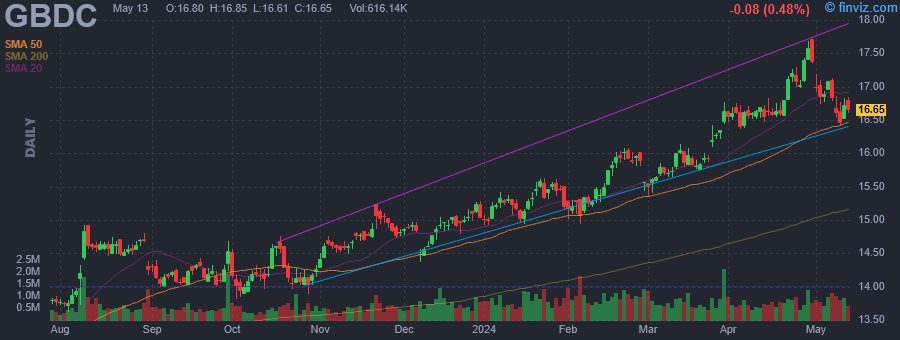 |
| Market Cap | 2.86B | EPS (ttm) | 1.82 |
| P/E | 9.18 | EPS this Y | 68.90% |
| Forward P/E | 9.43 | EPS next Y | -7.09% |
| PEG | 0.92 | EPS past 5Y | 2.50% |
| P/S | 4.54 | EPS next 5Y | 10.00% |
| P/B | 1.10 | EPS Q/Q | 198.40% |
| Dividend | 11.03% | Sales Q/Q | 20.40% |
| Insider Own | 2.71% | Inst Own | 45.20% |
| Insider Trans | 0.00% | Inst Trans | 1.66% |
| Short Float | 2.60% | Earnings | May 06/a |
| Analyst Recom | 1.80 | Target Price | 17.00 |
| Avg Volume | 840.31K | 52W Range | 12.76 - 17.72 |
|
|
| Today | Downgrade |
Raymond James |
Outperform → Mkt Perform |
|
|
|
|
Golub Capital BDC, Inc. (GBDC) is a business development company and operates as an externally managed closed-end non-diversified management investment company. It invests in debt and minority equity investments in middle-market companies that are, in most cases, sponsored by private equity investors. It typically invests in diversified consumer services, automobiles, healthcare technology, insurance, health care equipment and supplies, hotels, restaurants and leisure, healthcare providers and services, IT services and specialty retails. It seeks to invest in the United States. It primarily invests in first lien traditional senior debt, first lien one stop, junior debt and equity, senior secured, one stop, unitranche, second lien, subordinated and mezzanine loans of middle-market companies, and warrants. |
| Insider Trading |
Relationship |
Date |
Transaction |
Cost |
#Shares |
Value ($) |
#Shares Total |
SEC Form 4 |
| Rival Anita J. | Director | May 25 '23 | Buy | 13.02 | 8,000 | 104,160 | 69,000 | May 30 04:16 PM |
|
|
| |
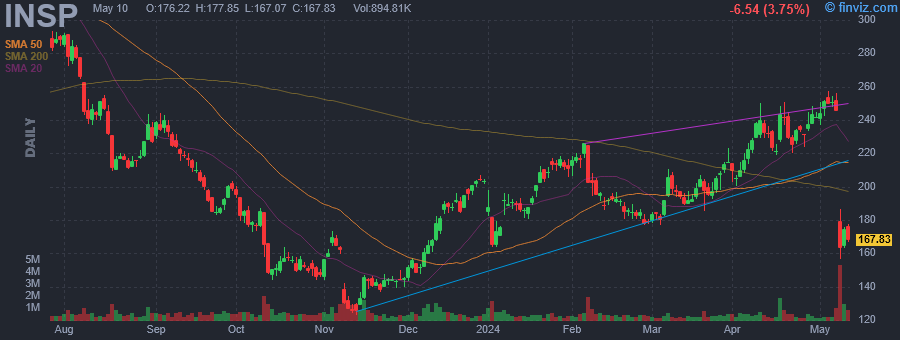 |
| Market Cap | 4.84B | EPS (ttm) | -0.55 |
| P/E | - | EPS this Y | 108.55% |
| Forward P/E | 203.53 | EPS next Y | 1173.37% |
| PEG | - | EPS past 5Y | 13.57% |
| P/S | 7.32 | EPS next 5Y | 54.10% |
| P/B | 8.04 | EPS Q/Q | 36.29% |
| Dividend | - | Sales Q/Q | 28.24% |
| Insider Own | 2.10% | Inst Own | 103.80% |
| Insider Trans | -11.84% | Inst Trans | 2.55% |
| Short Float | 7.80% | Earnings | May 07/a |
| Analyst Recom | 1.80 | Target Price | 253.14 |
| Avg Volume | 481.58K | 52W Range | 123.27 - 330.00 |
|
|
| Today | Downgrade |
BofA Securities |
Buy → Neutral |
$265 → $225 |
|
|
|
Inspire Medical Systems, Inc. engages in the development and commercialization of minimally invasive solutions for patients with obstructive sleep apnea. It offers inspire therapy, which consists of a remote control and implantable components that includes pressure sensing lead, a neurostimulator, and a stimulation lead. The company was founded by Timothy P. Herbert in November 2007 and is headquartered in Golden Valley, MN. |
| Insider Trading |
Relationship |
Date |
Transaction |
Cost |
#Shares |
Value ($) |
#Shares Total |
SEC Form 4 |
| NELSON MARILYN C | Director | Apr 29 '24 | Option Exercise | 240.68 | 1,175 | 282,799 | 35,620 | May 01 04:01 PM | | Buchholz Richard | Chief Financial Officer | Apr 17 '24 | Sale | 230.03 | 15,000 | 3,450,450 | 28,271 | Apr 18 04:44 PM | | NELSON MARILYN C | Director | Apr 01 '24 | Option Exercise | 16.00 | 3,273 | 52,368 | 34,338 | Apr 02 08:29 PM | | Griffin Jerry C | Director | Apr 01 '24 | Option Exercise | 16.00 | 296 | 4,736 | 10,932 | Apr 03 04:55 PM | | Herbert Timothy P. | CEO and President | Apr 01 '24 | Sale | 205.09 | 40,000 | 8,203,581 | 63,658 | Apr 03 07:44 PM |
|
|
|
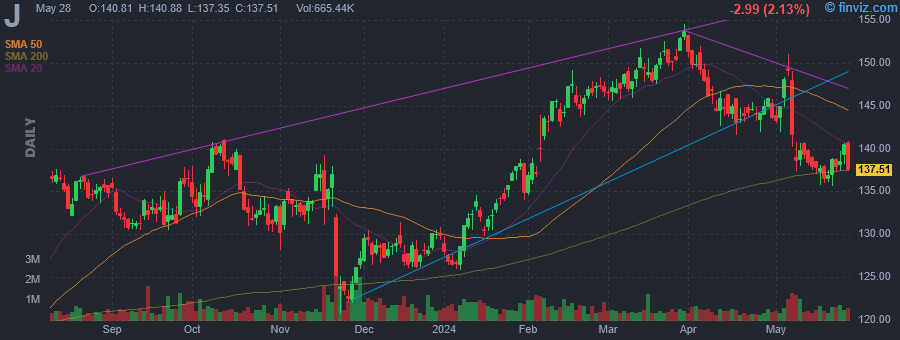 |
| Market Cap | 17.49B | EPS (ttm) | 5.19 |
| P/E | 26.83 | EPS this Y | 10.99% |
| Forward P/E | 15.26 | EPS next Y | 14.14% |
| PEG | 2.71 | EPS past 5Y | 34.99% |
| P/S | 1.04 | EPS next 5Y | 9.90% |
| P/B | 2.63 | EPS Q/Q | -24.44% |
| Dividend | 0.82% | Sales Q/Q | 4.87% |
| Insider Own | 1.22% | Inst Own | 84.94% |
| Insider Trans | -3.47% | Inst Trans | -0.12% |
| Short Float | 1.52% | Earnings | May 07/b |
| Analyst Recom | 2.06 | Target Price | 159.74 |
| Avg Volume | 571.44K | 52W Range | 109.00 - 154.50 |
|
|
| Today | Downgrade |
William Blair |
Outperform → Mkt Perform |
|
|
|
|
Jacobs Solutions, Inc. is a holding company, which engages in the designing and deployment of technology-centric solutions. It operates through the following business segments: Critical Mission Solutions, People and Places Solutions, Divergent Solutions, and PA Consulting. The Critical Mission Solutions segment focuses on the provision of solutions for clients to address evolving challenges like digital transformation and modernization, national security and defense, space exploration, digital asset management, the clean energy transition, and nuclear decommissioning and cleanup. The People and Places Solutions segment provides end-to-end solutions under climate change, energy transition, connected mobility, integrated water management, and biopharmaceutical manufacturing. The Divergent Solutions segment refers to the core foundation for developing and delivering cloud, cyber, data, and digital technologies. The PA Consulting segment includes the investment in PA Consulting Group. The company was founded in 1947 and is headquartered in Dallas, TX. |
| Insider Trading |
Relationship |
Date |
Transaction |
Cost |
#Shares |
Value ($) |
#Shares Total |
SEC Form 4 |
| DEMETRIOU STEVEN J. | EXECUTIVE CHAIR | May 01 '24 | Sale | 143.86 | 7,000 | 1,007,020 | 548,138 | May 03 05:16 PM | | Berryman Kevin C | CHIEF FINANCIAL OFFICER | Apr 30 '24 | Sale | 145.31 | 1,500 | 217,965 | 231,604 | May 02 05:19 PM | | DEMETRIOU STEVEN J. | EXECUTIVE CHAIR | Apr 01 '24 | Sale | 153.20 | 7,000 | 1,072,400 | 555,138 | Apr 03 05:48 PM | | Berryman Kevin C | CHIEF FINANCIAL OFFICER | Apr 01 '24 | Sale | 153.20 | 1,500 | 229,800 | 233,104 | Apr 03 05:56 PM | | Hill Patrick | EXECUTIVE VICE PRESIDENT | Mar 08 '24 | Sale | 149.00 | 5,486 | 817,414 | 57,233 | Mar 12 05:39 PM |
|
|
| |
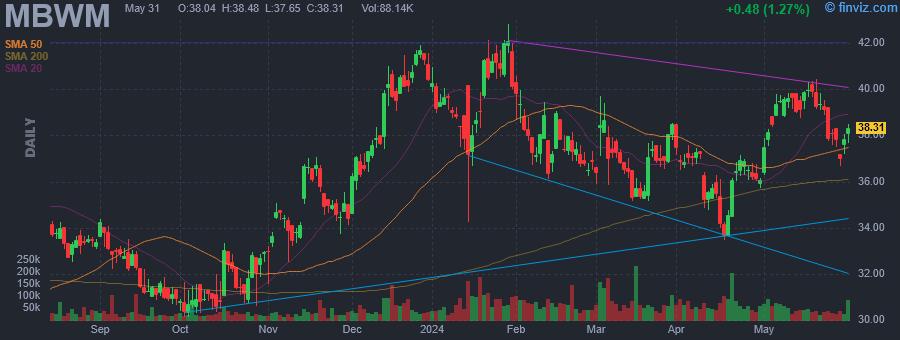 |
| Market Cap | 637.87M | EPS (ttm) | 5.16 |
| P/E | 7.67 | EPS this Y | -6.97% |
| Forward P/E | 9.00 | EPS next Y | -7.86% |
| PEG | 0.96 | EPS past 5Y | 15.20% |
| P/S | 1.97 | EPS next 5Y | 8.00% |
| P/B | 1.19 | EPS Q/Q | 2.02% |
| Dividend | 3.56% | Sales Q/Q | 29.89% |
| Insider Own | 3.31% | Inst Own | 59.14% |
| Insider Trans | 0.02% | Inst Trans | -1.82% |
| Short Float | 1.17% | Earnings | Apr 16/b |
| Analyst Recom | 2.50 | Target Price | 41.67 |
| Avg Volume | 75.24K | 52W Range | 23.89 - 42.82 |
|
|
| Today | Downgrade |
Janney |
Buy → Neutral |
|
|
|
|
Mercantile Bank Corp. operates as a bank holding company for Mercantile Bank of Michigan. It offers checking and savings accounts, credit and debit cards, mobile and Internet banking, business loans, mobile wallet, health savings account, and treasury management services. The company was founded on July 15, 1997 and is headquartered in Grand Rapids, MI. |
| Insider Trading |
Relationship |
Date |
Transaction |
Cost |
#Shares |
Value ($) |
#Shares Total |
SEC Form 4 |
| Sanchez Nelson F | Director | Mar 11 '24 | Buy | 36.51 | 100 | 3,651 | 1,265 | Mar 13 06:24 PM | | PRICE MICHAEL H | Director | Jul 26 '23 | Sale | 34.29 | 4,000 | 137,160 | 30,080 | Jul 28 06:19 PM |
|
|
|
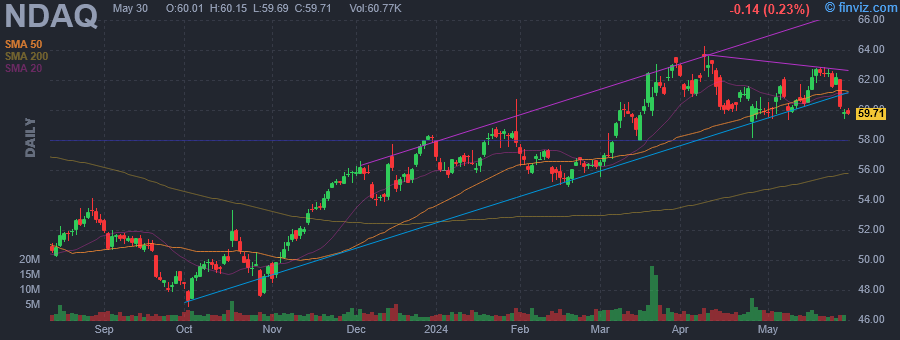 |
| Market Cap | 34.51B | EPS (ttm) | 1.90 |
| P/E | 31.53 | EPS this Y | -4.68% |
| Forward P/E | 19.71 | EPS next Y | 12.96% |
| PEG | 4.15 | EPS past 5Y | 18.00% |
| P/S | 5.56 | EPS next 5Y | 7.59% |
| P/B | 3.19 | EPS Q/Q | -33.78% |
| Dividend | 1.56% | Sales Q/Q | 9.20% |
| Insider Own | 33.38% | Inst Own | 53.90% |
| Insider Trans | -13.88% | Inst Trans | 0.04% |
| Short Float | 0.93% | Earnings | Apr 25/b |
| Analyst Recom | 2.21 | Target Price | 66.93 |
| Avg Volume | 3.48M | 52W Range | 46.88 - 64.25 |
|
|
| Today | Downgrade |
Rosenblatt |
Buy → Neutral |
$76 → $64 |
|
|
May-04-24 02:28AM
|
Insider Sale: Executive Vice President Bryan Smith Sells 3,036 Shares of Nasdaq Inc (NDAQ)
(GuruFocus.com) |
|
May-03-24 01:02AM
|
Decoding Nasdaq Inc (NDAQ): A Strategic SWOT Insight
(GuruFocus.com) |
|
May-02-24 04:05PM
|
Nasdaq April 2024 Volumes
(GlobeNewswire) |
|
01:53PM
|
Nasdaq Plans More Short-Term Options on Commodity, Treasury ETFs
(Bloomberg) |
|
Apr-30-24 11:41AM
|
Nasdaq, Inc. (NASDAQ:NDAQ) Q1 2024 Earnings Call Transcript
(Insider Monkey) |
|
Apr-28-24 09:57AM
|
10 Stocks with Latest Dividend Increases
(Insider Monkey) |
|
Apr-26-24 03:02AM
|
Nasdaq Inc (NDAQ) Q1 2024 Earnings Call Transcript Highlights: Robust Revenue Growth and ...
(GuruFocus.com) |
|
Apr-25-24 11:47PM
|
Q1 2024 Nasdaq Inc Earnings Call
(Thomson Reuters StreetEvents) |
|
04:05PM
|
Delisting of Securities of Northern Revival Acquisition Corporation; Veradigm Inc.; Neptune Wellness Solutions Inc.; Panbela Therapeutics, Inc.; Bit Brother Limited; Nocturne Acquisition Corporation; View, Inc.; Casa Systems, Inc.; Gamida Cell Ltd.; Eiger BioPharmaceuticals, Inc.; Acorda Therapeutics, Inc.; Motus GI Holdings, Inc.; ProSomnus, Inc.; and Mobile Global Esports Inc. from The Nasdaq Stock Market
(GlobeNewswire) |
|
01:21PM
|
Analyst Report: Nasdaq, Inc.
(Morningstar Research) |
|
Nasdaq, Inc. is a holding company, which engages in trading, clearing, exchange technology, regulatory, securities listing, information, and public and private company services. It operates through the following segments: Capital Access Platforms, Financial Technology, and Market Services. The Capital Access Platforms segment delivers liquidity, transparency, and integrity to the corporate issuer and investment community by empowering clients to effectively navigate the capital markets, achieve their sustainability goals, and drive governance excellence. The Financial Technology segment offers platforms that improve the liquidity, transparency, and integrity of the global economy by architecting and operating the markets. The Market Services segment includes equity derivative trading and clearing, cash equity trading, fixed income, currency, and commodities trading. The company was founded by Gordon S. Macklin in 1971 and is headquartered in New York, NY. |
| Insider Trading |
Relationship |
Date |
Transaction |
Cost |
#Shares |
Value ($) |
#Shares Total |
SEC Form 4 |
| Smith Bryan Everard | Executive Vice President | May 01 '24 | Sale | 59.89 | 3,036 | 181,826 | 58,636 | May 03 04:33 PM | | Smith Bryan Everard | Executive Vice President | Apr 01 '24 | Sale | 62.91 | 7,400 | 465,534 | 61,672 | Apr 03 05:07 PM | | Borse Dubai LTD | 10% Owner | Mar 22 '24 | Sale | 58.00 | 31,000,000 | 1,797,907,000 | 58,341,545 | Mar 22 04:30 PM | | Smith Bryan Everard | Executive Vice President | Mar 01 '24 | Sale | 56.29 | 2,064 | 116,183 | 63,528 | Mar 04 04:00 PM | | DENNISON ANN M | Executive Vice President | Nov 01 '23 | Sale | 49.41 | 5,150 | 254,461 | 59,359 | Nov 03 04:08 PM |
|
|
|
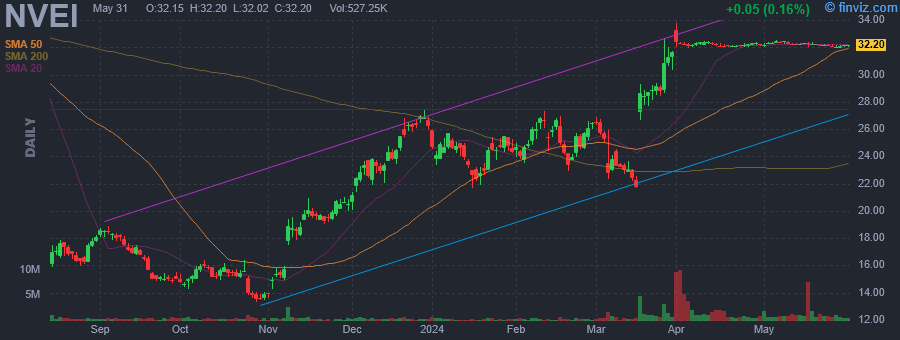 |
| Market Cap | 4.50B | EPS (ttm) | -0.06 |
| P/E | - | EPS this Y | 16.48% |
| Forward P/E | 12.65 | EPS next Y | 29.62% |
| PEG | - | EPS past 5Y | 14.51% |
| P/S | 3.55 | EPS next 5Y | 16.80% |
| P/B | 2.21 | EPS Q/Q | 29.86% |
| Dividend | 0.41% | Sales Q/Q | 30.65% |
| Insider Own | 54.71% | Inst Own | 21.37% |
| Insider Trans | 0.00% | Inst Trans | - |
| Short Float | 3.27% | Earnings | May 07/a |
| Analyst Recom | 2.85 | Target Price | 34.07 |
| Avg Volume | 1.40M | 52W Range | 13.32 - 42.50 |
|
|
| Today | Downgrade |
JP Morgan |
Overweight → Neutral |
$32 → $34 |
|
|
|
Nuvei Corp. engages in the provision of payment technology and solutions.Its services include payment gateways, security and risk management, recurring and subscription billing, multi-currency pricing, dynamic currency conversion, and ACH payment processing services. The company was founded by Philip Fayer on September 1, 2017 and is headquartered in Montreal, Canada. |
|
|
