 |
| Market Cap | 446.72M | EPS (ttm) | 2.05 |
| P/E | 23.35 | EPS this Y | -35.37% |
| Forward P/E | 10.29 | EPS next Y | 46.95% |
| PEG | 0.58 | EPS past 5Y | 7.84% |
| P/S | 1.50 | EPS next 5Y | 40.00% |
| P/B | 1.56 | EPS Q/Q | -90.08% |
| Dividend | 0.50% | Sales Q/Q | 1.07% |
| Insider Own | 12.21% | Inst Own | 45.94% |
| Insider Trans | 0.18% | Inst Trans | -6.94% |
| Short Float | 4.29% | Earnings | May 09/a |
| Analyst Recom | 1.00 | Target Price | 93.67 |
| Avg Volume | 57.48K | 52W Range | 46.32 - 79.46 |
|
|
|
|
RCI Hospitality Holdings, Inc. engages in the provision of live adult entertainment and dining experiences. It operates through the following segments: Nightclubs and Bombshells. The Nightclubs segment includes adult entertainment. The Bombshells segment involves the operation of restaurants and bars. The company was founded by Robert L. Watters in 1983 and is headquartered in Houston, TX. |
| Insider Trading |
Relationship |
Date |
Transaction |
Cost |
#Shares |
Value ($) |
#Shares Total |
SEC Form 4 |
| Elaine Johnson Martin | Director | May 15 '24 | Buy | 47.25 | 64 | 3,024 | 9,991 | May 17 02:01 PM | | Elaine Johnson Martin | Director | May 14 '24 | Buy | 48.05 | 842 | 40,458 | 9,927 | May 14 08:03 PM | | LANGAN ERIC SCOTT | President and CEO | Mar 15 '24 | Buy | 54.54 | 1,000 | 54,540 | 703,000 | Mar 18 06:10 AM | | Barabash Yura V | Director | Feb 26 '24 | Buy | 55.95 | 188 | 10,518 | 1,149 | Feb 26 06:50 PM | | ADW Capital Management, LLC | 10% Owner | Sep 27 '23 | Sale | 60.11 | 8,000 | 480,880 | 941,000 | Sep 28 11:00 AM |
|
|
 |
 |
| Market Cap | 74.36M | EPS (ttm) | 0.03 |
| P/E | 149.81 | EPS this Y | 3300.00% |
| Forward P/E | 11.43 | EPS next Y | 2.94% |
| PEG | - | EPS past 5Y | - |
| P/S | 1.13 | EPS next 5Y | - |
| P/B | 1.18 | EPS Q/Q | 35.21% |
| Dividend | - | Sales Q/Q | -26.35% |
| Insider Own | 88.69% | Inst Own | 3.67% |
| Insider Trans | 0.02% | Inst Trans | 20.63% |
| Short Float | 0.30% | Earnings | May 07/a |
| Analyst Recom | 1.00 | Target Price | 9.00 |
| Avg Volume | 4.24K | 52W Range | 3.41 - 6.40 |
|
|
|
|
Stabilis Solutions, Inc. engages in the provision of small-scale liquefied natural gas production, distribution, and fueling services to multiple end markets. It operates through the following segments: LNG and Power Delivery. The LNG segment supplies LNG to the industrial, midstream, and oilfield sectors in North America and provides turnkey fuel solutions to help users of propane, diesel and other crude-based fuel products convert to LNG. The Power Delivery segment provides power delivery solutions to the global energy industry through its subsidiary in Brazil and joint venture in China. The company was founded on October 21, 1996 and is headquartered in Houston, TX. |
| Insider Trading |
Relationship |
Date |
Transaction |
Cost |
#Shares |
Value ($) |
#Shares Total |
SEC Form 4 |
| Mitchell Peter C. | Director | May 15 '24 | Buy | 4.14 | 3,564 | 14,753 | 25,000 | May 17 02:00 PM | | KUNTZ EDWARD L | Director | Nov 13 '23 | Buy | 4.91 | 5,000 | 24,550 | 58,172 | Nov 14 08:45 AM | | Ballard Westervelt T. JR | President and CEO | Aug 23 '23 | Option Exercise | 0.00 | 125,000 | 0 | 432,916 | Aug 25 04:46 PM | | KUNTZ EDWARD L | Director | May 26 '23 | Buy | 3.87 | 7,000 | 27,090 | 53,172 | May 30 04:13 PM |
|
|
|
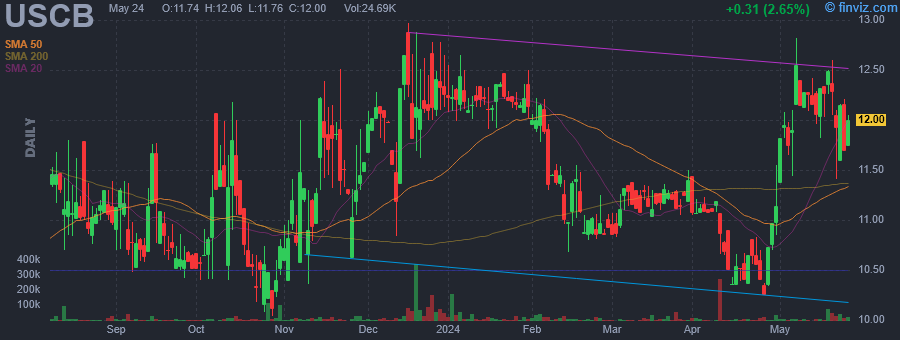 |
| Market Cap | 241.42M | EPS (ttm) | 0.78 |
| P/E | 15.71 | EPS this Y | 19.28% |
| Forward P/E | 10.13 | EPS next Y | 22.47% |
| PEG | - | EPS past 5Y | - |
| P/S | 2.06 | EPS next 5Y | - |
| P/B | 1.24 | EPS Q/Q | -19.64% |
| Dividend | 1.63% | Sales Q/Q | 36.41% |
| Insider Own | 24.56% | Inst Own | 34.47% |
| Insider Trans | 1.75% | Inst Trans | 0.91% |
| Short Float | 0.43% | Earnings | Apr 25/a |
| Analyst Recom | 2.25 | Target Price | 13.25 |
| Avg Volume | 18.47K | 52W Range | 9.30 - 12.97 |
|
|
|
|
USCB Financial Holdings, Inc. operates as a bank holding company. The company was founded on December 17, 2021 and is headquartered in Doral, FL. |
| Insider Trading |
Relationship |
Date |
Transaction |
Cost |
#Shares |
Value ($) |
#Shares Total |
SEC Form 4 |
| Anderson Robert B. | Executive VP and CFO | May 16 '24 | Buy | 12.15 | 525 | 6,379 | 79,933 | May 17 01:34 PM | | Anderson Robert B. | Executive VP and CFO | May 15 '24 | Buy | 12.13 | 5,000 | 60,650 | 79,408 | May 17 01:34 PM | | Anderson Robert B. | Executive VP and CFO | May 07 '24 | Buy | 12.38 | 3,000 | 37,140 | 74,408 | May 07 01:51 PM | | Anderson Robert B. | Executive VP and CFO | May 06 '24 | Buy | 11.91 | 3,000 | 35,730 | 71,408 | May 07 01:51 PM | | Anderson Robert B. | Executive VP and CFO | May 01 '24 | Buy | 11.48 | 987 | 11,331 | 68,408 | May 01 03:48 PM |
|
|
| |
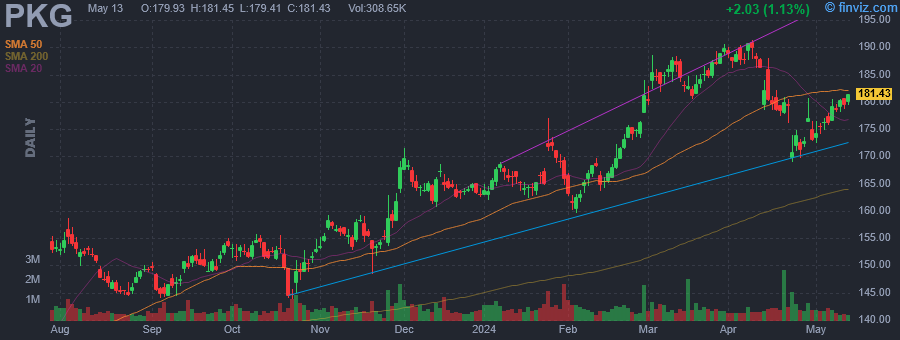 |
| Market Cap | 16.30B | EPS (ttm) | 8.00 |
| P/E | 22.69 | EPS this Y | -0.86% |
| Forward P/E | 18.37 | EPS next Y | 14.58% |
| PEG | - | EPS past 5Y | 1.69% |
| P/S | 2.09 | EPS next 5Y | -14.29% |
| P/B | 4.04 | EPS Q/Q | -22.60% |
| Dividend | 2.77% | Sales Q/Q | 0.16% |
| Insider Own | 2.09% | Inst Own | 90.19% |
| Insider Trans | -4.62% | Inst Trans | 0.04% |
| Short Float | 1.55% | Earnings | Apr 22/a |
| Analyst Recom | 2.60 | Target Price | 186.67 |
| Avg Volume | 644.26K | 52W Range | 122.20 - 191.27 |
|
|
|
|
Packaging Corporation of America engages in the production of container products. It operates through the following segments: Packaging, Paper, and Corporate and Other. The Packaging segment offers a variety of corrugated packaging products, such as conventional shipping containers. The Paper segment manufactures and sells a range of papers, including communication-based papers, and pressure sensitive papers. The Corporate and Other segment focuses on transportation assets, such as rail cars, and trucks. The company was founded in 1959 and is headquartered in Lake Forest, IL. |
| Insider Trading |
Relationship |
Date |
Transaction |
Cost |
#Shares |
Value ($) |
#Shares Total |
SEC Form 4 |
| GOWLAND KAREN E | Director | May 15 '24 | Buy | 182.06 | 300 | 54,618 | 916 | May 17 01:11 PM | | Mundy Robert P. | EVP & CFO | Mar 06 '24 | Sale | 182.51 | 10,000 | 1,825,100 | 46,454 | Mar 08 10:19 AM | | KOWLZAN MARK W | Chairman & CEO | Mar 04 '24 | Sale | 186.70 | 53,196 | 9,931,693 | 474,010 | Mar 06 04:55 PM | | Hassfurther Thomas A | Exec. VP | Feb 29 '24 | Sale | 181.06 | 13,850 | 2,507,681 | 187,647 | Mar 01 02:13 PM | | Hassfurther Thomas A | Exec. VP | Feb 22 '24 | Sale | 173.80 | 14,191 | 2,466,396 | 183,930 | Feb 26 12:52 PM |
|
|
|
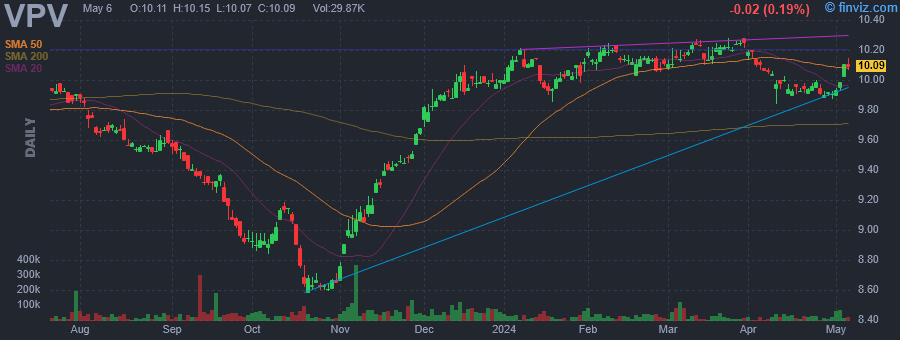 |
| Market Cap | 245.92M | EPS (ttm) | -0.19 |
| P/E | - | EPS this Y | - |
| Forward P/E | - | EPS next Y | - |
| PEG | - | EPS past 5Y | - |
| P/S | 13.36 | EPS next 5Y | - |
| P/B | 0.91 | EPS Q/Q | - |
| Dividend | 3.55% | Sales Q/Q | 3.60% |
| Insider Own | - | Inst Own | 31.22% |
| Insider Trans | - | Inst Trans | - |
| Short Float | 0.11% | Earnings | - |
| Analyst Recom | - | Target Price | - |
| Avg Volume | 32.61K | 52W Range | 8.58 - 10.34 |
|
|
|
|
Invesco Pennsylvania Value Municipal Income Trust is a closed-ended fixed income mutual fund launched by Invesco Ltd. The fund is co-managed by Invesco Advisers, Inc., INVESCO Asset Management (Japan) Limited, INVESCO Asset Management Deutschland GmbH, INVESCO Asset Management Limited, Invesco Canada Ltd., Invesco Hong Kong Limited, and INVESCO Senior Secured Management, Inc. It invests in the fixed income markets of the United States. The fund primarily invests in investment grade Pennsylvania municipal securities which include municipal bonds, municipal notes, municipal commercial paper, and lease obligations. It employs fundamental analysis with bottom-up security selection approach to create its portfolio. The fund was formerly known as Invesco Van Kampen Pennsylvania Value Municipal Income Trust. Invesco Pennsylvania Value Municipal Income Trust was formed on April 30, 1993 and is domiciled in the United States. |
| Insider Trading |
Relationship |
Date |
Transaction |
Cost |
#Shares |
Value ($) |
#Shares Total |
SEC Form 4 |
| Saba Capital Management, L.P. | 10% Owner | May 15 '24 | Buy | 10.28 | 7,265 | 74,684 | 2,883,105 | May 17 01:11 PM | | Saba Capital Management, L.P. | 10% Owner | May 03 '24 | Buy | 10.06 | 2,199 | 22,122 | 2,875,840 | May 07 05:23 PM | | Saba Capital Management, L.P. | 10% Owner | May 02 '24 | Buy | 9.96 | 30,935 | 308,113 | 2,873,641 | May 03 01:24 PM | | Saba Capital Management, L.P. | 10% Owner | Apr 15 '24 | Buy | 9.94 | 2,973 | 29,552 | 2,842,701 | Apr 15 05:15 PM | | Saba Capital Management, L.P. | 10% Owner | Apr 12 '24 | Buy | 10.01 | 13,333 | 133,463 | 2,839,728 | Apr 15 05:15 PM |
|
|
| |
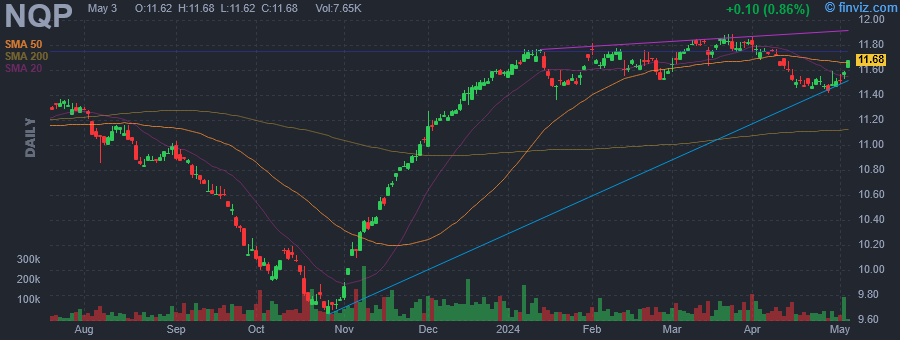 |
| Market Cap | 443.13M | EPS (ttm) | -0.24 |
| P/E | - | EPS this Y | - |
| Forward P/E | - | EPS next Y | - |
| PEG | - | EPS past 5Y | - |
| P/S | 14.03 | EPS next 5Y | - |
| P/B | 0.92 | EPS Q/Q | - |
| Dividend | 3.46% | Sales Q/Q | 5.80% |
| Insider Own | - | Inst Own | 33.09% |
| Insider Trans | - | Inst Trans | - |
| Short Float | 0.13% | Earnings | - |
| Analyst Recom | - | Target Price | - |
| Avg Volume | 52.91K | 52W Range | 9.65 - 12.03 |
|
|
|
|
Nuveen Pennsylvania Quality Municipal Income Fund is a closed ended fixed income mutual fund launched by Nuveen Investments, Inc. The fund is co-managed by Nuveen Fund Advisors LLC and Nuveen Asset Management, LLC. It invests in the fixed income markets of Pennsylvania. The fund invests in tax exempt municipal bonds, with a rating of Baa/BBB or higher. It employs fundamental analysis, with bottom-up stock picking approach, to create its portfolio. The fund benchmarks the performance of its portfolio against the Standard & Poor's Pennsylvania Municipal Bond Index and Standard & Poor's National Municipal Bond Index. The fund was formerly known a Nuveen Pennsylvania Investment Quality Municipal Fund. Nuveen Pennsylvania Quality Municipal Income Fund was formed on December 20, 1990 and is domiciled in the United States. |
| Insider Trading |
Relationship |
Date |
Transaction |
Cost |
#Shares |
Value ($) |
#Shares Total |
SEC Form 4 |
| Saba Capital Management, L.P. | 10% Owner | May 15 '24 | Buy | 12.00 | 8,068 | 96,816 | 5,170,599 | May 17 01:07 PM | | Saba Capital Management, L.P. | 10% Owner | May 03 '24 | Buy | 11.65 | 1,234 | 14,376 | 5,162,531 | May 07 05:16 PM | | Saba Capital Management, L.P. | 10% Owner | May 02 '24 | Buy | 11.55 | 65,807 | 760,071 | 5,161,297 | May 03 01:14 PM | | Saba Capital Management, L.P. | 10% Owner | Apr 29 '24 | Buy | 11.49 | 7,796 | 89,576 | 5,095,490 | May 01 10:28 AM | | Saba Capital Management, L.P. | 10% Owner | Apr 25 '24 | Buy | 11.46 | 31,908 | 365,666 | 5,087,694 | Apr 26 11:51 AM |
|
|
|
 |
| Market Cap | 193.67M | EPS (ttm) | -1.42 |
| P/E | - | EPS this Y | - |
| Forward P/E | - | EPS next Y | - |
| PEG | - | EPS past 5Y | - |
| P/S | - | EPS next 5Y | - |
| P/B | - | EPS Q/Q | - |
| Dividend | 4.63% | Sales Q/Q | - |
| Insider Own | - | Inst Own | 35.37% |
| Insider Trans | - | Inst Trans | - |
| Short Float | 0.08% | Earnings | - |
| Analyst Recom | - | Target Price | - |
| Avg Volume | 39.33K | 52W Range | 9.18 - 11.51 |
|
|
|
|
Pioneer Municipal High Income Opportunities Fund, Inc. (the Fund) is a diversified, closed-end management investment company. The Fund's primary investment objective is to provide holders of the Fund's common stock with a high level of current income exempt from regular federal income tax. As a secondary investment objective, the Fund may seek capital appreciation to the extent consistent with its primary investment objective. The Fund invests at least 80% of its net assets (plus the amount of borrowings, if any, for investment purposes) in securities issued by or on behalf of states, counties, municipalities, territories and possessions of the United States and the District of Columbia and their authorities, political subdivisions, agencies and instrumentalities, the interest, on which is exempt from regular federal income tax (municipal securities). It may invest without limit in debt securities of any credit quality. The Fund's investment advisor is Amundi Asset Management US, Inc. |
| Insider Trading |
Relationship |
Date |
Transaction |
Cost |
#Shares |
Value ($) |
#Shares Total |
SEC Form 4 |
| Saba Capital Management, L.P. | 10% Owner | May 16 '24 | Buy | 11.40 | 2,329 | 26,551 | 1,734,715 | May 17 01:05 PM | | Saba Capital Management, L.P. | 10% Owner | May 15 '24 | Buy | 11.46 | 6,399 | 73,333 | 1,732,386 | May 17 01:05 PM | | Saba Capital Management, L.P. | 10% Owner | Mar 19 '24 | Buy | 11.21 | 5,909 | 66,240 | 1,725,979 | Mar 20 11:57 AM | | Saba Capital Management, L.P. | 10% Owner | Mar 07 '24 | Buy | 11.10 | 24,761 | 274,847 | 1,720,070 | Mar 11 02:30 PM | | Saba Capital Management, L.P. | 10% Owner | Mar 06 '24 | Buy | 11.06 | 6,438 | 71,204 | 1,695,309 | Mar 06 04:52 PM |
|
|
| |
 |
| Market Cap | 204.71M | EPS (ttm) | 0.04 |
| P/E | 224.75 | EPS this Y | - |
| Forward P/E | - | EPS next Y | - |
| PEG | - | EPS past 5Y | - |
| P/S | 12.19 | EPS next 5Y | - |
| P/B | 1.07 | EPS Q/Q | - |
| Dividend | 3.92% | Sales Q/Q | 3.50% |
| Insider Own | - | Inst Own | 55.20% |
| Insider Trans | - | Inst Trans | - |
| Short Float | 0.20% | Earnings | - |
| Analyst Recom | - | Target Price | - |
| Avg Volume | 52.41K | 52W Range | 6.93 - 8.99 |
|
|
|
|
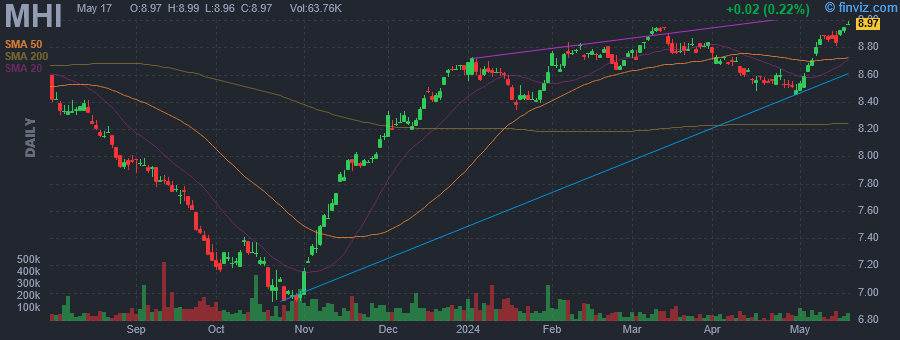
Pioneer Municipal High Income Fund, Inc. is a closed-ended fixed income mutual fund launched and managed by Pioneer Investment Management, Inc. It invests in the fixed income markets of the United States. The fund primarily invests in municipal securities. It seeks to invest in securities across the credit rating and maturity spectrum. The fund benchmarks the performance of its portfolio against the Barclays Municipal Bond Index and Barclays High Yield Municipal Bond Index. Pioneer Municipal High Income Fund, Inc. was formed on March 13, 2003 and is domiciled in the United States. |
| Insider Trading |
Relationship |
Date |
Transaction |
Cost |
#Shares |
Value ($) |
#Shares Total |
SEC Form 4 |
| Saba Capital Management, L.P. | 10% Owner | May 15 '24 | Buy | 8.91 | 11,105 | 98,946 | 3,449,685 | May 17 01:03 PM | | Saba Capital Management, L.P. | 10% Owner | May 03 '24 | Buy | 8.64 | 4,765 | 41,170 | 3,438,580 | May 07 05:12 PM | | Saba Capital Management, L.P. | 10% Owner | May 02 '24 | Buy | 8.56 | 32,971 | 282,232 | 3,433,815 | May 03 01:12 PM | | Saba Capital Management, L.P. | 10% Owner | Mar 11 '24 | Buy | 8.93 | 30,534 | 272,669 | 3,400,844 | Mar 12 05:54 PM | | Saba Capital Management, L.P. | 10% Owner | Mar 01 '24 | Buy | 8.76 | 5,666 | 49,634 | 3,370,310 | Mar 04 06:09 PM |
|
|
|
 |
| Market Cap | 193.47M | EPS (ttm) | -0.06 |
| P/E | - | EPS this Y | - |
| Forward P/E | - | EPS next Y | - |
| PEG | - | EPS past 5Y | - |
| P/S | 10.76 | EPS next 5Y | - |
| P/B | 1.00 | EPS Q/Q | - |
| Dividend | 4.23% | Sales Q/Q | 5.00% |
| Insider Own | - | Inst Own | 46.63% |
| Insider Trans | - | Inst Trans | - |
| Short Float | 0.10% | Earnings | - |
| Analyst Recom | - | Target Price | - |
| Avg Volume | 48.65K | 52W Range | 6.37 - 8.19 |
|
|
|
|
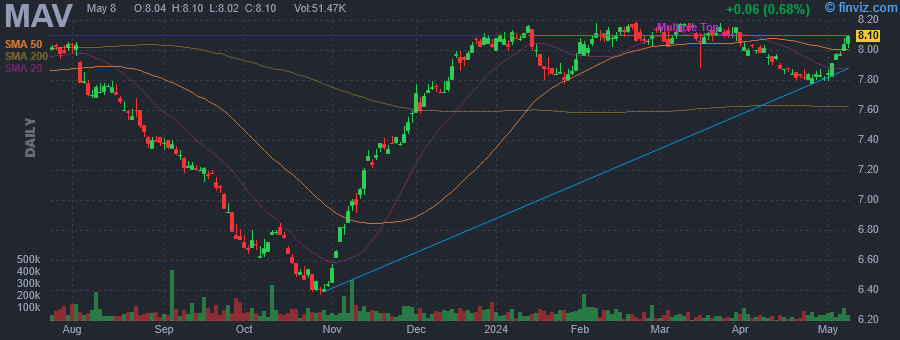
Pioneer Municipal High Income Advantage Fund, Inc. is a closed ended fixed income mutual fund launched and managed by Pioneer Investment Management, Inc. The fund invests in the fixed income markets of the United States. It invests primarily in municipal bonds. The fund benchmarks the performance of its portfolio against the Barclays Capital High Yield Municipal Bond Index and the Barclays Capital Municipal Bond Index. It was formerly known as Pioneer Municipal Advantage Trust. Pioneer Municipal High Income Advantage Fund, Inc. was formed on August 6, 2003 and is domiciled in the United States. |
| Insider Trading |
Relationship |
Date |
Transaction |
Cost |
#Shares |
Value ($) |
#Shares Total |
SEC Form 4 |
| Saba Capital Management, L.P. | 10% Owner | May 15 '24 | Buy | 8.08 | 49,514 | 400,073 | 2,800,265 | May 17 12:47 PM | | Saba Capital Management, L.P. | 10% Owner | May 03 '24 | Buy | 7.96 | 13,162 | 104,770 | 2,750,751 | May 07 05:09 PM | | Saba Capital Management, L.P. | 10% Owner | May 02 '24 | Buy | 7.87 | 35,879 | 282,368 | 2,737,589 | May 02 04:52 PM | | Saba Capital Management, L.P. | 10% Owner | May 01 '24 | Buy | 7.82 | 24,037 | 187,969 | 2,701,710 | May 02 04:52 PM | | Saba Capital Management, L.P. | 10% Owner | Apr 25 '24 | Buy | 7.81 | 38,952 | 304,215 | 2,677,669 | Apr 26 11:43 AM |
|
|
|
 |
| Market Cap | 387.56M | EPS (ttm) | 0.79 |
| P/E | 17.94 | EPS this Y | - |
| Forward P/E | - | EPS next Y | - |
| PEG | - | EPS past 5Y | - |
| P/S | 110.32 | EPS next 5Y | - |
| P/B | 0.88 | EPS Q/Q | - |
| Dividend | 7.13% | Sales Q/Q | 34.40% |
| Insider Own | - | Inst Own | 34.38% |
| Insider Trans | - | Inst Trans | - |
| Short Float | 0.21% | Earnings | - |
| Analyst Recom | - | Target Price | - |
| Avg Volume | 84.90K | 52W Range | 11.34 - 14.37 |
|
|
|
|
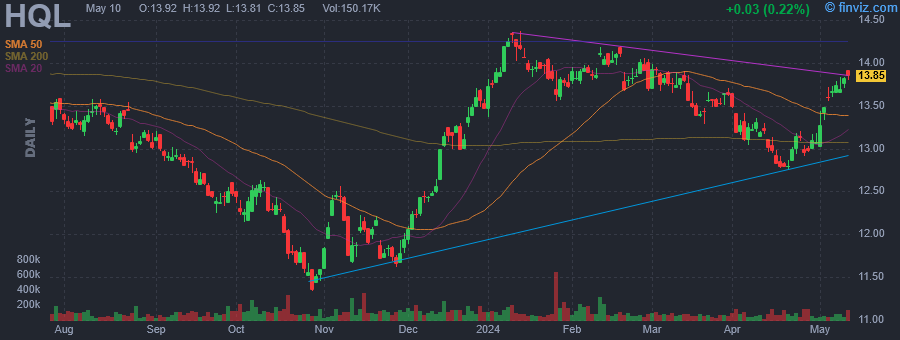
Tekla Life Sciences Investors is a closed-ended equity mutual fund launched and managed by Tekla Capital Management LLC. The fund invests in public equity markets across the globe. It seeks to invest in stocks of companies operating in the life sciences sector, including the biotechnology, pharmaceutical, diagnostics, managed healthcare, medical equipment, hospitals, healthcare information technology and services, devices and supplies industries, and in agriculture and environmental management industries. The fund primarily invests in growth stocks of small cap companies. It employs fundamental analysis with a focus on factors such as market position for services or products, experience of business management, technological expertise, and the ability either to generate funds internally to finance growth or to secure outside sources of capital to create its portfolio. The fund benchmarks the performance of its portfolio against the NASDAQ Biotech Index and the S&P 500 Index. It was formerly known as H&Q Life Sciences Investors fund. Tekla Life Sciences Investors was formed on February 20, 1992 and is domiciled in the United States. |
| Insider Trading |
Relationship |
Date |
Transaction |
Cost |
#Shares |
Value ($) |
#Shares Total |
SEC Form 4 |
| Saba Capital Management, L.P. | 10% Owner | May 15 '24 | Buy | 14.19 | 34,755 | 493,173 | 3,250,580 | May 17 12:34 PM | | Saba Capital Management, L.P. | 10% Owner | May 10 '24 | Buy | 13.86 | 57,862 | 801,967 | 3,215,825 | May 14 01:50 PM | | Saba Capital Management, L.P. | 10% Owner | May 09 '24 | Buy | 13.80 | 17,373 | 239,747 | 3,157,963 | May 10 10:31 AM | | Saba Capital Management, L.P. | 10% Owner | May 08 '24 | Buy | 13.70 | 10,986 | 150,508 | 3,140,590 | May 10 10:31 AM | | Saba Capital Management, L.P. | 10% Owner | May 07 '24 | Buy | 13.76 | 50,161 | 690,215 | 3,129,604 | May 07 05:07 PM |
|
|
|
