 |
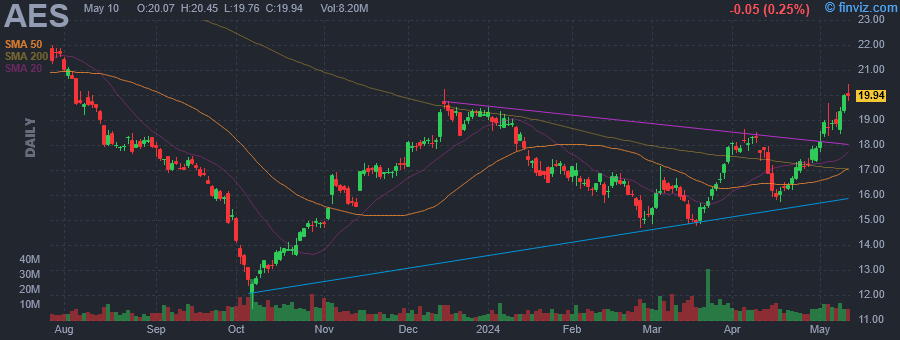
| Market Cap | 14.95B | EPS (ttm) | 0.72 |
| P/E | 29.14 | EPS this Y | 8.47% |
| Forward P/E | 10.09 | EPS next Y | 9.18% |
| PEG | 3.88 | EPS past 5Y | -25.72% |
| P/S | 1.19 | EPS next 5Y | 7.50% |
| P/B | 5.16 | EPS Q/Q | 186.04% |
| Dividend | 3.30% | Sales Q/Q | -4.75% |
| Insider Own | 0.43% | Inst Own | 95.32% |
| Insider Trans | -4.79% | Inst Trans | 0.31% |
| Short Float | 2.03% | Earnings | May 02/a |
| Analyst Recom | 1.92 | Target Price | 22.67 |
| Avg Volume | 9.67M | 52W Range | 11.43 - 22.60 |
|
|
| Today | Downgrade |
Seaport Research Partners |
Buy → Neutral |
|
|
|
|
The AES Corp. engages in the provision of power generation and utility services through its renewable and thermal generation facilities and distribution businesses. It operates through the following segments: U.S. and Utilities Strategic Business Unit (SBU), South America SBU, MCAC SBU, Eurasia SBU. The U.S. and Utilities SBU segment consists of facilities in the United States, Puerto Rico and El Salvador. The South America SBU segment covers Chile, Colombia, Argentina, and Brazil. The MCAC SBU segment refers to Mexico, Central America, and the Caribbean. The Eurasia SBU segment handles operations in Europe and Asia. The company was founded by Dennis W. Bakke and Roger W. Sant in 1981 and is headquartered in Arlington, VA. |
| Insider Trading |
Relationship |
Date |
Transaction |
Cost |
#Shares |
Value ($) |
#Shares Total |
SEC Form 4 |
| Mendoza Tish | EVP & Chief HR Officer | May 20 '24 | Option Exercise | 11.89 | 66,250 | 787,712 | 265,731 | May 21 04:20 PM | | Da Santos Bernerd | EVP and President, Renewables | May 20 '24 | Option Exercise | 11.89 | 66,250 | 787,712 | 366,922 | May 21 04:22 PM | | Mendoza Tish | EVP & Chief HR Officer | May 20 '24 | Sale | 21.21 | 66,250 | 1,405,162 | 199,481 | May 21 04:20 PM | | Da Santos Bernerd | EVP and President, Renewables | May 20 '24 | Sale | 21.15 | 66,250 | 1,401,188 | 300,672 | May 21 04:22 PM | | Falu Ricardo Manuel | EVP, COO, Pres. New Enrgy Tech | Mar 12 '24 | Buy | 16.01 | 6 | 96 | 84,785 | Apr 15 07:50 PM |
|
|
 |
 |
| Market Cap | 6.31B | EPS (ttm) | 0.65 |
| P/E | 30.61 | EPS this Y | 16.55% |
| Forward P/E | 17.08 | EPS next Y | 21.29% |
| PEG | 2.49 | EPS past 5Y | -12.02% |
| P/S | 1.90 | EPS next 5Y | 12.31% |
| P/B | 1.79 | EPS Q/Q | -28.06% |
| Dividend | - | Sales Q/Q | 6.93% |
| Insider Own | 0.17% | Inst Own | 72.24% |
| Insider Trans | 0.00% | Inst Trans | -0.35% |
| Short Float | 0.57% | Earnings | May 28/b |
| Analyst Recom | 1.64 | Target Price | 24.16 |
| Avg Volume | 565.37K | 52W Range | 18.26 - 25.04 |
|
|
| Today | Downgrade |
Desjardins |
Buy → Hold |
|
|
|
|
CAE, Inc. engages in the provision of digital immersion and training services for the civil aviation, defense and security, and healthcare markets. It operates through the following segments: Civil Aviation, Defense and Security, and Healthcare. The Civil Aviation segment focuses on aviation professionals, airlines, business aviation operators, and aircraft manufacturers. The Defense and Security segment offers a portfolio of training centers, training services, and simulation products across the air, land, naval, and public safety market. The Healthcare segment includes patient simulation, interventional and imaging simulation, center management solutions, and learning modules. The company was founded by Kenneth R. Patrick in 1947 and is headquartered in Saint-Laurent, Canada. |
|
|
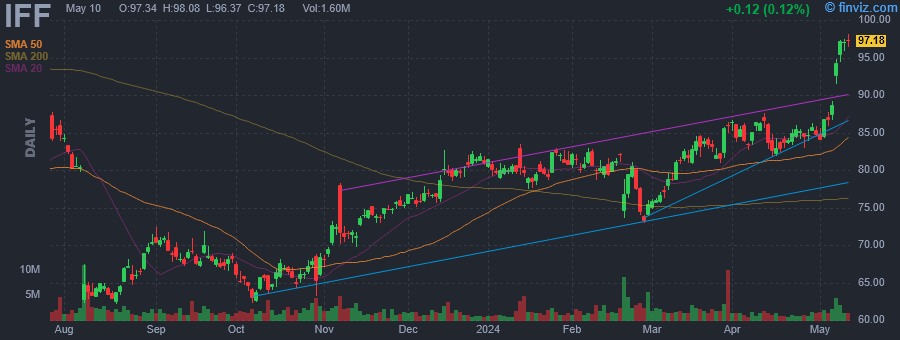 |
| Market Cap | 25.00B | EPS (ttm) | -9.79 |
| P/E | - | EPS this Y | 18.61% |
| Forward P/E | 22.78 | EPS next Y | 8.49% |
| PEG | - | EPS past 5Y | - |
| P/S | 2.20 | EPS next 5Y | 11.67% |
| P/B | 1.75 | EPS Q/Q | 764.02% |
| Dividend | 1.84% | Sales Q/Q | -4.23% |
| Insider Own | 10.00% | Inst Own | 84.54% |
| Insider Trans | 0.00% | Inst Trans | -0.77% |
| Short Float | 1.90% | Earnings | May 06/a |
| Analyst Recom | 2.50 | Target Price | 95.91 |
| Avg Volume | 2.22M | 52W Range | 62.11 - 99.91 |
|
|
| Today | Downgrade |
Morgan Stanley |
Overweight → Equal-Weight |
$100 |
|
|
|
International Flavors & Fragrances, Inc. engages in the manufacture and supply of flavors and fragrances used in the food, beverage, personal care, and household products industries. It operates through the following segments: Nourish, Health & Biosciences, Scent and Pharma Solutions. The Nourish segment consists of legacy Taste segment combined with N&B's Food & Beverage division and the food protection business of N&B's Health & Biosciences division. The Health & Biosciences business consists of a biotechnology-driven portfolio of enzymes, food cultures, probiotics and specialty ingredients for food, home and personal care, and health and wellness applications. The Scent business creates fragrance compounds, fragrance ingredients and cosmetic ingredients that are integral elements in the world's finest perfumes and best-known household and personal care products. The Pharma Solutions business produces a vast portfolio including cellulosics and seaweed-based pharma excipients, used to improve the functionality and delivery of active pharmaceutical ingredients, including controlled or modified drug release formulations, and enabling. The company was founded in 1833 and is headquartered in New York, NY. |
| Insider Trading |
Relationship |
Date |
Transaction |
Cost |
#Shares |
Value ($) |
#Shares Total |
SEC Form 4 |
| Teles de Mendonca Ana Paula | President, Scent | May 06 '24 | Option Exercise | 0.00 | 726 | 0 | 1,178 | May 07 07:06 PM | | Arora Yuvraj | President, Nourish | May 03 '24 | Option Exercise | 0.00 | 11,538 | 0 | 11,538 | May 07 06:54 PM | | Borg Deborah | EVP, Chief HR and D&I Officer | May 03 '24 | Option Exercise | 0.00 | 1,768 | 0 | 17,188 | May 07 06:55 PM | | Costa Mark J | Director | May 03 '24 | Option Exercise | 0.00 | 1,671 | 0 | 2,139 | May 07 06:55 PM | | Bruno Barry A. | Director | May 03 '24 | Option Exercise | 0.00 | 1,671 | 0 | 3,205 | May 07 06:55 PM |
|
|
| |
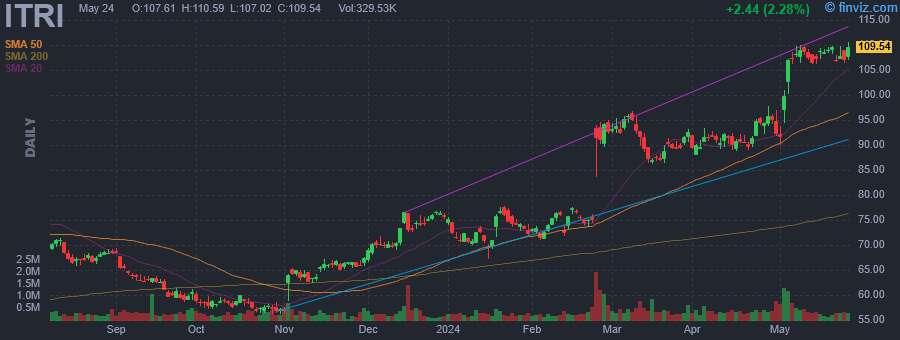 |
| Market Cap | 4.91B | EPS (ttm) | 3.49 |
| P/E | 30.70 | EPS this Y | 20.40% |
| Forward P/E | 23.88 | EPS next Y | 10.81% |
| PEG | 1.18 | EPS past 5Y | - |
| P/S | 2.15 | EPS next 5Y | 26.00% |
| P/B | 3.60 | EPS Q/Q | 526.82% |
| Dividend | - | Sales Q/Q | 22.00% |
| Insider Own | 0.93% | Inst Own | 99.40% |
| Insider Trans | -8.75% | Inst Trans | 1.45% |
| Short Float | 3.32% | Earnings | May 02/b |
| Analyst Recom | 2.00 | Target Price | 111.73 |
| Avg Volume | 509.93K | 52W Range | 56.11 - 109.97 |
|
|
| Today | Downgrade |
Piper Sandler |
Overweight → Neutral |
$109 |
|
|
|
Itron, Inc. is a technology and services company, which engages in the provision of solutions that measure, manage, and analyze energy and water use. It operates through the following segments: Device Solutions, Networked Solutions, and Outcomes. The Device Solutions segment includes hardware products used for measurement, control, or sensing that do not have communications capability embedded for use with its broader Itron systems. The Networked Solutions segment offers a combination of communicating devices, network infrastructure, and associated application software designed and sold as a complete solution for acquiring and transporting robust application-specific data. The Outcomes segment consist of the firm's value-added, enhanced software and services operating segment in which it manage, organize, analyze, and interpret data to improve decision making, maximize operational profitability, drive resource efficiency, and deliver results for consumers, utilities, and smart cities. The company was founded in 1977 and is headquartered in Liberty Lake, WA. |
| Insider Trading |
Relationship |
Date |
Transaction |
Cost |
#Shares |
Value ($) |
#Shares Total |
SEC Form 4 |
| Ware Christopher E. | SVP, GC & Corp. Secretary | May 13 '24 | Sale | 106.84 | 311 | 33,226 | 15,371 | May 14 04:16 PM | | Pulatie-Hahn Laurie Ann | SVP, HR | May 13 '24 | Sale | 106.84 | 306 | 32,692 | 18,525 | May 14 03:42 PM | | Deitrich Thomas | President & CEO | Mar 25 '24 | Option Exercise | 35.13 | 8,538 | 299,940 | 207,036 | Mar 26 03:32 PM | | Lande Jerome J. | Director | Mar 07 '24 | Sale | 95.25 | 14,896 | 1,418,895 | 5,750 | Mar 07 06:47 PM | | Deitrich Thomas | President & CEO | Feb 28 '24 | Sale | 91.02 | 3,353 | 305,198 | 198,498 | Feb 29 02:17 PM |
|
|
|
 |
| Market Cap | 13.50B | EPS (ttm) | 1.16 |
| P/E | 26.67 | EPS this Y | 1.73% |
| Forward P/E | 16.13 | EPS next Y | 17.31% |
| PEG | 2.15 | EPS past 5Y | 17.56% |
| P/S | 3.43 | EPS next 5Y | 12.40% |
| P/B | 7.12 | EPS Q/Q | -29.89% |
| Dividend | - | Sales Q/Q | 8.75% |
| Insider Own | - | Inst Own | 1.82% |
| Insider Trans | - | Inst Trans | 8.71% |
| Short Float | 0.01% | Earnings | May 20/a |
| Analyst Recom | 2.47 | Target Price | 36.24 |
| Avg Volume | 37.70K | 52W Range | 24.18 - 41.98 |
|
|
| Today | Upgrade |
Macquarie |
Neutral → Outperform |
|
| Today | Downgrade |
JP Morgan |
Overweight → Neutral |
|
|
|
|
James Hardie Industries Plc engages in the manufacture of fiber cement siding and backer board. It operates through the following segments: North America Fiber Cement, Asia Pacific Fiber Cement, Europe Building Products, and Research & Development. The North America Fiber Cement segment manufactures fiber cement interior linings, exterior siding products and related accessories in the United States. The Asia Pacific Fiber Cement segment includes all fiber cement products manufactured in Australia and the Philippines, and sold in Australia, New Zealand, Asia, the Middle East and Pacific Islands. The Europe Building Products segment encompasses the Fermacell business and fiber cement product manufactured in the United States that is sold in Europe. The Research and Development segment represents the cost incurred by the research and development centers. The company was founded in 1888 and is headquartered in Dublin, Ireland. |
|
| |
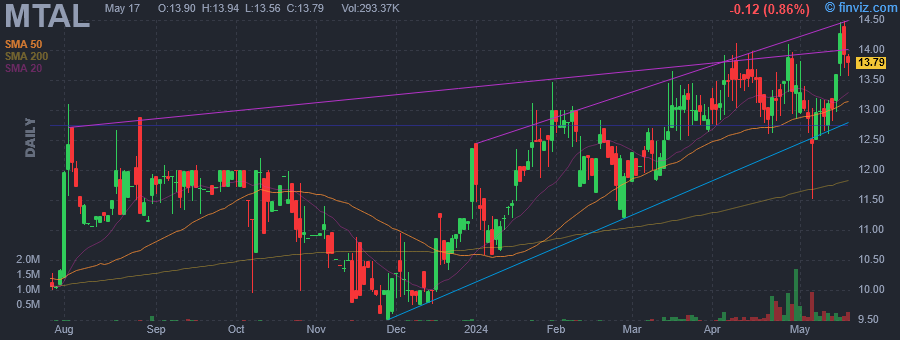 |
| Market Cap | 945.93M | EPS (ttm) | -0.78 |
| P/E | - | EPS this Y | 104.02% |
| Forward P/E | 28.56 | EPS next Y | 336.39% |
| PEG | - | EPS past 5Y | - |
| P/S | 50.91 | EPS next 5Y | - |
| P/B | 1.90 | EPS Q/Q | -556.10% |
| Dividend | - | Sales Q/Q | - |
| Insider Own | 35.84% | Inst Own | 29.59% |
| Insider Trans | 0.00% | Inst Trans | 1.07% |
| Short Float | 0.16% | Earnings | Apr 29/a |
| Analyst Recom | 1.50 | Target Price | 15.67 |
| Avg Volume | 198.24K | 52W Range | 8.49 - 14.49 |
|
|
| Today | Downgrade |
BMO Capital Markets |
Outperform → Market Perform |
$13 → $12 |
|
|
|
Metals Acquisition Ltd. operates as a mineral exploration company. It focuses on exploration and development of copper metal. The company was founded on July 29, 2022 and is headquartered in St. Helier, Jersey. |
|
|
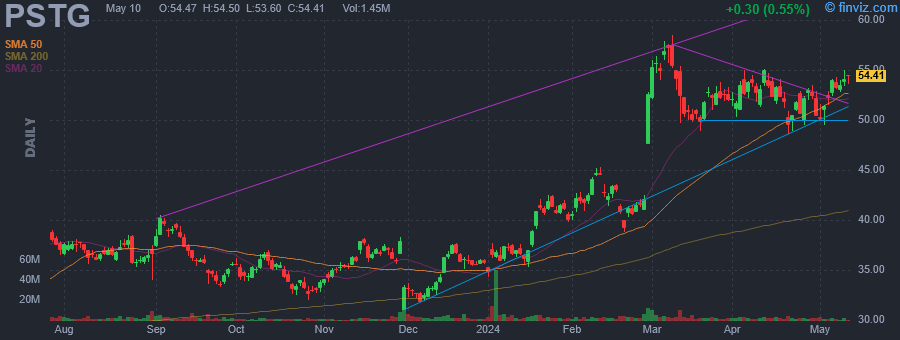 |
| Market Cap | 19.48B | EPS (ttm) | 0.17 |
| P/E | 358.96 | EPS this Y | 7.38% |
| Forward P/E | 32.78 | EPS next Y | 17.88% |
| PEG | 20.28 | EPS past 5Y | - |
| P/S | 6.88 | EPS next 5Y | 17.70% |
| P/B | 15.07 | EPS Q/Q | -10.08% |
| Dividend | - | Sales Q/Q | -2.52% |
| Insider Own | 6.14% | Inst Own | 84.21% |
| Insider Trans | -3.21% | Inst Trans | 3.18% |
| Short Float | 3.35% | Earnings | May 29/a |
| Analyst Recom | 1.43 | Target Price | 56.74 |
| Avg Volume | 3.59M | 52W Range | 24.20 - 60.51 |
|
|
| Today | Downgrade |
Barclays |
Overweight → Equal Weight |
$51 |
|
|
|
Pure Storage, Inc. engages in the business of delivering innovative and disruptive data storage, products, and services that enable customers to maximize the value of data. The firm is also involved in the provision of data storage and management with a mission to redefine the storage experience by simplifying how people consume and interact with data. The company was founded by John M. Hayes and John Colgrove in October 2009 and is headquartered in Santa Clara, CA. |
| Insider Trading |
Relationship |
Date |
Transaction |
Cost |
#Shares |
Value ($) |
#Shares Total |
SEC Form 4 |
| Krysler P. Kevan | Chief Financial Officer | Apr 17 '24 | Sale | 52.80 | 15,286 | 807,101 | 507,824 | Apr 19 04:11 PM | | FitzSimons Dan | Chief Revenue Officer | Apr 16 '24 | Sale | 52.14 | 29,283 | 1,526,816 | 138,105 | Apr 18 04:25 PM | | Brown Andrew William Fraser | Director | Apr 15 '24 | Sale | 52.31 | 20,564 | 1,075,703 | 24,400 | Apr 17 04:27 PM | | Dietzen Scott | Director | Apr 12 '24 | Sale | 53.49 | 147,000 | 7,863,030 | 100,000 | Apr 16 04:38 PM | | Singh Ajay | Chief Product Officer | Apr 05 '24 | Sale | 53.54 | 37,588 | 2,012,462 | 380,834 | Apr 09 06:32 PM |
|
|
| |
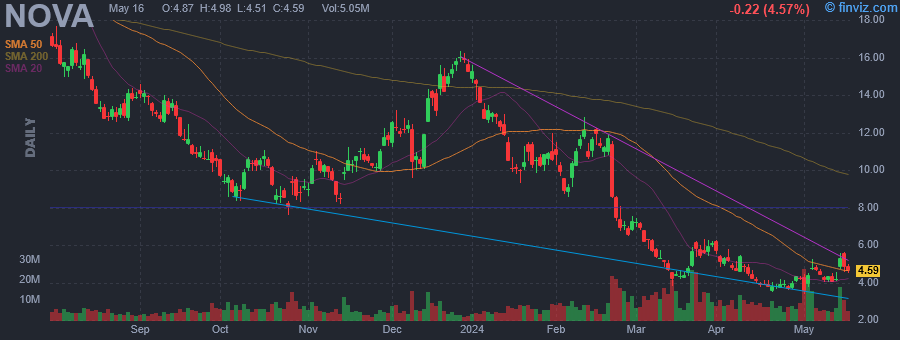 |
| Market Cap | 502.12M | EPS (ttm) | -3.37 |
| P/E | - | EPS this Y | 35.14% |
| Forward P/E | - | EPS next Y | -9.80% |
| PEG | - | EPS past 5Y | -17.44% |
| P/S | 0.70 | EPS next 5Y | -14.00% |
| P/B | 0.31 | EPS Q/Q | 19.20% |
| Dividend | - | Sales Q/Q | -0.49% |
| Insider Own | 18.30% | Inst Own | 96.26% |
| Insider Trans | 0.11% | Inst Trans | 7.73% |
| Short Float | 39.51% | Earnings | May 01/a |
| Analyst Recom | 1.75 | Target Price | 11.04 |
| Avg Volume | 10.82M | 52W Range | 3.37 - 24.56 |
|
|
| Today | Downgrade |
Piper Sandler |
Overweight → Neutral |
$9 → $4.50 |
|
|
|
Sunnova Energy International, Inc. is an energy services company, which engages in the provision of responsive energy management solutions. The firm also offers solar energy products and services. The company was founded by William Jackson Berger in 2012 and is headquartered in Houston, TX. |
| Insider Trading |
Relationship |
Date |
Transaction |
Cost |
#Shares |
Value ($) |
#Shares Total |
SEC Form 4 |
| MORGAN MICHAEL C | Director | May 17 '24 | Option Exercise | 0.00 | 7,566 | 0 | 7,566 | May 17 06:35 PM | | Andrew Anne S | Director | May 17 '24 | Option Exercise | 0.00 | 12,948 | 0 | 12,948 | May 17 06:38 PM | | Mohamed Akbar | Director | May 17 '24 | Option Exercise | 0.00 | 11,798 | 0 | 247,937 | May 17 06:40 PM | | Brownell Nora Mead | Director | May 17 '24 | Option Exercise | 0.00 | 12,610 | 0 | 35,299 | May 17 06:39 PM | | SHAPER C PARK | Director | May 17 '24 | Option Exercise | 0.00 | 7,566 | 0 | 19,126 | May 17 06:41 PM |
|
|
|
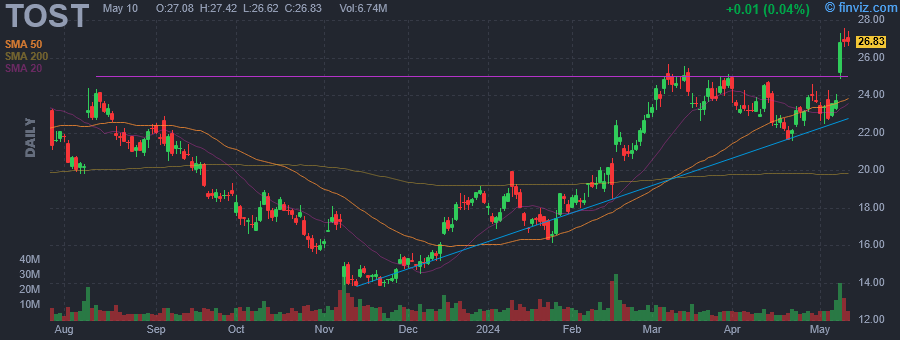 |
| Market Cap | 14.73B | EPS (ttm) | -0.46 |
| P/E | - | EPS this Y | 377.45% |
| Forward P/E | 39.04 | EPS next Y | 56.46% |
| PEG | - | EPS past 5Y | -2.90% |
| P/S | 3.57 | EPS next 5Y | -14.83% |
| P/B | 12.17 | EPS Q/Q | 1.88% |
| Dividend | - | Sales Q/Q | 31.26% |
| Insider Own | 31.70% | Inst Own | 61.15% |
| Insider Trans | -0.61% | Inst Trans | 5.91% |
| Short Float | 6.98% | Earnings | May 07/a |
| Analyst Recom | 2.19 | Target Price | 27.62 |
| Avg Volume | 7.18M | 52W Range | 13.77 - 27.90 |
|
|
| Today | Downgrade |
Robert W. Baird |
Outperform → Neutral |
$28 |
|
|
|
Toast, Inc. engages in the development and provision of consumer payment application for restaurants. It offers terminals, kiosk, guest facing display, and system accessories. The firm also offers point of sale, reporting and analytics, online ordering and delivery, and kitchen display system. The company was founded by Jonathan Grimm, Aman Narang, and Stephen J. Fredette in December 2011 and is headquartered in Boston, MA. |
| Insider Trading |
Relationship |
Date |
Transaction |
Cost |
#Shares |
Value ($) |
#Shares Total |
SEC Form 4 |
| Matlock James Michael | Principal Accounting Officer | May 15 '24 | Sale | 27.64 | 700 | 19,349 | 45,810 | May 17 04:33 PM | | Gomez Elena | Chief Financial Officer | May 08 '24 | Sale | 26.39 | 12,500 | 329,841 | 176,980 | May 09 04:14 PM | | Matlock James Michael | Principal Accounting Officer | May 03 '24 | Sale | 23.19 | 4,151 | 96,250 | 46,510 | May 06 04:38 PM | | Matlock James Michael | Principal Accounting Officer | May 02 '24 | Sale | 22.96 | 6,098 | 140,010 | 50,661 | May 03 04:21 PM | | Gomez Elena | Chief Financial Officer | May 02 '24 | Sale | 22.96 | 2,041 | 46,861 | 189,480 | May 03 04:22 PM |
|
|
|
 |
| Market Cap | 9.63B | EPS (ttm) | 1.12 |
| P/E | 154.69 | EPS this Y | 24.72% |
| Forward P/E | 25.81 | EPS next Y | 22.42% |
| PEG | 4.82 | EPS past 5Y | - |
| P/S | 5.99 | EPS next 5Y | 32.10% |
| P/B | - | EPS Q/Q | 322.69% |
| Dividend | - | Sales Q/Q | 12.22% |
| Insider Own | 3.93% | Inst Own | 85.17% |
| Insider Trans | 0.00% | Inst Trans | 3.22% |
| Short Float | 2.17% | Earnings | May 20/b |
| Analyst Recom | 1.55 | Target Price | 180.97 |
| Avg Volume | 604.49K | 52W Range | 73.39 - 170.41 |
|
|
| Today | Downgrade |
Piper Sandler |
Overweight → Neutral |
$165 → $184 |
| Today | Reiterated |
Oppenheimer |
Outperform |
$160 → $200 |
| Today | Reiterated |
Needham |
Buy |
$160 → $190 |
|
|
|
Wix.com Ltd. operates a cloud-based website design and development platform. It offers web templates, web editor, web builder, search engine optimization tools, logo maker, web hosting, and electronic mail marketing services. The company was founded by Avishai Abrahami, Nadav Abrahami, and Giora Kaplan on October 5, 2006, and is headquartered in Tel Aviv, Israel. |
|
|
