 |
| Market Cap | 4.71B | EPS (ttm) | 4.02 |
| P/E | 25.45 | EPS this Y | 4.18% |
| Forward P/E | 21.82 | EPS next Y | 9.43% |
| PEG | 1.90 | EPS past 5Y | 12.93% |
| P/S | 2.31 | EPS next 5Y | 13.40% |
| P/B | 3.86 | EPS Q/Q | -11.35% |
| Dividend | 0.98% | Sales Q/Q | -4.88% |
| Insider Own | 14.13% | Inst Own | 81.65% |
| Insider Trans | -0.38% | Inst Trans | 2.24% |
| Short Float | 1.36% | Earnings | Apr 30/b |
| Analyst Recom | 2.20 | Target Price | 103.00 |
| Avg Volume | 193.85K | 52W Range | 82.61 - 107.89 |
|
|
|
|
Franklin Electric Co., Inc. engages in the development, manufacture, and distribution of water and fuel pumping systems. It operates through the following business segments: Water Systems, Fueling Systems, and Distribution. The Water Systems segment designs, manufactures, and sells water pumping systems, submersible motors, pumps, electronic controls, and related parts and equipment. The Fueling Systems segment is involved in the producing and marketing of fuel pumping, fuel containment, and monitor and control systems. The Distribution Segment offers pre-sale support and specifications to the installing contractors. The company was founded by Edward J. Schaefer and T. Wayne Kehoe in 1944 and is headquartered in Fort Wayne, IN. |
| Insider Trading |
Relationship |
Date |
Transaction |
Cost |
#Shares |
Value ($) |
#Shares Total |
SEC Form 4 |
| davis delancey w | President, Headwater Companies | May 09 '24 | Option Exercise | 73.14 | 2,889 | 211,301 | 10,903 | May 10 09:57 PM | | davis delancey w | President, Headwater Companies | May 09 '24 | Sale | 102.06 | 2,214 | 225,961 | 8,014 | May 10 09:57 PM | | davis delancey w | President, Headwater Companies | Mar 08 '24 | Sale | 103.32 | 2,335 | 241,252 | 8,014 | Mar 11 05:00 PM | | SENGSTACK GREGG C | Chairperson and CEO | Feb 26 '24 | Sale | 99.96 | 10,366 | 1,036,162 | 154,993 | Feb 26 08:24 PM | | PETERSON RENEE J | Director | Jan 01 '24 | Option Exercise | 96.65 | 725 | 70,060 | 725 | Jan 03 11:38 AM |
|
|
 |
 |
| Market Cap | 12.87B | EPS (ttm) | -3.13 |
| P/E | - | EPS this Y | 35.48% |
| Forward P/E | - | EPS next Y | 50.51% |
| PEG | - | EPS past 5Y | -11.28% |
| P/S | 10.65 | EPS next 5Y | - |
| P/B | 16.21 | EPS Q/Q | 54.33% |
| Dividend | - | Sales Q/Q | 52.11% |
| Insider Own | 6.31% | Inst Own | 92.02% |
| Insider Trans | -15.93% | Inst Trans | 1.75% |
| Short Float | 5.38% | Earnings | May 09/a |
| Analyst Recom | 1.50 | Target Price | 116.78 |
| Avg Volume | 1.41M | 52W Range | 36.90 - 98.82 |
|
|
|
|
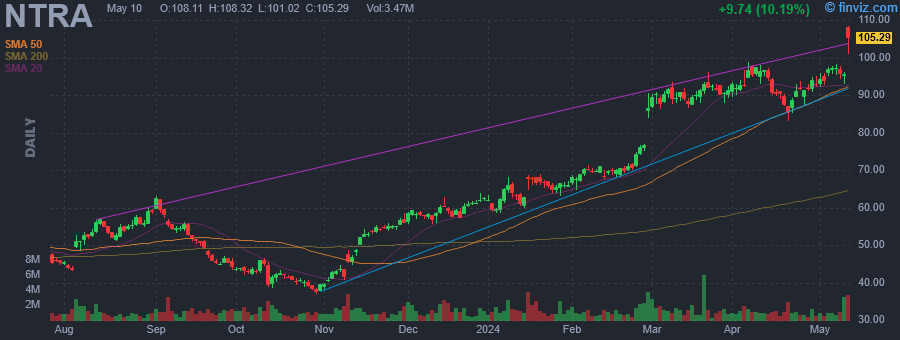
Natera, Inc. is a diagnostics company, which engages in the discovery, development, and commercialization of genetic testing services. It provides Panorama non-invasive prenatal test (NIPT), Vistara, horizon carrier screening (HCS), spectrum pre-implantation genetic screening and spectrum pre-implantation genetic diagnosis, Anora products of conception (POC) and non-invasive paternity testing (PAT). The company was founded by Matthew Rabinowitz and Jonathan Sheena in November 2003 and is headquartered in Austin, TX. |
| Insider Trading |
Relationship |
Date |
Transaction |
Cost |
#Shares |
Value ($) |
#Shares Total |
SEC Form 4 |
| RABINOWITZ DANIEL | SEC. AND CHIEF LEGAL OFFICER | May 10 '24 | Option Exercise | 19.68 | 30,000 | 590,400 | 234,495 | May 10 09:35 PM | | RABINOWITZ DANIEL | SEC. AND CHIEF LEGAL OFFICER | May 10 '24 | Sale | 104.59 | 30,000 | 3,137,567 | 204,495 | May 10 09:35 PM | | Sheena Jonathan | CO-FOUNDER | May 10 '24 | Sale | 105.11 | 2,700 | 283,794 | 319,061 | May 10 09:35 PM | | Rabinowitz Matthew | EXECUTIVE CHAIRMAN | May 08 '24 | Option Exercise | 5.40 | 215,000 | 1,159,990 | 1,290,648 | May 10 09:35 PM | | Brophy Michael Burkes | CHIEF FINANCIAL OFFICER | May 01 '24 | Sale | 93.97 | 1,866 | 175,344 | 67,542 | May 03 09:35 PM |
|
|
|
 |
| Market Cap | 10.36B | EPS (ttm) | 0.20 |
| P/E | 164.79 | EPS this Y | 6.77% |
| Forward P/E | 11.86 | EPS next Y | 389.13% |
| PEG | - | EPS past 5Y | - |
| P/S | 2.38 | EPS next 5Y | - |
| P/B | 1.47 | EPS Q/Q | -82.96% |
| Dividend | - | Sales Q/Q | -13.21% |
| Insider Own | 7.45% | Inst Own | 81.64% |
| Insider Trans | -8.09% | Inst Trans | -3.32% |
| Short Float | 4.15% | Earnings | Apr 24/a |
| Analyst Recom | 2.13 | Target Price | 34.44 |
| Avg Volume | 4.99M | 52W Range | 19.91 - 34.99 |
|
|
|
|
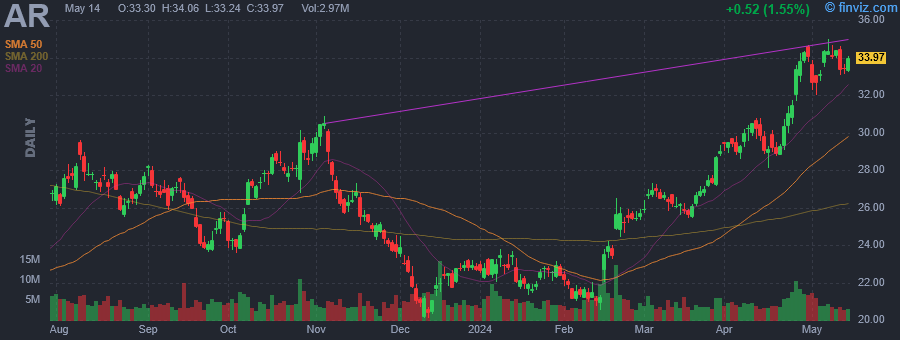
Antero Resources Corp. engages in the development, production, exploration, and acquisition of natural gas. It operates through the following segments: Exploration and Production, Marketing, and Equity Method Investment in Antero Midstream. The Exploration and Production segment deals with the development and production of natural gas, NGLs, and oil. The Marketing segment refers to marketing and utilization of excess firm transportation capacity. The Equity Method Investment in Antero Midstream segment represents midstream services. The company was founded by Paul M. Rady and Glen C. Warren, Jr. in June 2002 and is headquartered in Denver, CO. |
| Insider Trading |
Relationship |
Date |
Transaction |
Cost |
#Shares |
Value ($) |
#Shares Total |
SEC Form 4 |
| Keenan W Howard JR | Director | May 10 '24 | Sale | 33.30 | 162,993 | 5,427,667 | 2,000,000 | May 10 09:32 PM | | Keenan W Howard JR | Director | May 09 '24 | Sale | 34.23 | 300,000 | 10,269,000 | 2,162,993 | May 09 06:44 PM | | Keenan W Howard JR | Director | May 08 '24 | Sale | 34.35 | 437,007 | 15,011,190 | 2,462,993 | May 09 06:44 PM | | Keenan W Howard JR | Director | May 07 '24 | Sale | 34.53 | 100,000 | 3,453,000 | 2,900,000 | May 09 06:44 PM | | CLARK ROBERT J | Director | May 01 '24 | Sale | 33.67 | 10,000 | 336,700 | 69,963 | May 01 05:52 PM |
|
|
| |
 |
| Market Cap | 66.75M | EPS (ttm) | -1.01 |
| P/E | - | EPS this Y | 0.11% |
| Forward P/E | - | EPS next Y | 30.73% |
| PEG | - | EPS past 5Y | 14.91% |
| P/S | 0.11 | EPS next 5Y | - |
| P/B | - | EPS Q/Q | -25.86% |
| Dividend | - | Sales Q/Q | -13.03% |
| Insider Own | 18.35% | Inst Own | 57.18% |
| Insider Trans | -6.44% | Inst Trans | 10.82% |
| Short Float | 13.90% | Earnings | May 06/a |
| Analyst Recom | 3.00 | Target Price | 4.00 |
| Avg Volume | 611.38K | 52W Range | 1.78 - 5.59 |
|
|
|
|
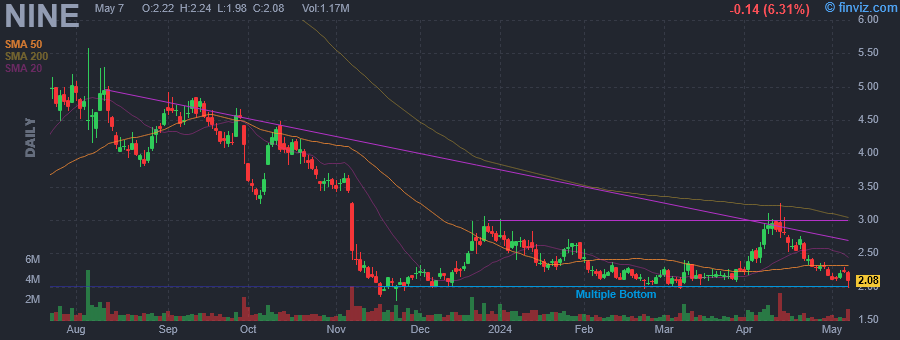
Nine Energy Service, Inc. is an oilfield services business, which engages in the provision of services integral to the completion of unconventional wells. It offers cementing services, completion tools, wireline services, and coiled tubing services. The company was founded on September 26, 2011 and is headquartered in Houston, TX. |
| Insider Trading |
Relationship |
Date |
Transaction |
Cost |
#Shares |
Value ($) |
#Shares Total |
SEC Form 4 |
| Sirkes Guy | See Remarks | May 10 '24 | Sale | 1.98 | 11,532 | 22,833 | 206,265 | May 10 09:05 PM | | DANNER ERNIE L | Director | May 09 '24 | Sale | 1.98 | 136,853 | 271,516 | 79,719 | May 10 06:32 PM | | Crombie David | See Remarks | May 09 '24 | Sale | 1.95 | 21,796 | 42,546 | 332,553 | May 10 06:33 PM | | MOORE THEODORE R. | See Remarks | May 09 '24 | Sale | 2.00 | 12,130 | 24,260 | 206,453 | May 10 06:33 PM | | Sirkes Guy | See Remarks | May 09 '24 | Sale | 1.97 | 3,987 | 7,870 | 217,797 | May 10 09:05 PM |
|
|
|
 |
| Market Cap | 1.50B | EPS (ttm) | 0.68 |
| P/E | 22.93 | EPS this Y | -62.00% |
| Forward P/E | 16.47 | EPS next Y | 4.51% |
| PEG | 25.48 | EPS past 5Y | 17.20% |
| P/S | 5.10 | EPS next 5Y | 0.90% |
| P/B | 3.46 | EPS Q/Q | -47.00% |
| Dividend | 10.73% | Sales Q/Q | 22.90% |
| Insider Own | 1.50% | Inst Own | 32.90% |
| Insider Trans | -9.76% | Inst Trans | -4.92% |
| Short Float | 2.50% | Earnings | May 02/b |
| Analyst Recom | 1.50 | Target Price | 21.43 |
| Avg Volume | 325.33K | 52W Range | 14.02 - 17.11 |
|
|
|
|
Kimbell Royalty Partners, LP, together with its subsidiaries, engages in acquiring and owning mineral and royalty interests in oil and natural gas properties in the United States. It serves as the general partner of the company. The company was incorporated in 2015 and is based in Fort Worth, Texas. |
| Insider Trading |
Relationship |
Date |
Transaction |
Cost |
#Shares |
Value ($) |
#Shares Total |
SEC Form 4 |
| Taylor Brett G. | Director | May 09 '24 | Sale | 16.52 | 50,000 | 826,000 | 249,030 | May 10 08:11 PM | | Taylor Brett G. | Director | Mar 19 '24 | Sale | 15.51 | 27,163 | 421,298 | 299,030 | Mar 19 09:13 PM | | Rhynsburger Blayne | Controller | Mar 19 '24 | Sale | 15.60 | 6,487 | 101,197 | 55,164 | Mar 20 07:53 PM | | Taylor Brett G. | Director | Mar 11 '24 | Sale | 15.71 | 16,889 | 265,326 | 326,193 | Mar 13 06:59 PM | | Taylor Brett G. | Director | Mar 07 '24 | Sale | 15.55 | 5,480 | 85,214 | 343,082 | Mar 07 07:04 PM |
|
|
| |
 |
| Market Cap | 45.88B | EPS (ttm) | 0.13 |
| P/E | 162.59 | EPS this Y | 31.57% |
| Forward P/E | 52.03 | EPS next Y | 20.36% |
| PEG | - | EPS past 5Y | - |
| P/S | 19.65 | EPS next 5Y | - |
| P/B | 12.15 | EPS Q/Q | 478.95% |
| Dividend | - | Sales Q/Q | 20.78% |
| Insider Own | 15.07% | Inst Own | 39.60% |
| Insider Trans | -7.51% | Inst Trans | 4.34% |
| Short Float | 4.16% | Earnings | May 06/a |
| Analyst Recom | 3.20 | Target Price | 21.63 |
| Avg Volume | 57.04M | 52W Range | 9.02 - 27.50 |
|
|
|
|
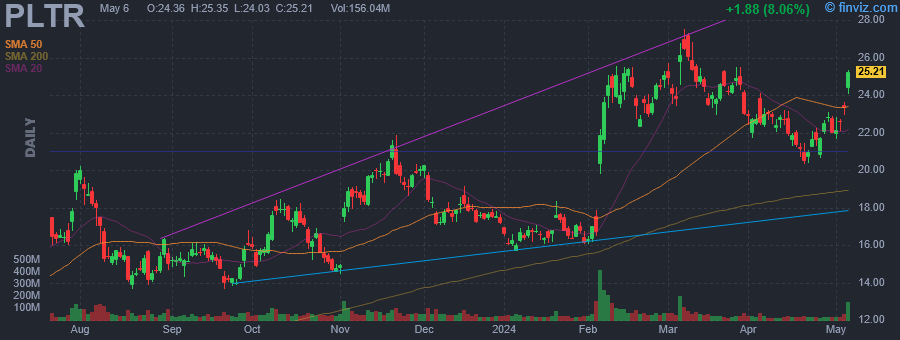
Palantir Technologies, Inc. engages in the business of building and deploying software platforms that serve as the central operating systems for its customers. It operates under the Commercial and Government segments. The Commercial segment focuses on customers working in non-government industries. The Government segment is involved in providing services to customers that are the United States government and non-United States government agencies. The company was founded by Alexander Ceadmon Karp, Peter Andreas Thiel, Stephen Cohen, and Nathan Dale Gettings in 2003 and is headquartered in Denver, CO. |
| Insider Trading |
Relationship |
Date |
Transaction |
Cost |
#Shares |
Value ($) |
#Shares Total |
SEC Form 4 |
| THIEL PETER | Director | May 10 '24 | Sale | 20.78 | 5,000,000 | 103,920,000 | 15,733,625 | May 10 08:09 PM | | THIEL PETER | Director | May 09 '24 | Sale | 21.26 | 1,669,411 | 35,491,845 | 62,851,188 | May 10 08:09 PM | | THIEL PETER | Director | May 08 '24 | Sale | 21.33 | 6,285,833 | 134,078,704 | 64,520,599 | May 10 08:09 PM | | Moore Alexander D. | Director | May 01 '24 | Sale | 22.02 | 20,000 | 440,306 | 1,595,519 | May 03 06:16 PM | | Palantir Technologies Inc. | Former 10% Owner | Apr 24 '24 | Sale | 0.37 | 18,621 | 6,972 | 5,233,625 | Apr 24 08:25 PM |
|
|
|
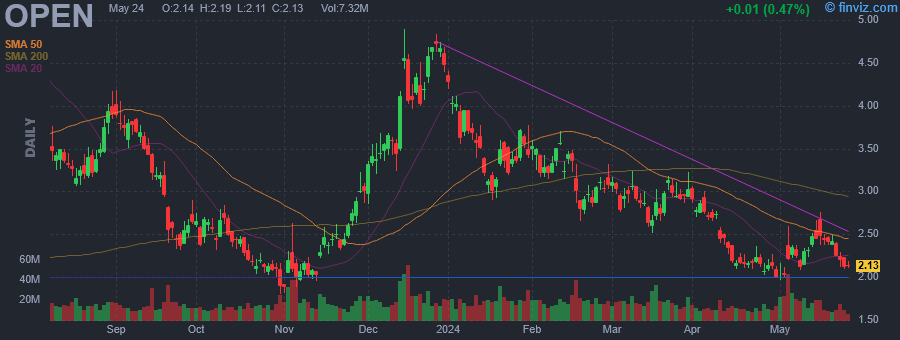 |
| Market Cap | 1.60B | EPS (ttm) | -0.42 |
| P/E | - | EPS this Y | -44.43% |
| Forward P/E | - | EPS next Y | 21.07% |
| PEG | - | EPS past 5Y | 44.03% |
| P/S | 0.32 | EPS next 5Y | 5.20% |
| P/B | 1.78 | EPS Q/Q | -1.53% |
| Dividend | - | Sales Q/Q | -62.15% |
| Insider Own | 19.84% | Inst Own | 56.22% |
| Insider Trans | -1.49% | Inst Trans | -3.59% |
| Short Float | 12.81% | Earnings | May 02/a |
| Analyst Recom | 2.92 | Target Price | 2.61 |
| Avg Volume | 18.46M | 52W Range | 1.80 - 5.41 |
|
|
|
|
Opendoor Technologies, Inc. engages in the operation of buying, selling, and trading of residential properties online. The company was founded by Eric Wu on December 30, 2013, and is headquartered in Tempe, AZ. |
| Insider Trading |
Relationship |
Date |
Transaction |
Cost |
#Shares |
Value ($) |
#Shares Total |
SEC Form 4 |
| Meyer Megan D. | President, Sell Direct & Svcs. | May 09 '24 | Sale | 2.26 | 4,808 | 10,875 | 4,687,836 | May 10 08:06 PM | | Schaub Sydney | Chief Legal Officer | May 07 '24 | Sale | 2.33 | 2,513 | 5,855 | 1,448,826 | May 08 07:29 PM | | Meyer Megan D. | President, Sell Direct & Svcs. | Apr 25 '24 | Sale | 2.06 | 4,808 | 9,904 | 4,692,644 | Apr 26 04:04 PM | | Schwartz Christina | See Remarks | Apr 16 '24 | Sale | 2.12 | 3,566 | 7,578 | 826,599 | Apr 17 06:25 PM | | Meyer Megan D. | President, Sell Direct & Svcs. | Apr 15 '24 | Sale | 2.25 | 91,048 | 205,040 | 4,697,452 | Apr 17 06:24 PM |
|
|
| |
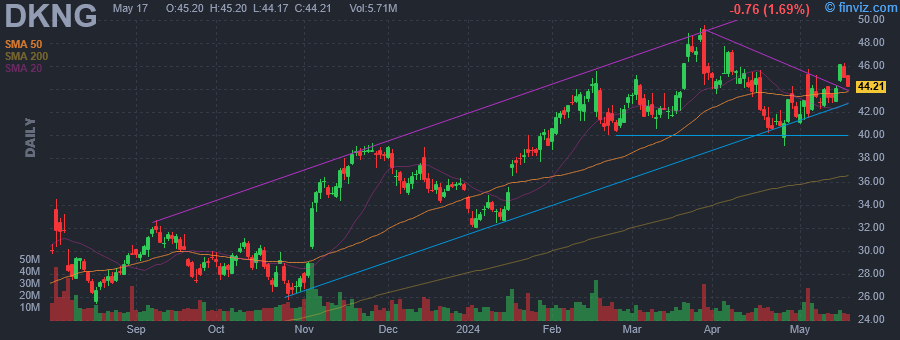 |
| Market Cap | 20.61B | EPS (ttm) | -1.17 |
| P/E | - | EPS this Y | 92.44% |
| Forward P/E | 52.00 | EPS next Y | 736.33% |
| PEG | - | EPS past 5Y | -22.37% |
| P/S | 5.06 | EPS next 5Y | - |
| P/B | 24.79 | EPS Q/Q | 65.56% |
| Dividend | - | Sales Q/Q | 52.67% |
| Insider Own | 4.28% | Inst Own | 65.86% |
| Insider Trans | -22.50% | Inst Trans | 1.98% |
| Short Float | 4.11% | Earnings | May 02/a |
| Analyst Recom | 1.55 | Target Price | 52.40 |
| Avg Volume | 11.32M | 52W Range | 22.65 - 49.57 |
|
|
|
|
DraftKings, Inc. is a digital sports entertainment and gaming company, which engages in the provision of online sports betting, online casino, daily fantasy sports product offerings, DraftKings Marketplace, retail sportsbook, media, and other consumer product offerings. It operates through the following segments: Business-to-Consumer (B2C) and Business-to-Business (B2B). The Business-to-Consumer segment includes sportsbook, iGaming and DFS product offerings, as well as media and other consumer product offerings. The Business-to-Business segment includes design and development of gaming software. The company was founded by Jason D. Robins, Matthew Kalish, and Paul Liberman on December 31, 2011 and is headquartered in Boston, MA. |
| Insider Trading |
Relationship |
Date |
Transaction |
Cost |
#Shares |
Value ($) |
#Shares Total |
SEC Form 4 |
| Kalish Matthew | See Remarks | May 08 '24 | Option Exercise | 4.70 | 21,302 | 100,119 | 3,437,638 | May 10 08:03 PM | | Robins Jason | See Remarks | May 08 '24 | Sale | 42.67 | 200,000 | 8,534,000 | 2,849,215 | May 10 08:02 PM | | Robins Jason | See Remarks | Apr 22 '24 | Sale | 40.91 | 200,000 | 8,182,006 | 3,043,231 | Apr 24 08:01 PM | | Robins Jason | See Remarks | Feb 21 '24 | Sale | 40.89 | 200,000 | 8,178,308 | 3,195,812 | Feb 23 08:04 PM | | Dodge R Stanton | Chief Legal Officer | Feb 08 '24 | Option Exercise | 2.95 | 52,777 | 155,692 | 886,340 | Feb 09 09:03 PM |
|
|
|
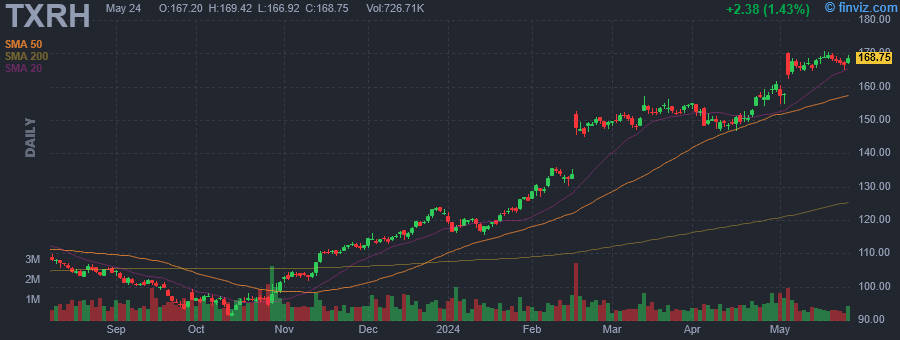 |
| Market Cap | 11.17B | EPS (ttm) | 4.94 |
| P/E | 33.83 | EPS this Y | 31.25% |
| Forward P/E | 25.36 | EPS next Y | 10.65% |
| PEG | 1.95 | EPS past 5Y | 15.61% |
| P/S | 2.34 | EPS next 5Y | 17.34% |
| P/B | 9.26 | EPS Q/Q | 31.42% |
| Dividend | 1.44% | Sales Q/Q | 12.51% |
| Insider Own | 0.54% | Inst Own | 94.79% |
| Insider Trans | -10.23% | Inst Trans | -1.60% |
| Short Float | 2.64% | Earnings | May 02/a |
| Analyst Recom | 2.18 | Target Price | 171.43 |
| Avg Volume | 832.51K | 52W Range | 91.06 - 170.39 |
|
|
|
|
Texas Roadhouse, Inc. is a full-service, casual dining restaurant chain, which offers assorted seasoned and aged steaks hand-cut daily on the premises and cooked to order over open gas-fired grills. It operates through the following segments: Texas Roadhouse, Bubba's 33, and Other. The Texas Roadhouse segment offers steaks, ribs, seafood, chicken, pork chops, pulled pork and vegetable plates, and an assortment of hamburgers, salads, and sandwiches. The Bubba's 33 segment refers to the family-friendly restaurant concept featuring scratch-made food for all with a little rock 'n' roll, ice-cold beer, and signature drinks. The Other segment includes the results of the domestic company Jaggers restaurants and the results of retail initiatives. The company was founded by Wayne Kent Taylor on February 17, 1993 and is headquartered in Louisville, KY. |
| Insider Trading |
Relationship |
Date |
Transaction |
Cost |
#Shares |
Value ($) |
#Shares Total |
SEC Form 4 |
| Doster Travis C. | CHIEF COMMUNICATIONS OFFICER | May 10 '24 | Option Exercise | 0.00 | 834 | 0 | 28,285 | May 10 08:00 PM | | MOORE GREGORY N | Director | May 09 '24 | Sale | 166.69 | 6,300 | 1,050,147 | 41,050 | May 10 08:00 PM | | Warfield Curtis | Director | May 08 '24 | Sale | 165.82 | 1,025 | 169,966 | 12,372 | May 10 08:00 PM | | EPPS DONNA E | Director | Mar 07 '24 | Sale | 149.97 | 670 | 100,480 | 4,142 | Mar 08 08:00 PM | | Tobin Regina A. | PRESIDENT | Mar 05 '24 | Sale | 150.07 | 3,064 | 459,814 | 15,261 | Mar 06 08:00 PM |
|
|
|
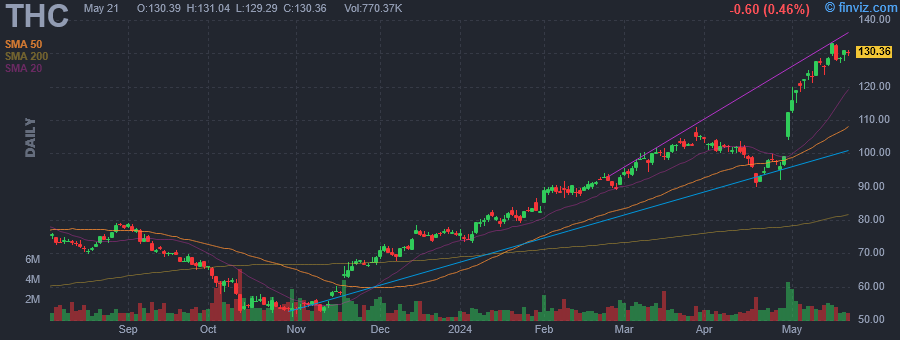 |
| Market Cap | 12.42B | EPS (ttm) | 25.87 |
| P/E | 4.92 | EPS this Y | 33.43% |
| Forward P/E | 14.12 | EPS next Y | -3.33% |
| PEG | 0.74 | EPS past 5Y | 40.40% |
| P/S | 0.59 | EPS next 5Y | 6.62% |
| P/B | 3.60 | EPS Q/Q | 1485.03% |
| Dividend | - | Sales Q/Q | 6.91% |
| Insider Own | 2.61% | Inst Own | 96.88% |
| Insider Trans | -2.96% | Inst Trans | 2.73% |
| Short Float | 3.92% | Earnings | Apr 30/b |
| Analyst Recom | 1.45 | Target Price | 132.06 |
| Avg Volume | 1.27M | 52W Range | 51.04 - 127.73 |
|
|
|
|
Tenet Healthcare Corp. engages in the provision of healthcare services. It operates through the Hospital Operations and Other, and Ambulatory Care segments. The Hospital Operations and Other segment is composed of acute care hospitals, ancillary outpatient facilities, urgent care centers, micro hospitals and physician practices. The Ambulatory Care segment includes the operations of the USPI joint venture and the company's nine Aspen facilities in the United Kingdom. The company was founded in 1969 and is headquartered in Dallas, TX. |
| Insider Trading |
Relationship |
Date |
Transaction |
Cost |
#Shares |
Value ($) |
#Shares Total |
SEC Form 4 |
| West Nadja | Director | May 09 '24 | Sale | 126.41 | 1,782 | 225,263 | 29,680 | May 10 08:00 PM | | FISHER RICHARD W | Director | May 07 '24 | Sale | 123.20 | 2,500 | 308,000 | 17,627 | May 09 08:00 PM | | Arnst Thomas W | EVP, Chief Admin. Officer & GC | May 01 '24 | Sale | 116.10 | 8,148 | 945,994 | 0 | May 03 08:00 PM | | MARK RICHARD J | Director | Mar 12 '24 | Sale | 98.98 | 14,000 | 1,385,720 | 33,303 | Mar 14 08:00 PM | | Arbour Paola M | EVP, Chief Information Officer | Mar 06 '24 | Sale | 96.96 | 18,168 | 1,761,569 | 29,803 | Mar 08 08:00 PM |
|
|
|
