 |
| Market Cap | 18.19B | EPS (ttm) | -0.46 |
| P/E | - | EPS this Y | 12.05% |
| Forward P/E | 11.16 | EPS next Y | 9.80% |
| PEG | - | EPS past 5Y | - |
| P/S | 1.22 | EPS next 5Y | 4.07% |
| P/B | 2.23 | EPS Q/Q | -16.36% |
| Dividend | 3.37% | Sales Q/Q | -1.56% |
| Insider Own | 0.70% | Inst Own | 91.64% |
| Insider Trans | -1.78% | Inst Trans | 0.70% |
| Short Float | 1.98% | Earnings | May 02/b |
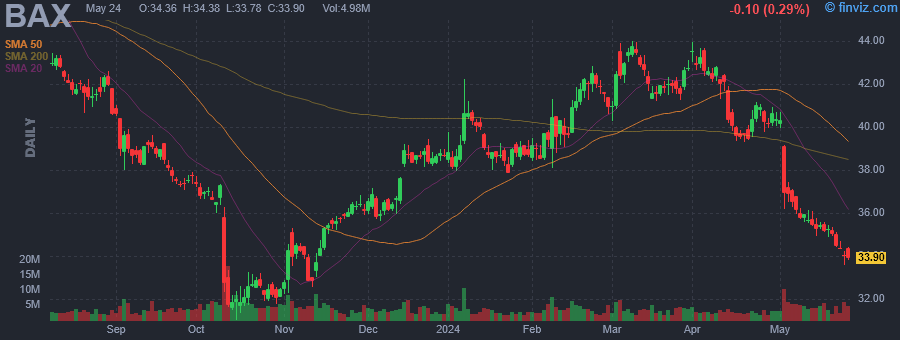
| Analyst Recom | 2.65 | Target Price | 43.75 |
| Avg Volume | 3.81M | 52W Range | 31.01 - 50.21 |
|
|
| May-10-24 | Downgrade |
TD Cowen |
Buy → Hold |
$40 |
|
|
|
Baxter International, Inc. engages in the provision of a portfolio of essential healthcare products including acute and chronic dialysis therapies, sterile intravenous (IV) solutions, infusion systems and devices, parenteral nutrition therapies, inhaled anesthetics, generic injectable pharmaceuticals, surgical hemostat and sealant products, surgical equipment, smart bed systems, patient monitoring and diagnostic technologies, and respiratory health devices. It operates through the following segments: Americas, Europe, Middle East and Africa (EMEA), Asia-Pacific (APAC), and Hillrom. The Americas, EMEA, and APAC segments offer a portfolio of essential healthcare products. The Hillrom segment provides digital and connected care solutions and collaboration tools, including smart bed systems, patient monitoring and diagnostic technologies, respiratory health devices, and equipment for the surgical space. The company was founded by Davis Baxter in 1931 and is headquartered in Deerfield, IL. |
| Insider Trading |
Relationship |
Date |
Transaction |
Cost |
#Shares |
Value ($) |
#Shares Total |
SEC Form 4 |
| Mason Jeanne K | EVP, Chief HR Officer | Mar 01 '24 | Option Exercise | 37.17 | 64,488 | 2,397,019 | 206,778 | Mar 05 04:15 PM | | Mason Jeanne K | EVP, Chief HR Officer | Mar 01 '24 | Sale | 40.61 | 64,488 | 2,618,858 | 142,290 | Mar 05 04:15 PM |
|
|
 |
 |
| Market Cap | 222.93M | EPS (ttm) | -6.83 |
| P/E | - | EPS this Y | 135.49% |
| Forward P/E | 185.19 | EPS next Y | -96.59% |
| PEG | - | EPS past 5Y | - |
| P/S | 0.64 | EPS next 5Y | 15.00% |
| P/B | 0.48 | EPS Q/Q | -927.02% |
| Dividend | - | Sales Q/Q | -0.83% |
| Insider Own | 13.91% | Inst Own | 92.38% |
| Insider Trans | -1.73% | Inst Trans | -4.16% |
| Short Float | 18.15% | Earnings | May 09/b |
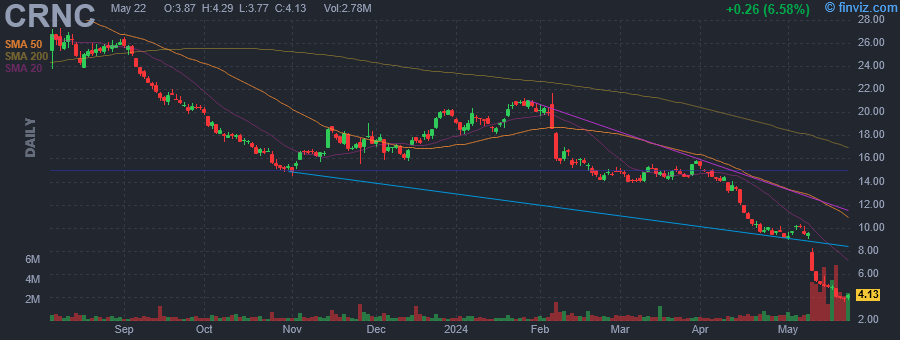
| Analyst Recom | 2.78 | Target Price | 10.07 |
| Avg Volume | 558.04K | 52W Range | 6.24 - 36.79 |
|
|
| May-10-24 | Downgrade |
Wells Fargo |
Overweight → Equal Weight |
$25 → $6.50 |
|
|
|
Cerence, Inc. engages in building artificial intelligence-powered virtual assistants for the mobility and transportation market. Its products include core technologies, cloud and professional services, voice and beyond, mobility, and platform developers. The company was founded on October 1, 2019 and is headquartered in Burlington, MA. |
| Insider Trading |
Relationship |
Date |
Transaction |
Cost |
#Shares |
Value ($) |
#Shares Total |
SEC Form 4 |
| BEAUDOIN THOMAS L | Director | May 07 '24 | Sale | 9.69 | 5,464 | 52,946 | 242,457 | May 08 04:22 PM | | BEAUDOIN THOMAS L | Director | May 01 '24 | Sale | 9.03 | 5,000 | 45,146 | 247,921 | May 02 05:08 PM | | Ortmanns Stefan | Chief Executive Officer | Apr 22 '24 | Sale | 10.04 | 10,762 | 108,045 | 526,388 | Apr 23 04:44 PM | | BEAUDOIN THOMAS L | Director | Apr 01 '24 | Sale | 15.35 | 5,000 | 76,744 | 252,921 | Apr 02 09:28 AM | | Ortmanns Stefan | Chief Executive Officer | Mar 22 '24 | Sale | 14.82 | 15,389 | 228,043 | 537,150 | Mar 25 05:15 PM |
|
|
|
 |
| Market Cap | 1.03B | EPS (ttm) | 2.40 |
| P/E | 13.12 | EPS this Y | 23.59% |
| Forward P/E | 4.32 | EPS next Y | 7.91% |
| PEG | 23.86 | EPS past 5Y | - |
| P/S | 1.82 | EPS next 5Y | 0.55% |
| P/B | 4.64 | EPS Q/Q | 239.41% |
| Dividend | - | Sales Q/Q | 0.11% |
| Insider Own | 1.47% | Inst Own | 117.99% |
| Insider Trans | -21.70% | Inst Trans | -1.94% |
| Short Float | 21.28% | Earnings | May 09/a |
| Analyst Recom | 2.33 | Target Price | 40.00 |
| Avg Volume | 422.18K | 52W Range | 20.83 - 40.95 |
|
|
| May-10-24 | Downgrade |
Piper Sandler |
Overweight → Neutral |
$39 |
| May-10-24 | Downgrade |
Needham |
Buy → Hold |
|
|
|
|
Collegium Pharmaceutical, Inc. is a pharmaceutical company, which engages in development and planning to commercialize next generation, abuse-deterrent products for the treatment of patients suffering from chronic pain and other diseases. Its products include Xtampza ER, Nucynta ER and Nucynta IR, Belbuca, and Symproic. The company was founded by Michael Thomas Heffernan in April 2002 and is headquartered in Stoughton, MA. |
| Insider Trading |
Relationship |
Date |
Transaction |
Cost |
#Shares |
Value ($) |
#Shares Total |
SEC Form 4 |
| Smith Thomas B | EVP and Chief Medical Officer | Feb 29 '24 | Sale | 36.76 | 995 | 36,580 | 63,409 | Mar 04 04:26 PM | | Dreyer Scott | EVP & Chief Commercial Officer | Feb 26 '24 | Sale | 36.43 | 10,000 | 364,270 | 138,918 | Feb 28 04:14 PM | | Dreyer Scott | EVP & Chief Commercial Officer | Jan 16 '24 | Sale | 32.28 | 23,560 | 760,519 | 111,322 | Jan 18 04:19 PM | | Ciaffoni Joseph | President and CEO | Dec 21 '23 | Option Exercise | 21.34 | 4,357 | 92,978 | 279,357 | Dec 22 04:36 PM | | Ciaffoni Joseph | President and CEO | Dec 21 '23 | Sale | 30.38 | 4,357 | 132,377 | 275,000 | Dec 22 04:36 PM |
|
|
| |
 |
| Market Cap | 10.62B | EPS (ttm) | 7.31 |
| P/E | 25.10 | EPS this Y | -4.57% |
| Forward P/E | 16.37 | EPS next Y | 10.87% |
| PEG | 3.54 | EPS past 5Y | 10.74% |
| P/S | 2.29 | EPS next 5Y | 7.10% |
| P/B | 3.06 | EPS Q/Q | 14.35% |
| Dividend | - | Sales Q/Q | -3.76% |
| Insider Own | 3.32% | Inst Own | 94.58% |
| Insider Trans | -3.44% | Inst Trans | 2.94% |
| Short Float | 1.31% | Earnings | May 09/b |
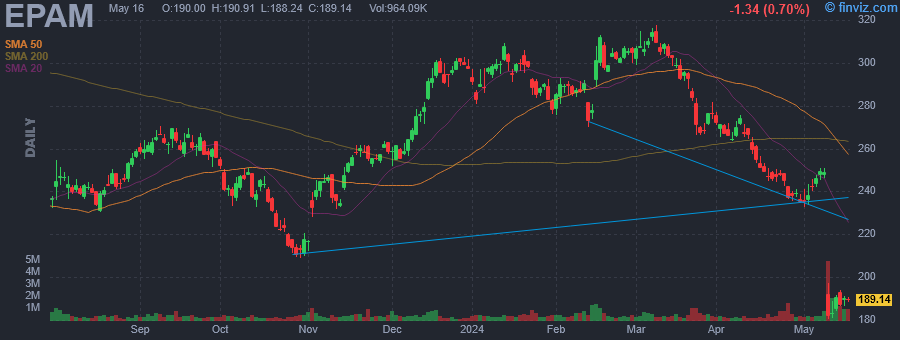
| Analyst Recom | 2.09 | Target Price | 236.46 |
| Avg Volume | 586.57K | 52W Range | 180.28 - 317.50 |
|
|
| May-10-24 | Downgrade |
Scotiabank |
Sector Outperform → Sector Perform |
$245 |
|
|
|
EPAM Systems, Inc. engages in the provision of digital engineering, cloud, and artificial intelligence-enabled transformation services. It operates through the following geographical segments: North America, Europe, and Russia. The company was founded by Leonid Lozner and Arkadiy Dobkin in 1993 and is headquartered in Newtown, PA. |
| Insider Trading |
Relationship |
Date |
Transaction |
Cost |
#Shares |
Value ($) |
#Shares Total |
SEC Form 4 |
| Dobkin Arkadiy | CEO, President, Chairman | Mar 15 '24 | Option Exercise | 32.08 | 19,000 | 609,520 | 1,294,311 | Mar 19 04:29 PM | | Dobkin Arkadiy | CEO, President, Chairman | Mar 15 '24 | Sale | 300.17 | 9,300 | 2,791,581 | 1,275,311 | Mar 19 04:29 PM | | Dobkin Arkadiy | CEO, President, Chairman | Mar 14 '24 | Option Exercise | 32.08 | 61,000 | 1,956,880 | 1,284,611 | Mar 14 04:22 PM | | Yezhkov Sergey | SVP/Co-Head of Global Business | Mar 14 '24 | Option Exercise | 32.08 | 8,000 | 256,640 | 20,770 | Mar 14 04:45 PM | | Dobkin Arkadiy | CEO, President, Chairman | Mar 14 '24 | Sale | 301.79 | 18,865 | 5,693,268 | 1,223,611 | Mar 14 04:22 PM |
|
|
|
 |
| Market Cap | 367.17M | EPS (ttm) | -0.60 |
| P/E | - | EPS this Y | 17.59% |
| Forward P/E | - | EPS next Y | 42.70% |
| PEG | - | EPS past 5Y | - |
| P/S | 4.40 | EPS next 5Y | - |
| P/B | 2.59 | EPS Q/Q | 61.05% |
| Dividend | - | Sales Q/Q | 16.61% |
| Insider Own | 26.04% | Inst Own | 40.21% |
| Insider Trans | -1.63% | Inst Trans | 2.19% |
| Short Float | 8.20% | Earnings | May 09/a |
| Analyst Recom | 1.80 | Target Price | 5.30 |
| Avg Volume | 1.67M | 52W Range | 3.28 - 8.30 |
|
|
| May-10-24 | Downgrade |
Lake Street |
Buy → Hold |
$6 → $3.50 |
|
|
May-10-24 03:07PM
|
Evolv Technologies Reports Mixed Q1 Results: Revenue Up but Misses Estimates, Losses Narrow
(GuruFocus.com) -38.54% |
|
May-09-24 05:35PM
|
Evolv Technologies Holdings, Inc. (EVLV) Reports Q1 Loss, Misses Revenue Estimates
(Zacks) |
|
04:05PM
|
Evolv Technology Reports First Quarter Financial Results
(Business Wire) |
|
May-08-24 08:00AM
|
Evolv Technology Teams Up With Pittsburgh Pirates to Support Community Groups Providing Education and Mentoring Experiences for Local Youth
(Business Wire) |
|
May-03-24 09:59AM
|
Investors in Evolv Technologies Holdings, Inc. Should Contact Levi & Korsinsky Before May 24, 2024 to Discuss Your Rights EVLV
(GlobeNewswire) |
|
08:00AM
|
Cape Fear Community College Enhances Safety at Wilson Center With Evolv Technology
(Business Wire) |
|
May-02-24 02:30PM
|
Belmont Becomes First Tennessee University To Partner With Evolv Technology
(Business Wire) |
|
Apr-22-24 06:05AM
|
Investors in Evolv Technologies Holdings, Inc. Should Contact Levi & Korsinsky Before May 24, 2024 to Discuss Your Rights - EVLV
(PR Newswire) |
|
Apr-21-24 04:05PM
|
EVLV INVESTOR NOTICE: Robbins Geller Rudman & Dowd LLP Announces that Evolv Technologies Holdings, Inc. f/k/a NewHold Investment Corp. Investors with Substantial Losses Have Opportunity to Lead Case
(GlobeNewswire) |
|
Apr-15-24 05:45AM
|
Investors in Evolv Technologies Holdings, Inc. Should Contact Levi & Korsinsky Before May 24, 2024 to Discuss Your Rights - EVLV
(PR Newswire) |
|
Evolv Technologies Holdings, Inc. engages in the manufacture and development of security screening products. It also provides artificial intelligence-based security screening solutions for industries including casinos, industrial workplaces, schools, and ticketed venues. The company was founded by Anil R. Chitkara and Michael Philip Ellenbogen in July 2013 and is headquartered in Waltham, MA. |
| Insider Trading |
Relationship |
Date |
Transaction |
Cost |
#Shares |
Value ($) |
#Shares Total |
SEC Form 4 |
| Chitkara Anil | Founder & Chief Growth Officer | Apr 01 '24 | Option Exercise | 0.24 | 50,000 | 12,000 | 1,250,157 | Apr 02 04:31 PM | | Chitkara Anil | Founder & Chief Growth Officer | Apr 01 '24 | Sale | 5.00 | 50,000 | 250,000 | 1,200,157 | Apr 02 04:31 PM | | Gonzales David Mounts | Director | Mar 06 '24 | Buy | 3.86 | 50,000 | 193,000 | 50,000 | Mar 07 05:32 PM | | George Peter Gustav | President & CEO | Mar 04 '24 | Sale | 3.63 | 132,173 | 479,788 | 947,587 | Mar 05 05:21 PM | | Donohue Mark | Chief Financial Officer | Mar 04 '24 | Sale | 3.63 | 39,323 | 142,742 | 287,374 | Mar 05 05:19 PM |
|
|
| |
 |
| Market Cap | 1.57B | EPS (ttm) | -0.43 |
| P/E | - | EPS this Y | 31.88% |
| Forward P/E | - | EPS next Y | 22.34% |
| PEG | - | EPS past 5Y | - |
| P/S | 7.51 | EPS next 5Y | 19.50% |
| P/B | 1.47 | EPS Q/Q | 22.83% |
| Dividend | - | Sales Q/Q | -52.98% |
| Insider Own | 32.59% | Inst Own | 56.74% |
| Insider Trans | -0.45% | Inst Trans | 4.60% |
| Short Float | 20.87% | Earnings | May 09/a |
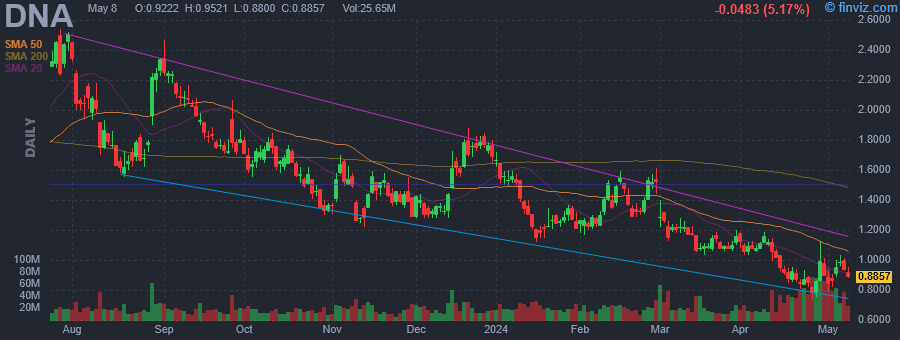
| Analyst Recom | 3.43 | Target Price | 1.82 |
| Avg Volume | 32.13M | 52W Range | 0.74 - 2.55 |
|
|
| May-10-24 | Downgrade |
William Blair |
Mkt Perform → Underperform |
|
|
|
|
Ginkgo Bioworks Holdings, Inc. is a biotech company. Its platform is market agnostic and enables biotechnology applications across diverse markets, from food and agriculture to industrial chemicals to pharmaceuticals. It operates through the Cell Programming/Foundry, and Biosecurity segments. The company was founded by Jason Kelly, Reshma Shetty, Bartholomew Canton, Austin Che, and Thomas F. Knight, Jr. in 2008 and is headquartered in Boston, MA. |
| Insider Trading |
Relationship |
Date |
Transaction |
Cost |
#Shares |
Value ($) |
#Shares Total |
SEC Form 4 |
| Coen Steven P. | See remarks | May 02 '24 | Sale | 0.84 | 131,928 | 111,479 | 162,527 | May 06 04:53 PM | | Dmytruk Mark E. | See remarks | May 02 '24 | Sale | 0.84 | 47,806 | 40,396 | 925,400 | May 06 04:55 PM | | Dmytruk Mark E. | See remarks | Apr 02 '24 | Sale | 1.05 | 51,169 | 53,727 | 865,079 | Apr 04 04:40 PM | | Dmytruk Mark E. | See remarks | Mar 04 '24 | Sale | 1.26 | 38,826 | 48,765 | 808,125 | Mar 06 05:08 PM | | Dmytruk Mark E. | See remarks | Feb 02 '24 | Sale | 1.21 | 39,569 | 47,799 | 761,737 | Feb 06 05:06 PM |
|
|
|
 |
| Market Cap | 7.49B | EPS (ttm) | 3.64 |
| P/E | 47.59 | EPS this Y | 14.12% |
| Forward P/E | 22.12 | EPS next Y | 19.52% |
| PEG | - | EPS past 5Y | 21.45% |
| P/S | 3.57 | EPS next 5Y | - |
| P/B | 4.31 | EPS Q/Q | 5.34% |
| Dividend | - | Sales Q/Q | 18.34% |
| Insider Own | 2.23% | Inst Own | 93.27% |
| Insider Trans | 0.00% | Inst Trans | 5.06% |
| Short Float | 2.44% | Earnings | May 16/a |
| Analyst Recom | 1.62 | Target Price | 248.83 |
| Avg Volume | 477.53K | 52W Range | 135.40 - 251.50 |
|
|
| May-10-24 | Downgrade |
Scotiabank |
Sector Outperform → Sector Perform |
$200 |
|
|
|
Globant SA engages in the provision of information technology services. It includes application development, testing, infrastructure management, and application maintenance. The company was founded by Martin Migoya, Martin Gonzalo Umaran, Guibert Andres Englebienne, and Nestor Augusto Nocetti in 2003 and is headquartered in Luxembourg. |
|
| |
 |
| Market Cap | 8.24B | EPS (ttm) | 2.42 |
| P/E | 37.73 | EPS this Y | 127.06% |
| Forward P/E | 17.13 | EPS next Y | 34.37% |
| PEG | 53.15 | EPS past 5Y | - |
| P/S | 2.76 | EPS next 5Y | 0.71% |
| P/B | 9.86 | EPS Q/Q | 276.71% |
| Dividend | - | Sales Q/Q | 12.84% |
| Insider Own | 1.02% | Inst Own | 81.02% |
| Insider Trans | -1.83% | Inst Trans | 2.71% |
| Short Float | 5.65% | Earnings | May 08/a |
| Analyst Recom | 1.83 | Target Price | 110.69 |
| Avg Volume | 628.95K | 52W Range | 56.01 - 108.90 |
|
|
| May-10-24 | Downgrade |
Susquehanna |
Positive → Neutral |
$111 → $95 |
|
|
|
Light & Wonder, Inc. is a cross-platform global games company, which engages in the development of content and digital markets. It operates through the following segments: Gaming, SciPlay, and iGaming. The Gaming segment includes the design, manufacture, marketing, and distribution of portfolio of gaming products and services. The SciPlay segment involves the development and publishing of digital games on mobile and web platforms. The iGaming segment focuses on the provision of digital gaming content, distribution platforms, player account management systems, and services. The company was founded on July 2, 1984 and is headquartered in Las Vegas, NV. |
| Insider Trading |
Relationship |
Date |
Transaction |
Cost |
#Shares |
Value ($) |
#Shares Total |
SEC Form 4 |
| Sottile James | Exec VP, CLO & Corp Sec | Mar 20 '24 | Option Exercise | 0.00 | 31,555 | 0 | 80,088 | Mar 22 08:46 PM | | Lane Siobhan | SVP & CEO - Gaming | Mar 20 '24 | Option Exercise | 0.00 | 4,371 | 0 | 20,046 | Mar 22 08:49 PM | | Wilson Matthew R. | President & CEO | Mar 20 '24 | Option Exercise | 0.00 | 41,628 | 0 | 156,643 | Mar 22 09:04 PM | | Wilson Matthew R. | President & CEO | Mar 07 '24 | Sale | 101.21 | 9,044 | 915,343 | 125,940 | Mar 07 09:01 PM | | Lane Siobhan | SVP & CEO - Gaming | Mar 07 '24 | Sale | 100.73 | 3,566 | 359,203 | 11,302 | Mar 07 09:08 PM |
|
|
|
 |
| Market Cap | 207.07M | EPS (ttm) | -0.38 |
| P/E | - | EPS this Y | -1832.24% |
| Forward P/E | - | EPS next Y | 40.46% |
| PEG | - | EPS past 5Y | 48.88% |
| P/S | 4.78 | EPS next 5Y | - |
| P/B | 1.95 | EPS Q/Q | -36.25% |
| Dividend | - | Sales Q/Q | -62.83% |
| Insider Own | 6.45% | Inst Own | 93.14% |
| Insider Trans | -6.78% | Inst Trans | -8.39% |
| Short Float | 17.03% | Earnings | May 09/a |
| Analyst Recom | 1.75 | Target Price | 15.10 |
| Avg Volume | 1.48M | 52W Range | 4.29 - 21.88 |
|
|
| May-10-24 | Downgrade |
TD Cowen |
Buy → Hold |
|
| May-10-24 | Downgrade |
Stifel |
Buy → Hold |
$29 → $7 |
| May-10-24 | Downgrade |
BMO Capital Markets |
Outperform → Market Perform |
$24 → $8 |
|
|
|
MacroGenics, Inc. is a biopharmaceutical company, which engages in the development and commercialization of antibody-based therapeutics for the treatment of cancer. Its product pipeline includes Margetuximab, Flotetuzumab, Retifanlimab, Enoblituzumab, Tebotelimab, MGC018, MGD019, IMGC936, and MGD014 for infectious diseases. The company was founded by Scott E. Koenig, Jeffrey V. Ravetch, LeRoy E. Hood, Ruedi Aebersold, and Alan Aderem on August 14, 2000 and is headquartered in Rockville, MD. |
| Insider Trading |
Relationship |
Date |
Transaction |
Cost |
#Shares |
Value ($) |
#Shares Total |
SEC Form 4 |
| Peters Jeffrey Stuart | Senior VP and General Counsel | Apr 04 '24 | Option Exercise | 4.82 | 42,500 | 204,850 | 51,395 | Apr 08 06:07 PM | | Peters Jeffrey Stuart | Senior VP and General Counsel | Apr 04 '24 | Sale | 15.55 | 51,395 | 799,148 | 0 | Apr 08 06:07 PM | | Peters Jeffrey Stuart | Senior VP and General Counsel | Mar 06 '24 | Option Exercise | 10.90 | 19,625 | 213,875 | 28,520 | Mar 08 04:14 PM | | Peters Jeffrey Stuart | Senior VP and General Counsel | Mar 06 '24 | Sale | 21.50 | 19,625 | 421,938 | 8,895 | Mar 08 04:14 PM | | Risser Eric Blasius | Chief Operating Officer | Mar 04 '24 | Option Exercise | 10.15 | 15,000 | 152,250 | 80,059 | Mar 06 04:20 PM |
|
|
|
 |
| Market Cap | 474.83M | EPS (ttm) | 0.74 |
| P/E | 9.84 | EPS this Y | -5.00% |
| Forward P/E | 7.91 | EPS next Y | -3.20% |
| PEG | 0.29 | EPS past 5Y | 9.00% |
| P/S | 3.17 | EPS next 5Y | 34.00% |
| P/B | 0.95 | EPS Q/Q | - |
| Dividend | 12.36% | Sales Q/Q | 14.60% |
| Insider Own | 3.36% | Inst Own | 29.39% |
| Insider Trans | 1.30% | Inst Trans | - |
| Short Float | 1.31% | Earnings | May 08/a |
| Analyst Recom | 2.60 | Target Price | 7.14 |
| Avg Volume | 423.28K | 52W Range | 4.90 - 7.41 |
|
|
| May-10-24 | Downgrade |
Raymond James |
Outperform → Mkt Perform |
|
|
|
|
PennantPark Investment Corporation, a business development company is a private equity fund specializes in direct and mezzanine investments in middle market companies. It invests in the form of mezzanine debt, senior secured loans, and equity investments. The fund typically invests in buildings and real estate, hotels, gaming and leisure, technology, telecommunications, transportation, information technology services, electronics, healthcare & pharmaceuticals, education and childcare, financial services, printing and publishing, consumer products, business services, energy & Related Services and utilities, distribution, oil and gas, media, environmental services, aerospace and defense, building materials, capital equipment, chemicals, plastics, & rubber, food & beverage, wholesale, manufacturing and basic industries and retail. It invests in equity securities and debt transactions through preferred stock, common stock, warrants, options, senior secured debt, subordinated debt, subordinated loans, first lien debt, mezzanine loans, and distressed debt securities and private equity co-investments. It seeks to invest in companies based in the United States. The fund seeks to invest between $10 million and $100 million cross the capital structure (senior secured loans, subordinated debt, and other investments) in its portfolio companies with EBITDA between $10 to $50 million. Its mezzanine loans, senior secured loans, and other investments in its portfolio companies are between $15 million and $50 million. The fund may also make non-control equity and debt investments. |
| Insider Trading |
Relationship |
Date |
Transaction |
Cost |
#Shares |
Value ($) |
#Shares Total |
SEC Form 4 |
| Allorto Richard T JR | CFO and Treasurer | Mar 12 '24 | Buy | 6.80 | 5,000 | 33,978 | 15,000 | Mar 14 04:05 PM | | Briones Jose A | Director | Feb 26 '24 | Buy | 6.86 | 6,122 | 41,970 | 261,657 | Feb 29 06:54 AM | | Briones Jose A | Director | Feb 26 '24 | Buy | 6.86 | 1,166 | 7,996 | 10,333 | Feb 29 06:54 AM | | Briones Jose A | Director | Feb 13 '24 | Buy | 6.67 | 3,800 | 25,345 | 255,535 | Feb 14 07:35 AM | | Briones Jose A | Director | Feb 09 '24 | Buy | 6.70 | 7,450 | 49,911 | 251,735 | Feb 14 07:35 AM |
|
|
|
