 |
| Market Cap | 54.74B | EPS (ttm) | -12.72 |
| P/E | - | EPS this Y | -2.67% |
| Forward P/E | 12.37 | EPS next Y | 6.34% |
| PEG | - | EPS past 5Y | - |
| P/S | 1.68 | EPS next 5Y | -5.25% |
| P/B | 11.25 | EPS Q/Q | -5.38% |
| Dividend | 3.20% | Sales Q/Q | -0.35% |
| Insider Own | 6.29% | Inst Own | 64.68% |
| Insider Trans | -0.00% | Inst Trans | -1.00% |
| Short Float | 1.75% | Earnings | Apr 30/b |
| Analyst Recom | 2.89 | Target Price | 101.22 |
| Avg Volume | 5.99M | 52W Range | 71.35 - 99.70 |
|
|
| May-10-24 | Upgrade |
HSBC Securities |
Hold → Buy |
$115 |
|
|
|
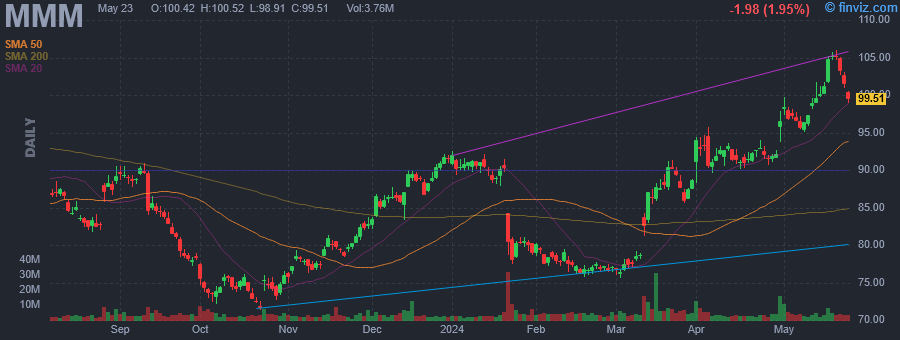
3M Co. is a technology company, which manufactures industrial, safety, and consumer products. It operates through the following segments: Safety and Industrial, Transportation and Electronics, Health Care, Consumer, and Corporate and Unallocated. The Safety and Industrial segment consists of personal safety, industrial adhesives and tapes, abrasives, closure and masking systems, electrical markets, automotive aftermarket, and roofing granules. The Transportation and Electronics segment includes electronics, automotive and aerospace, commercial solutions, advanced materials, and transportation safety. The Health Care segment offers medical and surgical supplies, skin health and infection prevention products, oral care solutions, separation and purification sciences, health information systems, inhalation and transdermal drug delivery systems, and food safety products. The Consumer segment covers consumer healthcare, home care, home improvement, and stationery and office products, such as consumer bandages, braces, supports, respirators, cleaning products, retail abrasives, picture hanging, and consumer air quality solutions. The Corporate and Unallocated segment refers to special items and other corporate expense-net. The company was founded by Henry S. Bryan, Hermon W. Cable, John Dwan, William A. McGonagle, and J. Danley Budd in 1902 and is headquartered in St. Paul, MN. |
| Insider Trading |
Relationship |
Date |
Transaction |
Cost |
#Shares |
Value ($) |
#Shares Total |
SEC Form 4 |
| Dickson Zoe L | EVP & Chief HR Officer | May 01 '24 | Option Exercise | 98.44 | 983 | 96,767 | 4,504 | May 03 12:10 PM | | Chavez Rodriguez Beatriz Karin | Group President | Feb 14 '24 | Sale | 92.32 | 426 | 39,330 | 3,966 | Feb 15 02:44 PM | | Patolawala Monish D | EVP, CFO & Transformation Off | Feb 02 '24 | Option Exercise | 94.87 | 6,128 | 581,363 | 22,935 | Feb 05 01:11 PM | | Rhodes Kevin H | EVP & Chief Legal Officer | Feb 02 '24 | Option Exercise | 94.87 | 414 | 39,276 | 3,760 | Feb 05 01:15 PM | | Chavez Rodriguez Beatriz Karin | Group President | Feb 02 '24 | Option Exercise | 94.87 | 286 | 27,133 | 4,164 | Feb 05 01:26 PM |
|
|
 |
 |
| Market Cap | 1.94B | EPS (ttm) | 0.37 |
| P/E | 34.21 | EPS this Y | -3.21% |
| Forward P/E | 9.35 | EPS next Y | 24.78% |
| PEG | 2.31 | EPS past 5Y | - |
| P/S | 1.43 | EPS next 5Y | 14.80% |
| P/B | 8.37 | EPS Q/Q | -183.31% |
| Dividend | - | Sales Q/Q | -59.29% |
| Insider Own | 1.71% | Inst Own | 114.55% |
| Insider Trans | -0.31% | Inst Trans | 0.55% |
| Short Float | 17.51% | Earnings | May 09/a |
| Analyst Recom | 1.82 | Target Price | 19.91 |
| Avg Volume | 5.83M | 52W Range | 10.82 - 26.64 |
|
|
| May-10-24 | Upgrade |
Oppenheimer |
Perform → Outperform |
$20 |
|
|
|
Array Technologies, Inc. manufactures ground-mounting systems used in solar energy projects. The company sells its products to engineering, procurement and construction firms that build solar energy projects and to large solar developers, independent power producers and utilities, master supply agreements or multi-year procurement contracts. It has offices in Europe, Central America, and Australia. The company's products include DuraTrack and SmarTrack. Array Technologies was founded by Ronald P. Corio in 1989 and is headquartered in Albuquerque, NM. |
| Insider Trading |
Relationship |
Date |
Transaction |
Cost |
#Shares |
Value ($) |
#Shares Total |
SEC Form 4 |
| Hostetler Kevin G. | Chief Executive Officer | Mar 20 '24 | Sale | 12.30 | 8,176 | 100,565 | 217,352 | Mar 22 08:25 PM | | Hottinger Tyson | Chief Legal Officer | Sep 01 '23 | Sale | 25.04 | 7,500 | 187,825 | 69,618 | Sep 05 05:46 PM | | Patel Nipul M. | Chief Financial Officer | Aug 14 '23 | Sale | 23.12 | 54,593 | 1,262,190 | 82,827 | Aug 15 07:16 PM | | Hottinger Tyson | Chief Legal Officer | Aug 11 '23 | Sale | 23.32 | 8,500 | 198,220 | 77,118 | Aug 15 07:15 PM |
|
|
|
 |
| Market Cap | 4.50B | EPS (ttm) | -1.64 |
| P/E | - | EPS this Y | 79.72% |
| Forward P/E | 49.04 | EPS next Y | 223.24% |
| PEG | - | EPS past 5Y | -46.30% |
| P/S | 1.42 | EPS next 5Y | - |
| P/B | 2.28 | EPS Q/Q | 18.77% |
| Dividend | - | Sales Q/Q | 1.76% |
| Insider Own | 0.00% | Inst Own | 18.02% |
| Insider Trans | - | Inst Trans | -10.76% |
| Short Float | 7.03% | Earnings | May 23/b |
| Analyst Recom | 1.88 | Target Price | 14.93 |
| Avg Volume | 7.44M | 52W Range | 8.80 - 19.74 |
|
|
| May-10-24 | Upgrade |
CLSA |
Outperform → Buy |
|
|
|
|
Bilibili, Inc. is a holding company, which engages in the provision of online entertainment content. The firm enables broad video-based content consumption scenarios centered around professional user generated videos supplemented with live broadcasting, occupationally generated videos, or occupationally generated videos. The company was founded by Xu Yi in June 2009 and is headquartered Shanghai, China. |
|
| |
 |
| Market Cap | 1.92B | EPS (ttm) | 2.18 |
| P/E | 17.28 | EPS this Y | 17.08% |
| Forward P/E | 10.71 | EPS next Y | 11.58% |
| PEG | 0.92 | EPS past 5Y | -0.73% |
| P/S | 0.55 | EPS next 5Y | 18.80% |
| P/B | 5.77 | EPS Q/Q | 21.05% |
| Dividend | 2.86% | Sales Q/Q | 2.90% |
| Insider Own | 7.51% | Inst Own | 86.82% |
| Insider Trans | 0.00% | Inst Trans | 3.13% |
| Short Float | 14.51% | Earnings | May 08/a |
| Analyst Recom | 2.67 | Target Price | 38.19 |
| Avg Volume | 894.03K | 52W Range | 28.58 - 38.19 |
|
|
| May-10-24 | Upgrade |
Citigroup |
Neutral → Buy |
$38 → $47 |
|
|
|
Cheesecake Factory, Inc. engages in the operation of restaurant chains. It operates through The Cheesecake Factory, North Italia, Other FRC and Other segments. The Cheesecake Factory segment offers appetizers, pizza, seafood, steaks, chicken, burgers, small plates, pastas, salads, sandwiches and omelettes, and a selection of gluten-free items. The North Italia segment specializes in Italian cuisine. The Other FRC segment includes brands acquired from Fox Restaurant Concepts. The Other segment consists of the Flower Child brand, along with other businesses. The company was founded by David M. Overton, Oscar Overton and Evelyn Overton in 1972 and is headquartered in Calabasas Hills, CA. |
|
|
 |
| Market Cap | 44.48B | EPS (ttm) | 1.90 |
| P/E | 27.94 | EPS this Y | 40.65% |
| Forward P/E | 15.72 | EPS next Y | 20.61% |
| PEG | 1.43 | EPS past 5Y | -9.37% |
| P/S | 3.09 | EPS next 5Y | 19.50% |
| P/B | 1.73 | EPS Q/Q | -33.23% |
| Dividend | 5.03% | Sales Q/Q | -32.29% |
| Insider Own | 0.13% | Inst Own | 76.50% |
| Insider Trans | 1.64% | Inst Trans | 1.48% |
| Short Float | 1.57% | Earnings | May 02/b |
| Analyst Recom | 2.67 | Target Price | 52.05 |
| Avg Volume | 5.52M | 52W Range | 39.18 - 57.02 |
|
|
| May-10-24 | Upgrade |
BofA Securities |
Underperform → Neutral |
$43 → $54 |
|
|
|
Dominion Energy, Inc. engages in the production and distribution of energy. It operates through following business segments: Dominion Energy Virginia, Dominion Energy South Carolina, Contracted Energy, and Corporate and Other. The Corporate and Other segment focuses on corporate, service company, non-controlling interest in Dominion privatization, and non-regulated retail energy marketing operations. The company was founded by William W. Berry in 1983 and is headquartered in Richmond, VA. |
| Insider Trading |
Relationship |
Date |
Transaction |
Cost |
#Shares |
Value ($) |
#Shares Total |
SEC Form 4 |
| RIGBY JOSEPH M | Director | Mar 06 '24 | Buy | 46.94 | 2,130 | 99,998 | 8,417 | Mar 07 12:10 PM | | BLUE ROBERT M | Chair, President and CEO | Mar 04 '24 | Buy | 45.91 | 21,735 | 997,891 | 176,240 | Mar 04 12:25 PM | | Leopold Diane | Exec. Vice President and COO | Dec 01 '23 | Sale | 45.51 | 6,250 | 284,453 | 88,126 | Dec 01 04:43 PM | | STORY SUSAN N | Director | Jun 20 '23 | Buy | 53.70 | 54 | 2,900 | 22,162 | Sep 25 06:36 PM | | Leopold Diane | Exec. Vice President and COO | Jun 01 '23 | Sale | 49.16 | 6,250 | 307,251 | 100,115 | Jun 01 06:24 PM |
|
|
| |
 |
| Market Cap | 3.07B | EPS (ttm) | 0.18 |
| P/E | 195.92 | EPS this Y | 19.03% |
| Forward P/E | 80.06 | EPS next Y | 26.02% |
| PEG | 7.70 | EPS past 5Y | -53.03% |
| P/S | 2.94 | EPS next 5Y | 25.45% |
| P/B | 8.05 | EPS Q/Q | 224.93% |
| Dividend | - | Sales Q/Q | 39.46% |
| Insider Own | 15.93% | Inst Own | 57.16% |
| Insider Trans | -68.15% | Inst Trans | 10.88% |
| Short Float | 11.51% | Earnings | May 07/a |
| Analyst Recom | 1.71 | Target Price | 38.01 |
| Avg Volume | 2.40M | 52W Range | 22.67 - 36.17 |
|
|
| May-10-24 | Upgrade |
TD Cowen |
Hold → Buy |
$33 → $46 |
|
|
|
Dutch Bros, Inc. engages in operating and franchising drive-thru shops that focus on handcrafted beverages. It operates through the Company-Operated Shops, and Franchising and Other segments. The Company-Operated Shops segment consists of coffee shop sales to customers. The Franchising and Other segment is involved in bean and product sales to franchisees and includes the initial franchise fees, royalties, and marketing fees. The company was founded by Travis Boersma and Dane Boersma in 1992 and is headquartered in Grants Pass, OR. |
| Insider Trading |
Relationship |
Date |
Transaction |
Cost |
#Shares |
Value ($) |
#Shares Total |
SEC Form 4 |
| Miller Ann M | Director | Mar 31 '24 | Option Exercise | 0.00 | 938 | 0 | 5,558 | Apr 02 09:30 AM | | Gillett Stephen | Director | Mar 31 '24 | Option Exercise | 0.00 | 938 | 0 | 12,741 | Apr 02 09:32 AM | | George Kathryn | Director | Mar 31 '24 | Option Exercise | 0.00 | 938 | 0 | 8,355 | Apr 02 09:33 AM | | Davis Thomas James | Director | Mar 31 '24 | Option Exercise | 0.00 | 938 | 0 | 8,355 | Apr 02 09:35 AM | | TSG7 A Management LLC | 10% Owner | Mar 26 '24 | Sale | 33.88 | 8,000,000 | 271,000,000 | 0 | Mar 28 07:02 PM |
|
|
|
 |
| Market Cap | 618.22M | EPS (ttm) | 2.25 |
| P/E | 8.70 | EPS this Y | -8.51% |
| Forward P/E | 9.05 | EPS next Y | -3.95% |
| PEG | - | EPS past 5Y | -2.17% |
| P/S | 2.26 | EPS next 5Y | - |
| P/B | 1.25 | EPS Q/Q | 61.88% |
| Dividend | 3.80% | Sales Q/Q | 14.20% |
| Insider Own | 60.55% | Inst Own | 23.98% |
| Insider Trans | 0.06% | Inst Trans | -2.60% |
| Short Float | 0.68% | Earnings | Apr 22/b |
| Analyst Recom | 2.40 | Target Price | 22.70 |
| Avg Volume | 27.53K | 52W Range | 16.33 - 21.87 |
|
|
| May-10-24 | Upgrade |
Raymond James |
Mkt Perform → Outperform |
$23 |
|
|
|
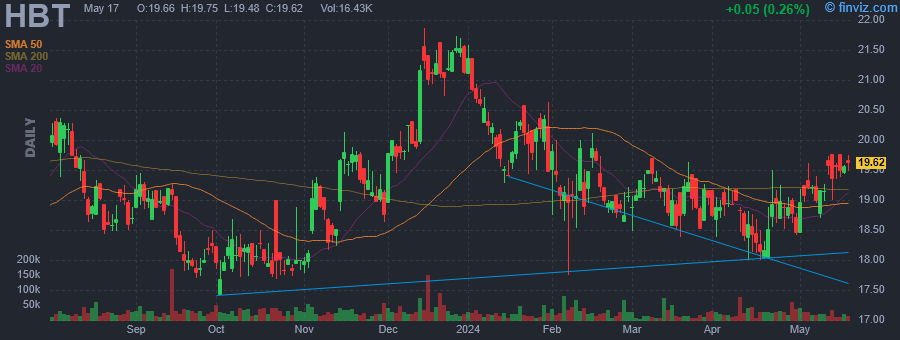
HBT Financial, Inc. is a bank holding company, which provides business, commercial and retail banking products and services to consumers, businesses, and municipal entities. The company was founded in 1920 and is headquartered in Bloomington, IL. |
| Insider Trading |
Relationship |
Date |
Transaction |
Cost |
#Shares |
Value ($) |
#Shares Total |
SEC Form 4 |
| Chapman Peter Robert | EVP & CFO | May 01 '24 | Buy | 18.93 | 1,100 | 20,823 | 25,141 | May 01 04:47 PM | | PFEIFFER GERALD E | Director | Mar 01 '24 | Buy | 18.85 | 1,385 | 26,107 | 58,585 | Mar 04 04:21 PM | | PFEIFFER GERALD E | Director | Mar 01 '24 | Buy | 18.85 | 162 | 3,054 | 5,162 | Mar 04 04:21 PM | | Baker Roger A | Director | Feb 26 '24 | Buy | 18.80 | 200 | 3,760 | 560,004 | Feb 27 04:44 PM | | Baker Roger A | Director | Feb 22 '24 | Buy | 18.86 | 3,632 | 68,500 | 559,804 | Feb 23 05:23 PM |
|
|
| |
 |
| Market Cap | 7.44B | EPS (ttm) | 9.17 |
| P/E | 14.29 | EPS this Y | 18.57% |
| Forward P/E | 7.41 | EPS next Y | 24.12% |
| PEG | 0.53 | EPS past 5Y | -10.87% |
| P/S | 0.32 | EPS next 5Y | 27.03% |
| P/B | 1.52 | EPS Q/Q | -21.04% |
| Dividend | 2.36% | Sales Q/Q | 2.51% |
| Insider Own | 0.24% | Inst Own | 105.69% |
| Insider Trans | -10.63% | Inst Trans | -0.52% |
| Short Float | 5.06% | Earnings | Apr 30/b |
| Analyst Recom | 2.00 | Target Price | 162.60 |
| Avg Volume | 573.78K | 52W Range | 120.48 - 157.90 |
|
|
| May-10-24 | Upgrade |
Morgan Stanley |
Equal-Weight → Overweight |
$150 → $160 |
|
|
|
Lear Corp. engages in the design, manufacture and supply of automotive seats, electrical distribution systems and electronic modules, as well as related sub-systems, components, and software. It operates through the following segments: Seating and E-Systems. The Seating segment consists of the design, engineering, just-in-time assembly and delivery of complete seat systems, as well as the manufacture of all major seat components, including seat covers and surface materials such as leather and fabric, seat structures and mechanisms, seat foam and headrests. The E-System segment engages in the design, development, engineering and manufacture of electrical distribution systems, as well as electronic control modules, electrification products, connectivity products and software solutions for the cloud, vehicles and mobile devices. The company was founded in 1917 and is headquartered in Southfield, MI. |
| Insider Trading |
Relationship |
Date |
Transaction |
Cost |
#Shares |
Value ($) |
#Shares Total |
SEC Form 4 |
| LIGOCKI KATHLEEN | Director | Apr 01 '24 | Option Exercise | 0.00 | 53 | 0 | 3,466 | Apr 02 03:56 PM | | Cardew Jason M | Sr. VP & CFO | Mar 05 '24 | Sale | 140.81 | 2,750 | 387,228 | 17,506 | Mar 06 10:06 AM | | CHENG MEI WEI | Director | Feb 20 '24 | Option Exercise | 0.00 | 411 | 0 | 1,423 | Feb 22 09:52 AM | | SCOTT RAYMOND E | President and CEO | Feb 09 '24 | Sale | 132.86 | 10,652 | 1,415,225 | 13,627 | Feb 09 05:00 PM | | SCOTT RAYMOND E | President and CEO | Jan 08 '24 | Sale | 135.26 | 2,977 | 402,669 | 2,976 | Jan 10 04:09 PM |
|
|
|
 |
| Market Cap | 1.25B | EPS (ttm) | -3.18 |
| P/E | - | EPS this Y | 95.04% |
| Forward P/E | - | EPS next Y | 4.97% |
| PEG | - | EPS past 5Y | 11.55% |
| P/S | 1.25 | EPS next 5Y | - |
| P/B | - | EPS Q/Q | 69.08% |
| Dividend | - | Sales Q/Q | 15.94% |
| Insider Own | 4.98% | Inst Own | 58.71% |
| Insider Trans | 0.00% | Inst Trans | 3.21% |
| Short Float | 33.68% | Earnings | May 10/b |
| Analyst Recom | 2.00 | Target Price | 18.00 |
| Avg Volume | 6.83M | 52W Range | 3.53 - 10.30 |
|
|
| May-10-24 | Upgrade |
JP Morgan |
Underweight → Neutral |
|
| May-10-24 | Upgrade |
BofA Securities |
Underperform → Neutral |
$4 → $12 |
|
|
May-10-24 06:56PM
|
Alight, Novavax, and More Stocks See Action From Activist Investors
(Barrons.com) +98.66% |
|
05:56PM
|
Fed rates, Tesla Supercharger backpedal, Novavax's 'new chapter': Market Domination
(Yahoo Finance Video) |
|
04:26PM
|
Sanofi vaccine deal kicks off Novavax's 'new chapter': Analyst
(Yahoo Finance Video) |
|
04:16PM
|
Novavaxs 99% Surge Gives Rib-Crunching Squeeze to Shorts
(Bloomberg) |
|
04:11PM
|
These Stocks Moved the Most Today: Novavax, Akamai, Sweetgreen, Taiwan Semi, Moderna, Gen Digital, JFrog, SoundHound, and More
(Barrons.com) |
|
04:08PM
|
Novavax stock doubles after Sanofi deal marks 'new chapter' for company
(Yahoo Finance) |
|
02:54PM
|
These Stocks Are Moving the Most Today: Novavax, Akamai, Sweetgreen, Taiwan Semi, Moderna, Gen Digital, JFrog, SoundHound, and More
(Barrons.com) |
|
01:58PM
|
Stocks to Watch Friday: TSMC, Novavax, Nvidia, Goldman Sachs
(The Wall Street Journal) |
|
01:46PM
|
Novavax Inc (NVAX) Q1 2024 Earnings: Navigating Challenges with Strategic Partnerships and Cost ...
(GuruFocus.com) |
|
01:44PM
|
Top MIdday Gainers
(MT Newswires) |
|
Novavax, Inc. Is a biotechnology company, which engages in the discovery, development, and commercialization of recombinant vaccines. The company was founded in 1987 and is headquartered in Gaithersburg, MD. |
| Insider Trading |
Relationship |
Date |
Transaction |
Cost |
#Shares |
Value ($) |
#Shares Total |
SEC Form 4 |
| O'Hara Elaine | EVP, Chief Strategy Officer | Mar 01 '24 | Option Exercise | 5.39 | 19,600 | 105,644 | 19,600 | Mar 05 07:30 PM | | Dubovsky Filip | President, R&D | Dec 14 '23 | Option Exercise | 5.69 | 2,833 | 16,120 | 55,150 | Dec 18 05:00 PM | | Dubovsky Filip | President, R&D | Nov 05 '23 | Option Exercise | 7.06 | 1,400 | 9,884 | 52,994 | Nov 07 05:30 PM | | Dubovsky Filip | President, R&D | Sep 16 '23 | Option Exercise | 7.71 | 12,644 | 97,485 | 57,702 | Sep 19 05:16 PM | | Dubovsky Filip | President, R&D | Jun 16 '23 | Option Exercise | 8.04 | 4,155 | 33,406 | 47,065 | Jun 21 04:40 PM |
|
|
|
 |
| Market Cap | 852.19M | EPS (ttm) | -2.64 |
| P/E | - | EPS this Y | -1.73% |
| Forward P/E | - | EPS next Y | 0.65% |
| PEG | - | EPS past 5Y | -38.74% |
| P/S | 24.12 | EPS next 5Y | - |
| P/B | 1.14 | EPS Q/Q | 19.93% |
| Dividend | - | Sales Q/Q | 4327.88% |
| Insider Own | 29.70% | Inst Own | 70.58% |
| Insider Trans | -0.05% | Inst Trans | 1.50% |
| Short Float | 12.35% | Earnings | May 02/a |
| Analyst Recom | 1.09 | Target Price | 23.10 |
| Avg Volume | 1.24M | 52W Range | 5.70 - 13.32 |
|
|
| May-10-24 | Upgrade |
Barclays |
Equal Weight → Overweight |
$15 |
|
|
|
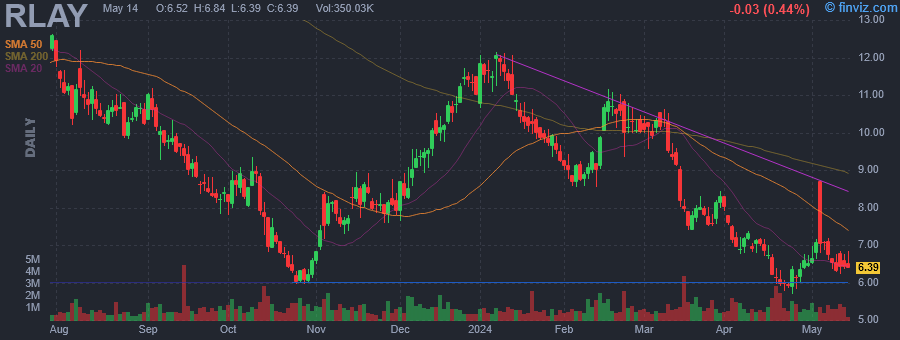
Relay Therapeutics, Inc. engages in transforming the drug discovery process with an initial focus on enhancing small molecule therapeutic discovery in targeted oncology. Its Dynamo platform is use to integrate an array of edge experimental and computational approaches, which allows to apply the understanding of protein structure and motion to drug discovery. The company was founded by David Elliot Shaw, Matthew P. Jacobson, Dorothee Kern, Mark Murcko, Alexis Borisy, and Jakob Loven on May 4, 2015 and is headquartered in Cambridge, MA. |
| Insider Trading |
Relationship |
Date |
Transaction |
Cost |
#Shares |
Value ($) |
#Shares Total |
SEC Form 4 |
| Bergstrom Donald A | President, R&D | Apr 29 '24 | Sale | 6.38 | 2,686 | 17,137 | 527,427 | Apr 29 08:30 PM | | Catinazzo Thomas | Chief Financial Officer | Apr 29 '24 | Sale | 6.38 | 1,695 | 10,814 | 339,803 | Apr 29 08:31 PM | | Adams Brian | Chief Legal Officer | Apr 29 '24 | Sale | 6.38 | 1,623 | 10,355 | 325,767 | Apr 29 08:33 PM | | Rahmer Peter | See remarks | Apr 29 '24 | Sale | 6.38 | 1,345 | 8,581 | 513,334 | Apr 29 08:36 PM | | Bergstrom Donald A | President, R&D | Mar 27 '24 | Sale | 7.70 | 765 | 5,890 | 530,113 | Mar 29 04:15 PM |
|
|
|
