 |
| Market Cap | 764.30M | EPS (ttm) | -1.20 |
| P/E | - | EPS this Y | 40.21% |
| Forward P/E | - | EPS next Y | 18.79% |
| PEG | - | EPS past 5Y | 3.32% |
| P/S | 449.59 | EPS next 5Y | - |
| P/B | 6.86 | EPS Q/Q | -92.78% |
| Dividend | - | Sales Q/Q | -100.00% |
| Insider Own | 9.38% | Inst Own | 92.53% |
| Insider Trans | 0.00% | Inst Trans | -1.84% |
| Short Float | 2.23% | Earnings | May 17/b |
| Analyst Recom | 1.40 | Target Price | 10.54 |
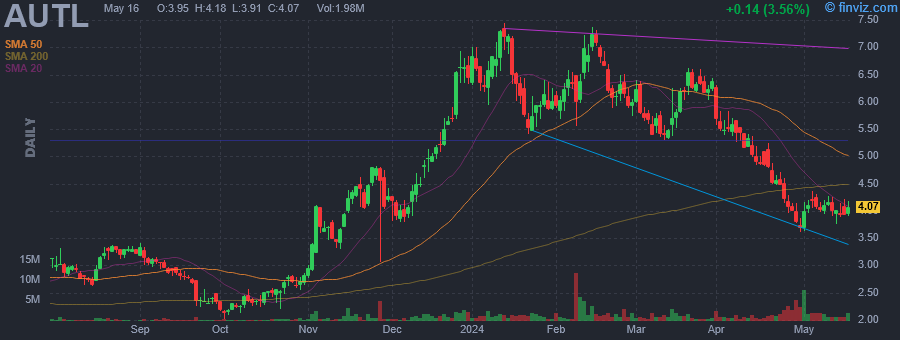
| Avg Volume | 1.57M | 52W Range | 2.01 - 7.45 |
|
|
|
|
Autolus Therapeutics Plc is a biopharmaceutical company, which engages in the development and commercialization of gene therapies. It uses proprietary and modular T cell programming technologies that are designed to recognize cancer cells, break down their defense mechanisms, and attack and kill these cells. The company was founded by Martin Pule in September 2014 and is headquartered in London, the United Kingdom. |
|
 |
 |
| Market Cap | 10.91B | EPS (ttm) | 2.74 |
| P/E | 27.39 | EPS this Y | 5.81% |
| Forward P/E | 22.65 | EPS next Y | 21.41% |
| PEG | 1.98 | EPS past 5Y | 20.48% |
| P/S | 3.64 | EPS next 5Y | 13.83% |
| P/B | 7.71 | EPS Q/Q | -32.68% |
| Dividend | 0.27% | Sales Q/Q | 5.31% |
| Insider Own | 35.02% | Inst Own | 78.64% |
| Insider Trans | -0.11% | Inst Trans | -10.56% |
| Short Float | 3.41% | Earnings | May 17/b |
| Analyst Recom | 2.00 | Target Price | 85.20 |
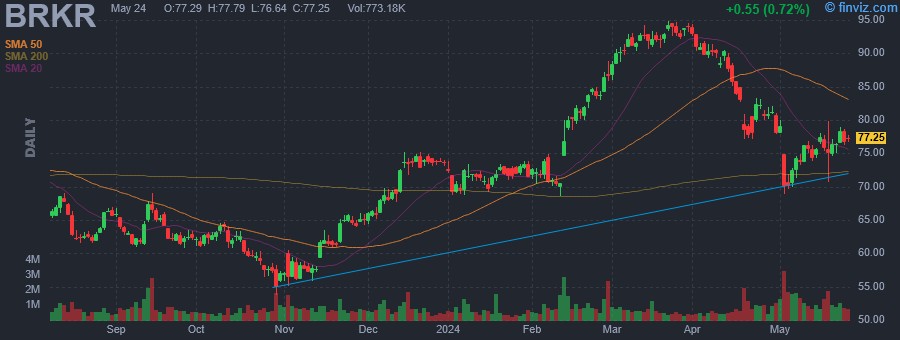
| Avg Volume | 935.55K | 52W Range | 53.79 - 94.86 |
|
|
|
|
Bruker Corp. engages in the business of developing, manufacturing, and distributing high-performance scientific instruments and analytical and diagnostic solutions that enable customers to explore life and materials at microscopic, molecular, and cellular levels. It operates through the following segments: Bruker Scientific Instruments (BSI) BioSpin, BSI Chemicals, Applied Markets, Life Science, In-Vitro Diagnostics, Detection (CALID), BSI Nano, and Bruker Energy and Supercon Technologies (BEST). The BSI BioSpin segment includes life science tools based on magnetic resonance technology. The BSI CALID segment focuses on life science mass spectrometry and ion mobility spectrometry solutions, analytical and process analysis instruments, and solutions based on infrared and Raman molecular spectroscopy technologies and radiological and nuclear detectors for chemical, biological, radiological, nuclear, and explosive detection. The BSI Nano segment offers advanced x-ray instruments, atomic force microscopy instrumentation, advanced fluorescence optical microscopy instruments, analytical tools for electron microscopes and x-ray metrology, defect-detection equipment for semiconductor process control, handheld, portable, and mobile x-ray fluorescence spectrometry instruments, spark optical emission spectroscopy systems, and chip cytometry products and services for targeted spatial proteomics, multi-omics services, and products and services for spatial genomics research. The BEST segment is involved in superconducting and non-superconducting materials and devices for use in renewable energy, energy infrastructure, healthcare, and big science research. The company was founded by Emil Bruker and Gunther Laukien in 1960 and is headquartered in Billerica, MA. |
| Insider Trading |
Relationship |
Date |
Transaction |
Cost |
#Shares |
Value ($) |
#Shares Total |
SEC Form 4 |
| Requardt Hermann Fritz | Director | Mar 04 '24 | Option Exercise | 22.05 | 15,000 | 330,750 | 38,147 | Mar 06 04:05 PM | | Requardt Hermann Fritz | Director | Mar 04 '24 | Sale | 90.06 | 15,000 | 1,350,898 | 23,147 | Mar 06 04:05 PM | | Busse Falko | PRESIDENT, BIOSPIN GROUP | Feb 28 '24 | Option Exercise | 26.28 | 28,122 | 739,156 | 60,981 | Mar 01 04:05 PM | | Busse Falko | PRESIDENT, BIOSPIN GROUP | Feb 28 '24 | Sale | 85.48 | 28,122 | 2,403,890 | 32,859 | Mar 01 04:05 PM | | Prause Burkhard | PRES. & CEO, BRUKER BEST | Feb 22 '24 | Option Exercise | 43.17 | 5,450 | 235,292 | 32,384 | Feb 26 04:02 PM |
|
|
|
 |
| Market Cap | 3.19M | EPS (ttm) | -31.77 |
| P/E | - | EPS this Y | - |
| Forward P/E | - | EPS next Y | - |
| PEG | - | EPS past 5Y | 49.20% |
| P/S | 0.08 | EPS next 5Y | - |
| P/B | 0.88 | EPS Q/Q | 44.64% |
| Dividend | - | Sales Q/Q | -38.46% |
| Insider Own | 46.18% | Inst Own | 7.70% |
| Insider Trans | 5.12% | Inst Trans | -71.46% |
| Short Float | 8.98% | Earnings | May 17/b |
| Analyst Recom | 1.00 | Target Price | 176.00 |
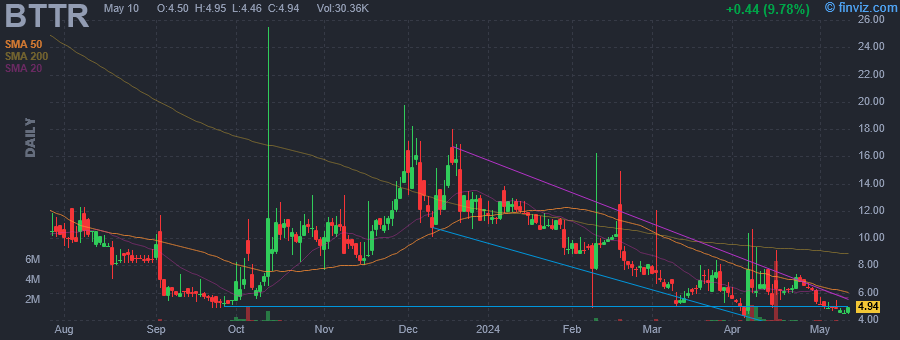
| Avg Volume | 274.79K | 52W Range | 4.15 - 25.52 |
|
|
|
|
Better Choice Co., Inc. is an animal health and wellness company. The firm sells dog food, cat food, and treats under the Halo and TruDog brands, which are focused on providing sustainably sourced kibble and canned food derived from real whole meat, and minimally processed raw-diet dog food. Its brands include Trucut, Bona Vida, Orapup, Rawgo, and TruDog. The company was founded on January 3, 2001 and is headquartered in Tampa, FL. |
| Insider Trading |
Relationship |
Date |
Transaction |
Cost |
#Shares |
Value ($) |
#Shares Total |
SEC Form 4 |
| Young Michael | Director | Sep 07 '23 | Buy | 0.13 | 20,000 | 2,578 | 112,500 | Feb 05 09:59 PM | | Young Michael | Director | Sep 07 '23 | Buy | 0.13 | 20,000 | 2,578 | 112,500 | Sep 07 04:06 PM |
|
|
| |
 |
| Market Cap | 224.24M | EPS (ttm) | -2.40 |
| P/E | - | EPS this Y | 94.48% |
| Forward P/E | - | EPS next Y | - |
| PEG | - | EPS past 5Y | - |
| P/S | 1.06 | EPS next 5Y | - |
| P/B | 0.64 | EPS Q/Q | -109.77% |
| Dividend | - | Sales Q/Q | -10.90% |
| Insider Own | - | Inst Own | 27.69% |
| Insider Trans | - | Inst Trans | -8.15% |
| Short Float | 17.81% | Earnings | May 17/b |
| Analyst Recom | 1.00 | Target Price | 3.00 |
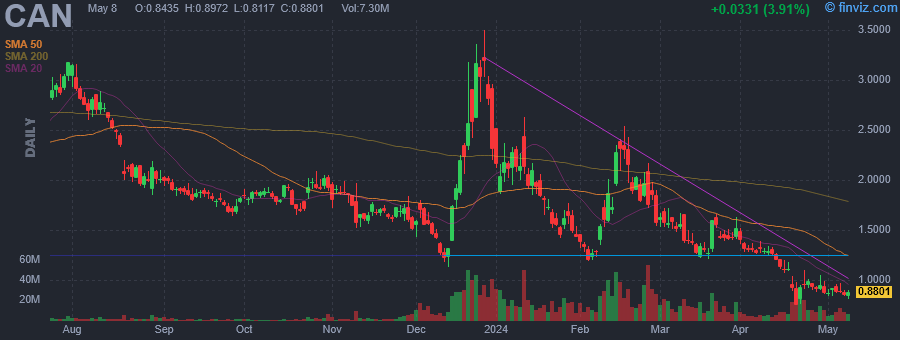
| Avg Volume | 14.12M | 52W Range | 0.75 - 3.50 |
|
|
|
|
Canaan, Inc. is a holding company, which engages in developing and selling Bitcoin mining machines and related services. It focuses on the development of green mining. The company was founded by Jia Xuan Li, Xiang Fu Liu and Nan Geng Zhang in 2013 and is headquartered in Singapore. |
|
|
 |
| Market Cap | 13.60B | EPS (ttm) | 1.73 |
| P/E | 23.85 | EPS this Y | 8.40% |
| Forward P/E | 18.78 | EPS next Y | 15.83% |
| PEG | 0.92 | EPS past 5Y | 34.97% |
| P/S | 4.41 | EPS next 5Y | 26.05% |
| P/B | 7.63 | EPS Q/Q | 670.36% |
| Dividend | 1.84% | Sales Q/Q | 48.36% |
| Insider Own | 0.12% | Inst Own | 45.26% |
| Insider Trans | 0.00% | Inst Trans | -1.88% |
| Short Float | 3.06% | Earnings | May 17/b |
| Analyst Recom | 1.13 | Target Price | 51.61 |
| Avg Volume | 1.69M | 52W Range | 30.20 - 48.40 |
|
|
|
|
H World Group Ltd. is engaged in the operation of hotels. The firm operates through the Legacy Huazhu and Legacy DH segments. It targets economy, midscale, upper midscale, and upscale hotel brands. The economy hotel brands are composed of HanTing, Ni Hao, Hi Inn, Elan, Zleep, and Ibis Hotels. The midscale hotel includes JI Hotel, Orange Hotel, Starway, and Ibis Styles Hotels. The upper midscale hotel brands consist of Crystal Orange, Intercity, Manxin, Mercure, Madison, and Novotel Hotels. The upscale hotel brands refer to Joya Hotel, Blossom House, Steigenberger Hotels and Resorts, MAXX by Steigenberger, Jaz in the City, and Grand Mercure. The company was founded by Qi Ji, Jiong Wu, and Tong Tong Zhao on January 4, 2007 and is headquartered in Shanghai, China. |
|
| |
 |
| Market Cap | 163.64M | EPS (ttm) | -0.03 |
| P/E | - | EPS this Y | 0.32% |
| Forward P/E | - | EPS next Y | 0.00% |
| PEG | - | EPS past 5Y | 5.75% |
| P/S | - | EPS next 5Y | - |
| P/B | 1.83 | EPS Q/Q | 26.26% |
| Dividend | - | Sales Q/Q | - |
| Insider Own | 2.08% | Inst Own | 13.82% |
| Insider Trans | 0.00% | Inst Trans | 0.07% |
| Short Float | 1.25% | Earnings | May 17/b |
| Analyst Recom | 2.00 | Target Price | 1.20 |
| Avg Volume | 1.43M | 52W Range | 0.21 - 0.43 |
|
|
|
|
Northern Dynasty Minerals Ltd. engages in the exploration and development of gold and copper mineral properties. It holds interest in the Pebble Copper-Gold-Molybdenum Project, which is an undeveloped copper-gold-molybdenum-silver resource. The company was founded on May 11, 1983 and is headquartered in Vancouver, Canada. |
|
|
 |
| Market Cap | 8.44B | EPS (ttm) | 5.98 |
| P/E | 48.34 | EPS this Y | 8.99% |
| Forward P/E | 30.13 | EPS next Y | 2.18% |
| PEG | 8.19 | EPS past 5Y | 6.70% |
| P/S | 5.48 | EPS next 5Y | 5.90% |
| P/B | 3.13 | EPS Q/Q | 33.03% |
| Dividend | - | Sales Q/Q | 6.33% |
| Insider Own | 1.76% | Inst Own | 106.45% |
| Insider Trans | -13.82% | Inst Trans | -0.33% |
| Short Float | 4.19% | Earnings | May 17/b |
| Analyst Recom | 1.50 | Target Price | 286.00 |
| Avg Volume | 134.14K | 52W Range | 195.18 - 288.16 |
|
|
|
|
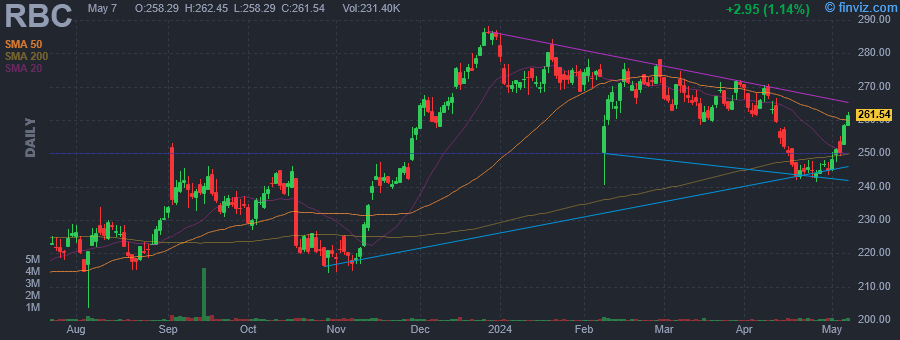
RBC Bearings, Inc. engages in the design, manufacture, and marketing of engineered precision bearings and products. It operates through the Aerospace and Defense, and Industrial segments. The Aerospace and Defense segment represents the end markets for the company's highly engineered bearings and precision components used in commercial aerospace, defense aerospace, and sea and ground defense applications. The Industrial segment refers to the end markets for the company's highly engineered bearings, gearings and precision components used in various industrial applications including power transmission, construction, mining, energy and specialized equipment manufacturing, semiconductor production equipment manufacturing, agricultural machinery, commercial truck and automotive manufacturing, and tool holding. The company was founded in 1919 and is headquartered in Oxford, CT. |
| Insider Trading |
Relationship |
Date |
Transaction |
Cost |
#Shares |
Value ($) |
#Shares Total |
SEC Form 4 |
| BERGERON DANIEL A | Vice President and COO | Feb 21 '24 | Option Exercise | 99.64 | 30,000 | 2,989,200 | 136,935 | Feb 23 04:57 PM | | BERGERON DANIEL A | Vice President and COO | Feb 21 '24 | Sale | 267.22 | 15,000 | 4,008,257 | 121,935 | Feb 23 04:57 PM | | Ambrose Michael H. | Director | Jan 02 '24 | Option Exercise | 199.16 | 300 | 59,748 | 7,100 | Jan 02 05:24 PM | | Ambrose Michael H. | Director | Jan 02 '24 | Sale | 277.80 | 300 | 83,339 | 6,800 | Jan 02 05:24 PM | | HARTNETT MICHAEL J | President and CEO | Dec 08 '23 | Option Exercise | 132.12 | 14,774 | 1,951,941 | 308,221 | Dec 08 04:51 PM |
|
|
| |
 |
| Market Cap | 39.80M | EPS (ttm) | -1.47 |
| P/E | - | EPS this Y | 21.14% |
| Forward P/E | - | EPS next Y | 55.47% |
| PEG | - | EPS past 5Y | - |
| P/S | 0.18 | EPS next 5Y | - |
| P/B | 2.21 | EPS Q/Q | -17.81% |
| Dividend | - | Sales Q/Q | -1.65% |
| Insider Own | 25.79% | Inst Own | 47.00% |
| Insider Trans | 0.00% | Inst Trans | -3.53% |
| Short Float | 0.58% | Earnings | May 17/b |
| Analyst Recom | 3.00 | Target Price | 2.00 |
| Avg Volume | 12.11K | 52W Range | 1.52 - 3.10 |
|
|
|
|
Reading International, Inc. is an entertainment and real estate company, which engages in the development, ownership, and operation of multiplex cinemas and retail and commercial real estate in the United States, Australia, and New Zealand. It operates through the Cinema Exhibition and Real Estate segments. The Cinema Exhibition segment includes Reading Cinemas, Angelika Film Center, Consolidated Theatres, City Cinemas, 44 Union Square, and Liberty Theatres brands. The Real Estate segment consists of real estate development and the rental or licensing of retail, commercial and live theater assets. The company was founded by James J. Cotter Sr. in 1999 and is headquartered in New York, NY. |
| Insider Trading |
Relationship |
Date |
Transaction |
Cost |
#Shares |
Value ($) |
#Shares Total |
SEC Form 4 |
| CUBAN MARK | 10% Owner | Sep 14 '23 | Sale | 20.35 | 200 | 4,070 | 172,355 | Sep 15 04:05 PM | | CUBAN MARK | 10% Owner | Sep 13 '23 | Sale | 20.21 | 1,813 | 36,641 | 172,555 | Sep 15 04:05 PM | | CUBAN MARK | 10% Owner | Sep 12 '23 | Sale | 20.22 | 900 | 18,196 | 174,368 | Sep 13 04:05 PM | | CUBAN MARK | 10% Owner | Sep 11 '23 | Sale | 20.20 | 2,069 | 41,795 | 175,268 | Sep 13 04:05 PM | | CUBAN MARK | 10% Owner | Sep 08 '23 | Sale | 20.04 | 600 | 12,025 | 177,337 | Sep 11 04:05 PM |
|
|
|
 |
| Market Cap | 1.96B | EPS (ttm) | 0.05 |
| P/E | 37.16 | EPS this Y | 74.55% |
| Forward P/E | 17.21 | EPS next Y | 22.85% |
| PEG | 2.92 | EPS past 5Y | 90.13% |
| P/S | 11.96 | EPS next 5Y | 12.71% |
| P/B | 0.89 | EPS Q/Q | 191.02% |
| Dividend | - | Sales Q/Q | 54.43% |
| Insider Own | 6.59% | Inst Own | 22.17% |
| Insider Trans | 0.00% | Inst Trans | -3.21% |
| Short Float | 3.45% | Earnings | May 17/b |
| Analyst Recom | 1.00 | Target Price | 2.95 |
| Avg Volume | 4.96M | 52W Range | 1.39 - 2.47 |
|
|
|
|
RLX Technology, Inc. operates as a holding company, which engages in the manufacturing and sale of e-vapor products. It conducts business through its subsidiaries and a variable interest entity that engages in activities in the e-vapor industry, scientific research, technology and product development, and supply chain management to offline distribution. The company was founded by Ying Wang, Long Jiang, and Yilong Wen on January 2, 2018 and is headquartered in Shenzhen, China. |
|
|
 |
| Market Cap | 6.19M | EPS (ttm) | -33.83 |
| P/E | - | EPS this Y | - |
| Forward P/E | - | EPS next Y | - |
| PEG | - | EPS past 5Y | 40.46% |
| P/S | 0.37 | EPS next 5Y | - |
| P/B | - | EPS Q/Q | -184.15% |
| Dividend | - | Sales Q/Q | -52.32% |
| Insider Own | 34.90% | Inst Own | 8.32% |
| Insider Trans | 0.00% | Inst Trans | - |
| Short Float | 6.56% | Earnings | May 17/b |
| Analyst Recom | 1.00 | Target Price | 56.24 |
| Avg Volume | 2.09M | 52W Range | 2.01 - 27.00 |
|
|
|
|
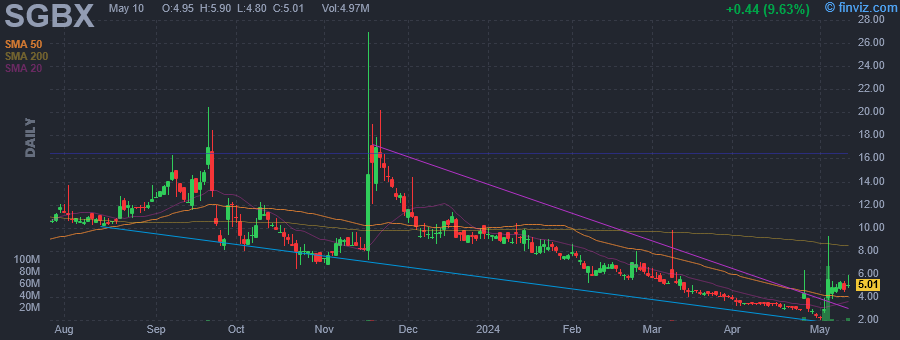
Safe & Green Holdings Corp. is a design and construction services company, which engages in the provision of code engineered cargo shipping containers. It operates through the following segments: Construction, Medical, Development, and Corporate and Support. The Construction Services segment includes the manufacturing of unit SG ECHO and other modules projects. The Medical segment consists of joint venture COVID-19 laboratory operations. The Development segment focuses on real property development. The Corporate and Support segment includes general corporate expenses such as the executive office, corporate finance, accounting, audit, tax, human resources, risk management, information technology, marketing, and legal groups, corporate overhead, and other items not allocated to any of the company's other segments. The company was founded on December 29, 1993 and is headquartered in Miami, FL. |
|
|
