 |
| Market Cap | 58.03B | EPS (ttm) | -12.72 |
| P/E | - | EPS this Y | -5.02% |
| Forward P/E | 13.17 | EPS next Y | 8.51% |
| PEG | - | EPS past 5Y | - |
| P/S | 1.78 | EPS next 5Y | -5.25% |
| P/B | 11.92 | EPS Q/Q | -5.38% |
| Dividend | 2.98% | Sales Q/Q | -0.35% |
| Insider Own | 0.08% | Inst Own | 67.00% |
| Insider Trans | -0.10% | Inst Trans | -1.00% |
| Short Float | 1.64% | Earnings | Apr 30/b |
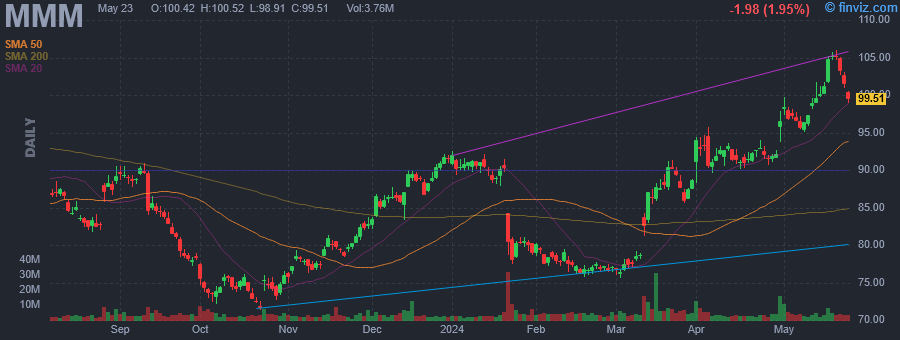
| Analyst Recom | 2.78 | Target Price | 107.15 |
| Avg Volume | 5.92M | 52W Range | 71.35 - 101.74 |
|
|
| May-16-24 | Upgrade |
Vertical Research |
Hold → Buy |
$140 |
|
|
|
3M Co. is a technology company, which manufactures industrial, safety, and consumer products. It operates through the following segments: Safety and Industrial, Transportation and Electronics, Health Care, Consumer, and Corporate and Unallocated. The Safety and Industrial segment consists of personal safety, industrial adhesives and tapes, abrasives, closure and masking systems, electrical markets, automotive aftermarket, and roofing granules. The Transportation and Electronics segment includes electronics, automotive and aerospace, commercial solutions, advanced materials, and transportation safety. The Health Care segment offers medical and surgical supplies, skin health and infection prevention products, oral care solutions, separation and purification sciences, health information systems, inhalation and transdermal drug delivery systems, and food safety products. The Consumer segment covers consumer healthcare, home care, home improvement, and stationery and office products, such as consumer bandages, braces, supports, respirators, cleaning products, retail abrasives, picture hanging, and consumer air quality solutions. The Corporate and Unallocated segment refers to special items and other corporate expense-net. The company was founded by Henry S. Bryan, Hermon W. Cable, John Dwan, William A. McGonagle, and J. Danley Budd in 1902 and is headquartered in St. Paul, MN. |
| Insider Trading |
Relationship |
Date |
Transaction |
Cost |
#Shares |
Value ($) |
#Shares Total |
SEC Form 4 |
| Dickson Zoe L | EVP & Chief HR Officer | May 01 '24 | Option Exercise | 98.44 | 983 | 96,767 | 4,504 | May 03 12:10 PM | | Chavez Rodriguez Beatriz Karin | Group President | Feb 14 '24 | Sale | 92.32 | 426 | 39,330 | 3,966 | Feb 15 02:44 PM | | Patolawala Monish D | EVP, CFO & Transformation Off | Feb 02 '24 | Option Exercise | 94.87 | 6,128 | 581,363 | 22,935 | Feb 05 01:11 PM | | Rhodes Kevin H | EVP & Chief Legal Officer | Feb 02 '24 | Option Exercise | 94.87 | 414 | 39,276 | 3,760 | Feb 05 01:15 PM | | Chavez Rodriguez Beatriz Karin | Group President | Feb 02 '24 | Option Exercise | 94.87 | 286 | 27,133 | 4,164 | Feb 05 01:26 PM |
|
|
 |
 |
| Market Cap | 390.46M | EPS (ttm) | 0.49 |
| P/E | 39.95 | EPS this Y | 1.66% |
| Forward P/E | 8.49 | EPS next Y | 62.89% |
| PEG | - | EPS past 5Y | -20.59% |
| P/S | 1.53 | EPS next 5Y | - |
| P/B | 1.05 | EPS Q/Q | -20.35% |
| Dividend | 3.88% | Sales Q/Q | 17.88% |
| Insider Own | 11.64% | Inst Own | 47.04% |
| Insider Trans | 0.00% | Inst Trans | 16.30% |
| Short Float | 2.28% | Earnings | Apr 24/a |
| Analyst Recom | 2.60 | Target Price | 22.38 |
| Avg Volume | 40.99K | 52W Range | 14.05 - 25.85 |
|
|
| May-16-24 | Upgrade |
Hovde Group |
Market Perform → Outperform |
$21 → $23 |
|
|
|
Alerus Financial Corp. engages in the provision of business and consumer financial products and services through its subsidiary, Alerus Financial NA. It operates through the following segments: Banking, Retirement & Benefit Services, Wealth Management, Mortgage, and Corporate Administration. The Banking segment provides lending and deposit products. The Retirement & Benefit Services segment consists of retirement plan administration and investment advisory services, employee stock ownership plan, fiduciary services, payroll, HSA, and other benefit services. The Wealth Management segment offers fiduciary services to consumer and commercial clients, including financial planning, investment management, personal and corporate trust services, estate administration, and custody services. The Mortgage segment includes first and second mortgage loans through a centralized mortgage unit. The Corporate Administration segment covers indirect overhead allocations and income tax expense. The was company founded in 1879 and is headquartered in Grand Folks, ND. |
| Insider Trading |
Relationship |
Date |
Transaction |
Cost |
#Shares |
Value ($) |
#Shares Total |
SEC Form 4 |
| Lorenson Katie A | President and CEO | Feb 27 '24 | Option Exercise | 0.00 | 3,234 | 0 | 43,507 | Feb 29 04:10 PM | | Taylor Karin M | EVP and Chief Risk Officer | Feb 27 '24 | Option Exercise | 0.00 | 2,648 | 0 | 24,811 | Feb 29 04:09 PM | | Newman Randy L | Director | Feb 27 '24 | Option Exercise | 0.00 | 13,251 | 0 | 205,572 | Feb 29 04:08 PM | | Keney Missy | Chief Engagement Officer & EVP | Feb 27 '24 | Option Exercise | 0.00 | 504 | 0 | 6,896 | Feb 29 04:10 PM | | Hendry Jon | Chief Technology Officer & EVP | Feb 27 '24 | Option Exercise | 0.00 | 2,298 | 0 | 53,192 | Feb 29 04:06 PM |
|
|
|
 |
| Market Cap | 754.93M | EPS (ttm) | -1.44 |
| P/E | - | EPS this Y | -16.75% |
| Forward P/E | 10.78 | EPS next Y | 7.46% |
| PEG | - | EPS past 5Y | - |
| P/S | 0.37 | EPS next 5Y | 1.20% |
| P/B | 0.97 | EPS Q/Q | -1174.79% |
| Dividend | 7.96% | Sales Q/Q | -7.15% |
| Insider Own | 3.21% | Inst Own | 69.32% |
| Insider Trans | 5.92% | Inst Trans | -3.13% |
| Short Float | 8.39% | Earnings | May 08/a |
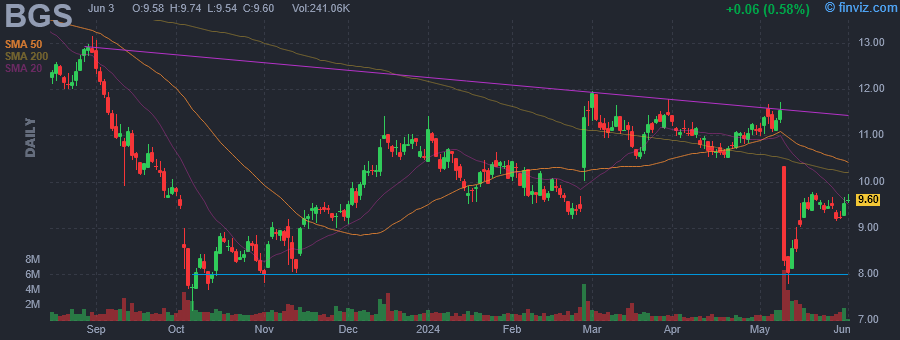
| Analyst Recom | 3.57 | Target Price | 9.86 |
| Avg Volume | 1.21M | 52W Range | 7.20 - 15.15 |
|
|
| May-16-24 | Upgrade |
Piper Sandler |
Underweight → Neutral |
$9 |
|
|
May-16-24 07:03AM
|
Piper Sandler Upgrades B&G Foods to Neutral From Underweight, Price Target at $9
(MT Newswires) +5.52% |
|
May-14-24 07:01PM
|
Director Stephen Sherrill Acquires 125,000 Shares of B&G Foods Inc (BGS)
(GuruFocus.com) |
|
07:01PM
|
Insider Buying Alert: EVP & GENERAL COUNSEL Scott Lerner Acquires Shares of B&G Foods ...
(GuruFocus.com) |
|
May-13-24 07:48AM
|
Four Sixes Seasonings, BBQ & Hot Sauces Set to Bring Texas Ranch-Inspired Flavors to Homes Across America
(PR Newswire) +6.99% |
|
May-10-24 02:36PM
|
B&G Foods Inc. (BGS) Q1 2024 Earnings: Challenges Persist Amidst Strategic Adjustments
(GuruFocus.com) |
|
06:41AM
|
Beyond Meat pressure, Tysons chicken challenge, Hain pains, Green Giant future Just Foods week in data
(Just Food) |
|
May-09-24 03:43PM
|
B&G Foods, Inc. (NYSE:BGS) Q1 2024 Earnings Call Transcript
(Insider Monkey) -28.31% |
|
01:06PM
|
B&G Foods (BGS) Q1 Earnings & Sales Lag Estimates, Volumes Soft
(Zacks) |
|
07:01AM
|
B&G Foods plans asset sale, cuts sales, profit forecasts
(Just Food) |
|
07:01AM
|
B&G Foods exploring sale of Green Giant frozen, canned vegetable businesses
(Food Dive) |
|
B&G Foods, Inc. is a holding company, which engages in the manufacture, sale, and distribution of shelf-stable frozen food, and household products in the U.S., Canada, and Puerto Rico. Its products include frozen and canned vegetables, hot cereals, fruit spreads, canned meats and beans, bagel chips, spices, seasonings, hot sauces, and wine vinegar. Its brands include Back to Nature, Bear Creek, Cream of Wheat, Green Giant, Mrs. Dash, and Ortega. The company was founded in 1889 and is headquartered in Parsippany, NJ. |
| Insider Trading |
Relationship |
Date |
Transaction |
Cost |
#Shares |
Value ($) |
#Shares Total |
SEC Form 4 |
| SHERRILL STEPHEN | Director | May 13 '24 | Buy | 8.59 | 125,000 | 1,073,650 | 270,136 | May 14 05:07 PM | | Lerner Scott E | EVP & GENERAL COUNSEL | May 13 '24 | Buy | 8.51 | 11,755 | 99,979 | 189,144 | May 14 05:09 PM | | Wacha Bruce C | EVP OF FINANCE & CFO | May 13 '24 | Buy | 8.59 | 5,200 | 44,667 | 91,328 | May 14 04:44 PM | | Greenberg Jordan E | EVP & PRES OF SPICES & FLAVOR | Jun 14 '23 | Sale | 13.45 | 13,000 | 174,882 | 56,999 | Jun 14 06:21 PM |
|
|
| |
 |
| Market Cap | 20.85B | EPS (ttm) | 1.71 |
| P/E | 16.33 | EPS this Y | -12.82% |
| Forward P/E | 9.42 | EPS next Y | 50.92% |
| PEG | 1.26 | EPS past 5Y | 11.36% |
| P/S | 3.90 | EPS next 5Y | 13.00% |
| P/B | 1.59 | EPS Q/Q | -46.96% |
| Dividend | 3.03% | Sales Q/Q | -16.72% |
| Insider Own | 1.79% | Inst Own | 89.78% |
| Insider Trans | -0.52% | Inst Trans | 0.63% |
| Short Float | 2.14% | Earnings | May 02/a |
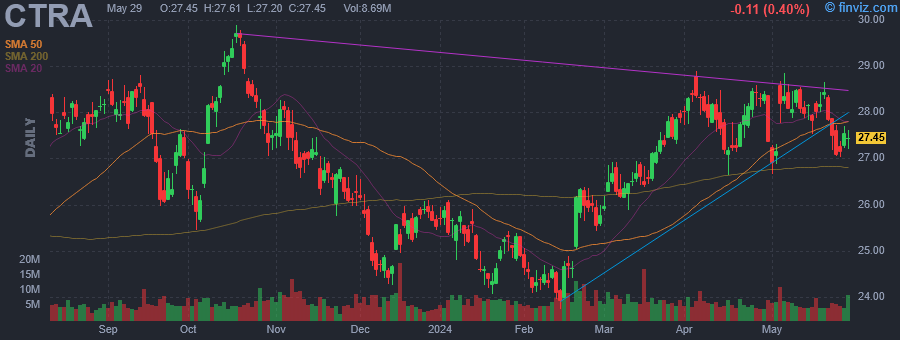
| Analyst Recom | 1.80 | Target Price | 34.06 |
| Avg Volume | 6.78M | 52W Range | 22.91 - 29.89 |
|
|
| May-16-24 | Upgrade |
Truist |
Hold → Buy |
$27 → $35 |
|
|
|
Coterra Energy Inc. is a diversified energy company, which engages in the exploration, development, and production of oil and natural gas properties. Its portfolio includes projects in the Permian Basin, the Marcellus Shale, and the Anadarko Basin. The company was renamed to Coterra Energy Inc. on October 1, 2021 in connection with the merger involving Cabot Oil & Gas Corp. and Cimarex Energy Co. Coterra Energy was founded in 1989 and is headquartered in Houston, TX. |
| Insider Trading |
Relationship |
Date |
Transaction |
Cost |
#Shares |
Value ($) |
#Shares Total |
SEC Form 4 |
| Roemer Todd M | Vice Pres & CAO | Mar 20 '24 | Sale | 27.06 | 55,000 | 1,488,300 | 176,758 | Mar 22 05:26 PM | | DeShazer Michael D. | VP - Business Units | Mar 01 '24 | Sale | 26.06 | 14,000 | 364,840 | 93,988 | Mar 05 06:47 PM | | DINGES DAN O | Director | Sep 27 '23 | Sale | 27.22 | 68,275 | 1,858,446 | 3,152,392 | Sep 27 05:34 PM | | DINGES DAN O | Director | Sep 26 '23 | Sale | 26.59 | 81,725 | 2,173,068 | 3,220,667 | Sep 27 05:34 PM | | DINGES DAN O | Director | Sep 25 '23 | Sale | 26.60 | 400,000 | 10,640,000 | 3,302,392 | Sep 27 05:34 PM |
|
|
|
 |
| Market Cap | 40.89B | EPS (ttm) | 0.70 |
| P/E | 32.48 | EPS this Y | -77.00% |
| Forward P/E | 38.90 | EPS next Y | 240.83% |
| PEG | - | EPS past 5Y | - |
| P/S | 1.59 | EPS next 5Y | - |
| P/B | 10.06 | EPS Q/Q | -94.66% |
| Dividend | - | Sales Q/Q | 22.64% |
| Insider Own | 34.60% | Inst Own | 51.28% |
| Insider Trans | -11.13% | Inst Trans | 0.00% |
| Short Float | 2.41% | Earnings | May 07/a |
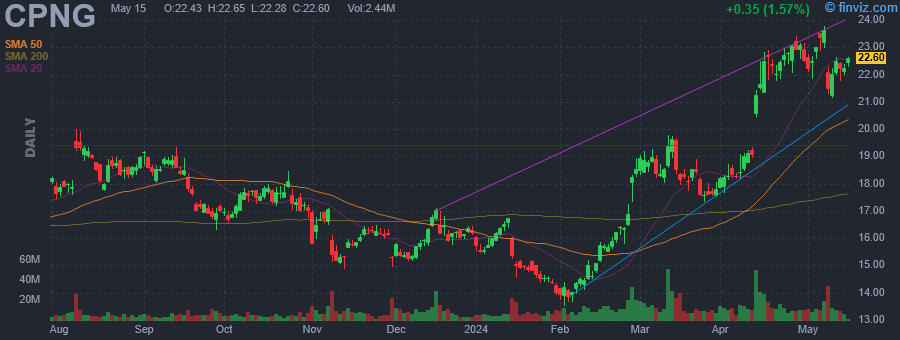
| Analyst Recom | 1.71 | Target Price | 26.21 |
| Avg Volume | 15.48M | 52W Range | 13.51 - 23.77 |
|
|
| May-16-24 | Upgrade |
UBS |
Neutral → Buy |
$26 |
|
|
May-16-24 09:20AM
|
1 Wall Street Analyst Thinks Coupang Stock Is Going to $32. Is It a Buy Around $22?
(Motley Fool) |
|
07:05AM
|
UBS Upgrades Coupang to Buy From Neutral
(MT Newswires) |
|
May-15-24 09:20PM
|
Lee Ainslie's Strategic Moves in Q1 2024: A Deep Dive into Coupang Inc's Significant Reduction
(GuruFocus.com) |
|
01:55PM
|
Hedge Fund and Insider Trading News: Jim Simons, Bridgewater Associates, Tide Capital, Millennium Management, Archegos Capital Management, Akamai Technologies, Inc. (AKAM), Coupang Inc (CPNG), and More
(Insider Monkey) |
|
02:22AM
|
15 Stocks That Will 10x in 5 Years According to the Analysts
(Insider Monkey) |
|
May-11-24 02:43AM
|
Insider Sale: Chief Accounting Officer Jonathan Lee Sells Shares of Coupang Inc (CPNG)
(GuruFocus.com) |
|
May-10-24 01:04AM
|
Decoding Coupang Inc (CPNG): A Strategic SWOT Insight
(GuruFocus.com) |
|
May-09-24 11:11AM
|
Barclays Adjusts Price Target on Coupang to $32 From $25, Maintains Overweight Rating
(MT Newswires) |
|
May-08-24 02:23PM
|
Coupang Stock Slides Following Q1 Profit Miss
(Investor's Business Daily) -9.26% |
|
11:16AM
|
Coupang, Inc. (NYSE:CPNG) Q1 2024 Earnings Call Transcript
(Insider Monkey) |
|
Coupang, Inc. engages in operating an e-commerce platform. It operates through the following segments: Product Commerce and Developing Offerings segments. The Product Commerce segment provides core retail and marketplace offerings and Rocket Fresh, as well as advertising products associated with these offerings. The Developing Offerings segment includes nascent offerings and services, including Coupang Eats, Coupang Play, international and fintech initiatives. The company was founded in 2010 and is headquartered in Seattle, WA. |
| Insider Trading |
Relationship |
Date |
Transaction |
Cost |
#Shares |
Value ($) |
#Shares Total |
SEC Form 4 |
| GREENOAKS CAPITAL PARTNERS LLC | Director | May 14 '24 | Buy | 22.28 | 298,550 | 6,650,440 | 48,924,924 | May 14 09:00 PM | | GREENOAKS CAPITAL PARTNERS LLC | Director | May 13 '24 | Buy | 22.06 | 500,000 | 11,029,950 | 48,626,374 | May 14 09:00 PM | | GREENOAKS CAPITAL PARTNERS LLC | Director | May 10 '24 | Buy | 22.53 | 120,239 | 2,709,057 | 48,126,374 | May 14 09:00 PM | | Lee Jonathan D. | Chief Accounting Officer | May 09 '24 | Sale | 21.45 | 5,000 | 107,250 | 120,835 | May 10 04:38 PM | | Kolari Pranam | See Remarks | May 02 '24 | Sale | 22.34 | 2,048 | 45,752 | 187,951 | May 03 04:48 PM |
|
|
| |
 |
| Market Cap | 10.07M | EPS (ttm) | -3.70 |
| P/E | - | EPS this Y | 21.69% |
| Forward P/E | - | EPS next Y | 2.31% |
| PEG | - | EPS past 5Y | 36.40% |
| P/S | 22.89 | EPS next 5Y | - |
| P/B | 1.31 | EPS Q/Q | 32.27% |
| Dividend | - | Sales Q/Q | -33.80% |
| Insider Own | 2.80% | Inst Own | 7.36% |
| Insider Trans | -0.37% | Inst Trans | 274.41% |
| Short Float | 8.65% | Earnings | May 14/a |
| Analyst Recom | 1.00 | Target Price | 2.25 |
| Avg Volume | 61.98K | 52W Range | 1.30 - 7.66 |
|
|
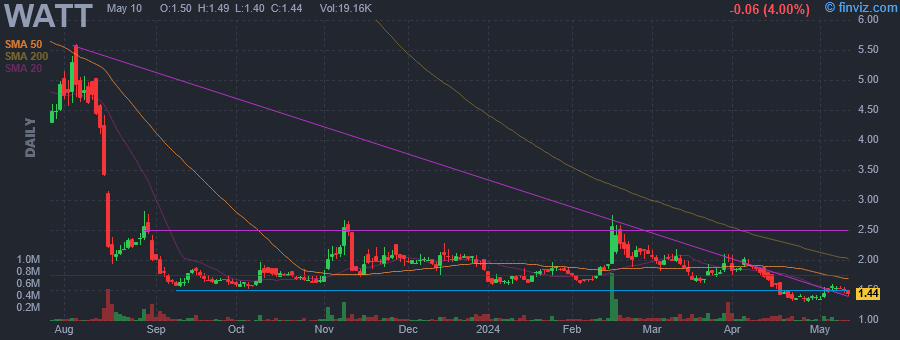
| May-16-24 | Upgrade |
Ladenburg Thalmann |
Neutral → Buy |
$2 |
|
|
|
Energous Corp. engages in the development of wireless charging technology. It focuses on the product, WattUp, a wireless power technology consisting of proprietary semiconductor chipsets, software controls, hardware designs, and antennas, that enables radio frequency based charging for electronic devices. The company was founded by Michael Aaron Leabman in 2012 and is headquartered in San Jose, CA. |
| Insider Trading |
Relationship |
Date |
Transaction |
Cost |
#Shares |
Value ($) |
#Shares Total |
SEC Form 4 |
| Patel Rahul G. | Director | Jan 03 '24 | Sale | 1.60 | 675 | 1,080 | 3,659 | Jan 04 04:08 PM | | Johnston Cesar | CEO and President | Nov 13 '23 | Buy | 1.82 | 52,000 | 94,640 | 91,651 | Nov 15 01:09 PM | | MANNINA WILLIAM T | Acting CFO (Interim) | Jun 01 '23 | Sale | 0.30 | 22,356 | 6,640 | 181,872 | Jun 05 08:35 PM |
|
|
|
 |
| Market Cap | 1.56B | EPS (ttm) | -0.06 |
| P/E | - | EPS this Y | -51.51% |
| Forward P/E | 16.16 | EPS next Y | 40.24% |
| PEG | - | EPS past 5Y | - |
| P/S | 1.27 | EPS next 5Y | 20.00% |
| P/B | 23.95 | EPS Q/Q | -399.46% |
| Dividend | - | Sales Q/Q | -36.53% |
| Insider Own | 2.72% | Inst Own | 93.57% |
| Insider Trans | -2.94% | Inst Trans | 3.31% |
| Short Float | 9.67% | Earnings | May 01/b |
| Analyst Recom | 1.86 | Target Price | 14.75 |
| Avg Volume | 2.16M | 52W Range | 10.49 - 32.73 |
|
|
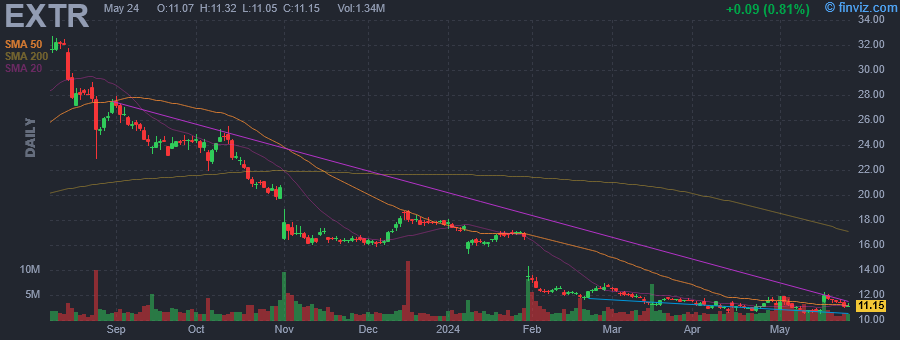
| May-16-24 | Upgrade |
Craig Hallum |
Hold → Buy |
$14 |
|
|
|
Extreme Networks, Inc. engages in the provision of software driven networking solutions for enterprise, data center, and service provider customers. It operates through the following geographical segments: Americas, EMEA, and APAC. Its products include Extreme Applications, Extreme Switching, Extreme Routing and Extreme Mobility. The company was founded in May 1996 and is headquartered in Morrisville, NC. |
| Insider Trading |
Relationship |
Date |
Transaction |
Cost |
#Shares |
Value ($) |
#Shares Total |
SEC Form 4 |
| MEYERCORD EDWARD | PRESIDENT AND CEO | May 15 '24 | Option Exercise | 0.00 | 64,728 | 0 | 1,174,199 | May 16 04:46 PM | | MOTIEY KATAYOUN | Chief Legal Admin Sust Officer | May 15 '24 | Option Exercise | 0.00 | 9,498 | 0 | 109,691 | May 16 04:47 PM | | MEYERCORD EDWARD | PRESIDENT AND CEO | May 09 '24 | Sale | 10.63 | 50,000 | 531,370 | 1,119,724 | May 10 04:11 PM | | MOTIEY KATAYOUN | Chief Legal Admin Sust Officer | Feb 15 '24 | Option Exercise | 0.00 | 9,498 | 0 | 104,405 | Feb 16 04:19 PM | | MEYERCORD EDWARD | PRESIDENT AND CEO | Feb 15 '24 | Option Exercise | 0.00 | 64,727 | 0 | 1,184,942 | Feb 16 04:18 PM |
|
|
| |
 |
| Market Cap | 3.02B | EPS (ttm) | -0.02 |
| P/E | - | EPS this Y | 31.41% |
| Forward P/E | 17.86 | EPS next Y | 22.63% |
| PEG | - | EPS past 5Y | - |
| P/S | 3.96 | EPS next 5Y | 26.30% |
| P/B | 4.79 | EPS Q/Q | 67.50% |
| Dividend | - | Sales Q/Q | 7.55% |
| Insider Own | 79.32% | Inst Own | 14.89% |
| Insider Trans | 0.06% | Inst Trans | -5.59% |
| Short Float | 10.95% | Earnings | May 09/b |
| Analyst Recom | 2.14 | Target Price | 9.06 |
| Avg Volume | 1.45M | 52W Range | 4.14 - 9.37 |
|
|
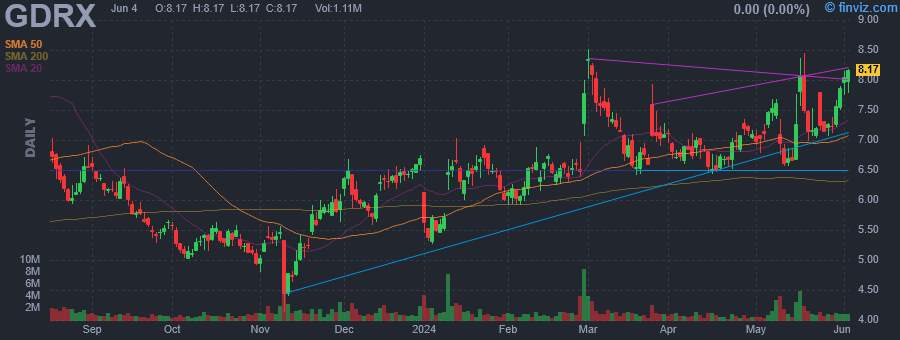
| May-16-24 | Upgrade |
Raymond James |
Mkt Perform → Outperform |
$10 |
|
|
|
GoodRx Holdings, Inc. engages in the business of a consumer-focused digital healthcare platform. The firm offers consumers free access to transparent and lower prices for brand and generic medications, affordable and convenient medical provider consultations via telehealth, and comprehensive healthcare research and information. The company was founded by Trevor Bezdek and Douglas Joseph Hirsch in September 2011 and is headquartered in Santa Monica, CA. |
| Insider Trading |
Relationship |
Date |
Transaction |
Cost |
#Shares |
Value ($) |
#Shares Total |
SEC Form 4 |
| Voermann Karsten | Chief Financial Officer | Dec 08 '23 | Option Exercise | 0.00 | 54,064 | 0 | 199,885 | Dec 08 05:18 PM | | Wagner Scott | See Remarks | Nov 30 '23 | Buy | 5.76 | 21,652 | 124,806 | 182,900 | Dec 04 04:35 PM | | Wagner Scott | See Remarks | Nov 29 '23 | Buy | 5.90 | 26,348 | 155,482 | 161,248 | Nov 30 04:41 PM | | Wagner Scott | See Remarks | Nov 28 '23 | Buy | 6.00 | 4,157 | 24,940 | 134,900 | Nov 30 04:41 PM | | Wagner Scott | See Remarks | Nov 17 '23 | Buy | 5.26 | 26,664 | 140,271 | 130,743 | Nov 17 07:08 PM |
|
|
|
 |
| Market Cap | 798.16M | EPS (ttm) | -2.75 |
| P/E | - | EPS this Y | - |
| Forward P/E | - | EPS next Y | - |
| PEG | - | EPS past 5Y | 9.00% |
| P/S | 13.98 | EPS next 5Y | - |
| P/B | 1.08 | EPS Q/Q | 53.13% |
| Dividend | - | Sales Q/Q | 267.92% |
| Insider Own | 0.39% | Inst Own | 18.59% |
| Insider Trans | -35.11% | Inst Trans | - |
| Short Float | 6.93% | Earnings | May 15/b |
| Analyst Recom | 1.67 | Target Price | 12.25 |
| Avg Volume | 3.77M | 52W Range | 6.18 - 22.75 |
|
|
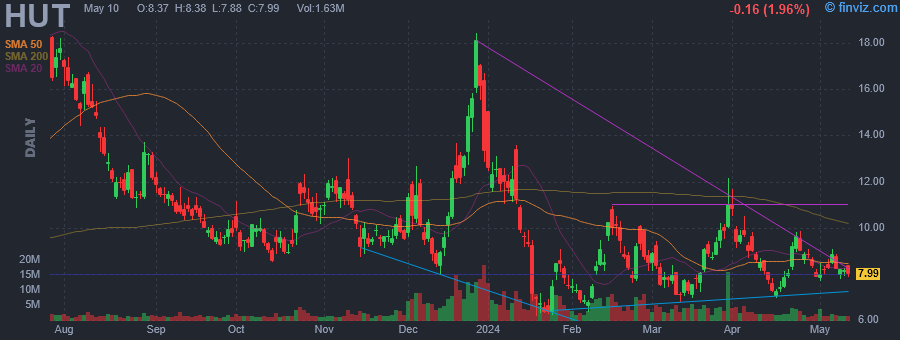
| May-16-24 | Upgrade |
Craig Hallum |
Hold → Buy |
$12 |
|
|
|
Hut 8 Corp. operates as a Bitcoin miner that focuses on mining. It provides digital asset mining, hosting, and managed infrastructure operation services. The company was founded on January 27, 2023 and is headquartered in Miami, FL. |
| Insider Trading |
Relationship |
Date |
Transaction |
Cost |
#Shares |
Value ($) |
#Shares Total |
SEC Form 4 |
| Visram Shenif | Chief Financial Officer | May 09 '24 | Sale | 8.15 | 17,905 | 145,940 | 30,865 | May 10 06:08 PM | | Leverton Jaime | Chief Executive Officer | Jan 12 '24 | Sale | 10.10 | 35,761 | 361,261 | 269,415 | Jan 16 08:35 PM | | Leverton Jaime | Chief Executive Officer | Dec 22 '23 | Sale | 14.21 | 98,724 | 1,402,957 | 238,509 | Dec 27 07:04 PM | | Amdiss Aniss | Chief Legal Officer | Dec 22 '23 | Sale | 14.21 | 18,513 | 263,086 | 23,333 | Dec 27 07:03 PM | | Visram Shenif | Chief Financial Officer | Dec 22 '23 | Sale | 14.14 | 17,897 | 253,067 | 15,437 | Dec 27 07:04 PM |
|
|
|
 |
| Market Cap | 136.35B | EPS (ttm) | 0.96 |
| P/E | 33.37 | EPS this Y | 6.65% |
| Forward P/E | 16.49 | EPS next Y | 73.41% |
| PEG | 0.84 | EPS past 5Y | -38.29% |
| P/S | 2.47 | EPS next 5Y | 39.84% |
| P/B | 1.29 | EPS Q/Q | 86.47% |
| Dividend | 1.61% | Sales Q/Q | 8.61% |
| Insider Own | 0.05% | Inst Own | 67.02% |
| Insider Trans | 0.66% | Inst Trans | -1.78% |
| Short Float | 1.65% | Earnings | Apr 25/a |
| Analyst Recom | 2.73 | Target Price | 38.32 |
| Avg Volume | 50.05M | 52W Range | 26.85 - 51.28 |
|
|
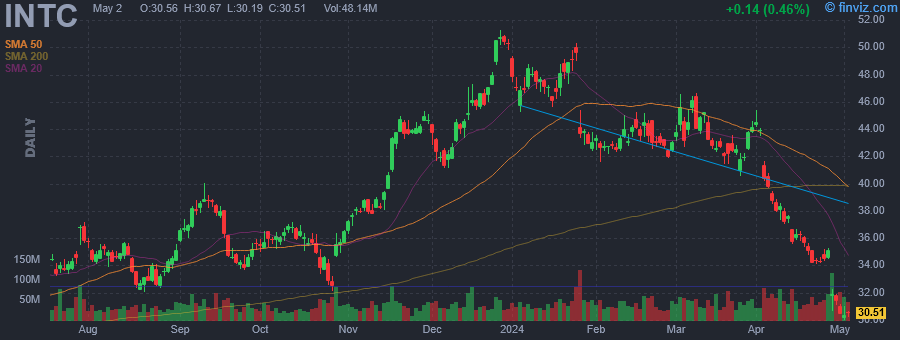
| May-16-24 | Upgrade |
Wolfe Research |
Underperform → Peer Perform |
|
|
|
|
Intel Corp. engages in the design, manufacture, and sale of computer products and technologies. It delivers computer, networking, data storage, and communications platforms. The firm operates through the following segments: Client Computing Group (CCG), Data Center and AI (DCAI), Network and Edge (NEX), Mobileye, Accelerated Computing Systems and Graphics (AXG), Intel Foundry Services (IFS), and All Other. The CCG segment consists of platforms designed for notebooks, 2-in-1 systems, desktops, tablets, phones, wireless and wired connectivity products, and mobile communication components. The DCAI segment delivers solutions to cloud service providers and enterprise customers, along with silicon devices for communications service providers and high-performance computing customers. The NEX segment offers computing system solutions from inflexible fixed-function hardware to general-purpose compute, acceleration, and networking devices running cloud native software on programmable hardware. The Mobileye segment develops driving assistance and self-driving solutions. The AXG segment provides products and technologies designed to help customers solve the toughest computational problems. Its products include CPUs for high-performance computing and GPUs targeted for a range of workloads and platforms, from gaming and content creation on client devices to delivering media and gaming in the cloud, and the most demanding high-performance computing and AI workloads on supercomputers. The IFS segment refers to full stack solutions created from the foundry industry ecosystem. The All Other segment represents results from other non-reportable segments and corporate-related charges. The company was founded by Robert Norton Noyce and Gordon Earle Moore on July 18, 1968, and is headquartered in Santa Clara, CA. |
| Insider Trading |
Relationship |
Date |
Transaction |
Cost |
#Shares |
Value ($) |
#Shares Total |
SEC Form 4 |
| GELSINGER PATRICK P | CEO | May 01 '24 | Buy | 30.29 | 4,100 | 124,173 | 39,375 | May 02 04:12 PM | | GELSINGER PATRICK P | CEO | Apr 29 '24 | Buy | 31.42 | 4,000 | 125,674 | 35,275 | May 01 04:05 PM | | GELSINGER PATRICK P | CEO | Feb 01 '24 | Buy | 42.74 | 2,800 | 119,671 | 31,275 | Feb 02 04:27 PM | | GELSINGER PATRICK P | CEO | Jan 29 '24 | Buy | 43.36 | 3,000 | 130,083 | 28,475 | Jan 30 04:56 PM | | GELSINGER PATRICK P | CEO | Nov 01 '23 | Buy | 36.80 | 6,775 | 249,333 | 25,475 | Nov 02 05:40 PM |
|
|
|
