 |
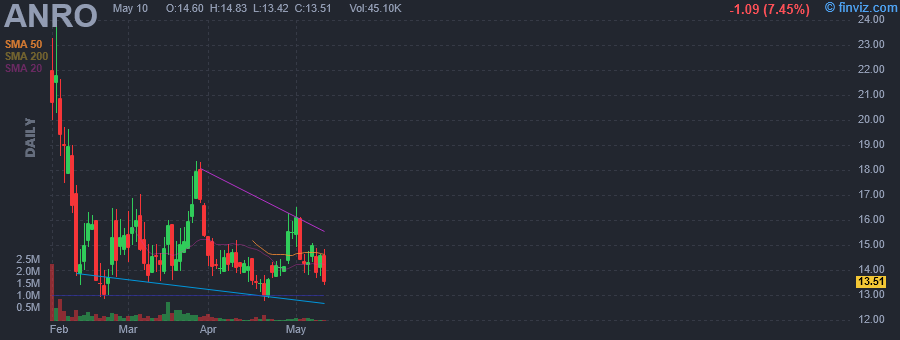
| Market Cap | 335.19M | EPS (ttm) | - |
| P/E | - | EPS this Y | 71.03% |
| Forward P/E | - | EPS next Y | -10.42% |
| PEG | - | EPS past 5Y | - |
| P/S | - | EPS next 5Y | - |
| P/B | 1.74 | EPS Q/Q | - |
| Dividend | - | Sales Q/Q | - |
| Insider Own | 17.15% | Inst Own | 60.20% |
| Insider Trans | 15.77% | Inst Trans | - |
| Short Float | 11.25% | Earnings | May 14/a |
| Analyst Recom | 1.17 | Target Price | 35.55 |
| Avg Volume | 174.28K | 52W Range | 12.40 - 24.00 |
|
|
|
|
Alto Neuroscience, Inc. is a clinical-stage biopharmaceutical company, which engages in the development of psychiatric drugs. Its pipeline is composed of five clinical-stage assets which initially target depressive disorder and schizophrenia population. The company was founded by Amit Etkin, Dan Segal, and Wei Wu on March 25, 2019 and is headquartered in Los Altos, CA. |
| Insider Trading |
Relationship |
Date |
Transaction |
Cost |
#Shares |
Value ($) |
#Shares Total |
SEC Form 4 |
| Smith Nicholas Conrad | CHIEF FINANCIAL OFFICER | Mar 28 '24 | Buy | 16.36 | 6,150 | 100,628 | 26,866 | Apr 01 04:15 PM | | Alpha Wave Global, LP | 10% Owner | Feb 06 '24 | Buy | 16.00 | 600,000 | 9,600,000 | 3,707,757 | Feb 08 04:32 PM | | Savitz Adam | CHIEF MEDICAL OFFICER | Feb 06 '24 | Buy | 16.00 | 17,000 | 272,000 | 24,851 | Feb 07 04:38 PM | | Etkin Amit | PRESIDENT AND CEO | Feb 06 '24 | Buy | 16.00 | 3,125 | 50,000 | 1,205,465 | Feb 07 04:36 PM | | Smith Nicholas Conrad | CHIEF FINANCIAL OFFICER | Feb 06 '24 | Buy | 16.00 | 1,563 | 25,008 | 1,563 | Feb 07 04:40 PM |
|
|
 |
 |
| Market Cap | 358.29M | EPS (ttm) | 0.80 |
| P/E | 12.76 | EPS this Y | - |
| Forward P/E | - | EPS next Y | - |
| PEG | - | EPS past 5Y | -1.81% |
| P/S | 0.20 | EPS next 5Y | - |
| P/B | 1.08 | EPS Q/Q | 10.43% |
| Dividend | 6.49% | Sales Q/Q | -9.70% |
| Insider Own | 17.77% | Inst Own | 40.42% |
| Insider Trans | 0.00% | Inst Trans | -6.96% |
| Short Float | 0.56% | Earnings | May 01/a |
| Analyst Recom | 1.00 | Target Price | 13.00 |
| Avg Volume | 48.77K | 52W Range | 9.82 - 15.22 |
|
|
|
|
Star Group LP engages in the provision and distribution of home heating oil, propane, and related services to residential and commercial customers. It also sells diesel fuel, gasoline, and home heating oil on a delivery only basis. The company was founded on October 16, 1995 and is headquartered in Stamford, CT. |
| Insider Trading |
Relationship |
Date |
Transaction |
Cost |
#Shares |
Value ($) |
#Shares Total |
SEC Form 4 |
| Bandera Partners LLC | 10% Owner | Jun 15 '23 | Sale | 15.06 | 712 | 10,724 | 3,445,360 | Jun 20 05:20 PM | | Bandera Partners LLC | 10% Owner | Jun 14 '23 | Sale | 15.09 | 15,588 | 235,196 | 3,446,072 | Jun 14 05:36 PM | | Bandera Partners LLC | 10% Owner | Jun 13 '23 | Sale | 15.08 | 2,258 | 34,043 | 3,461,660 | Jun 14 05:36 PM | | Bandera Partners LLC | 10% Owner | Jun 12 '23 | Sale | 15.02 | 1,199 | 18,003 | 3,463,918 | Jun 14 05:36 PM |
|
|
|
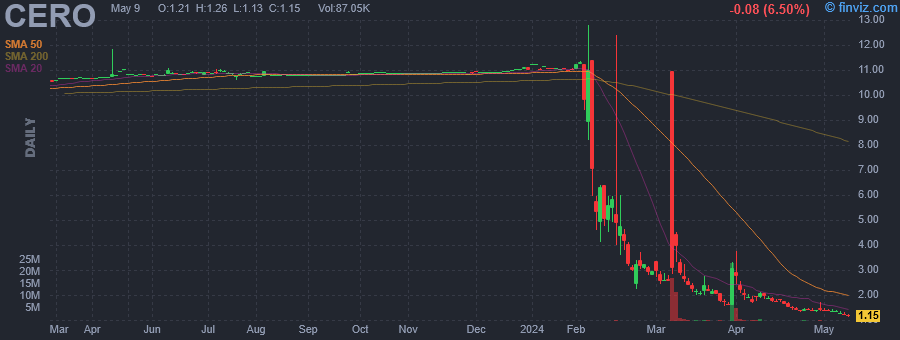 |
| Market Cap | 16.19M | EPS (ttm) | -0.38 |
| P/E | - | EPS this Y | - |
| Forward P/E | - | EPS next Y | - |
| PEG | - | EPS past 5Y | - |
| P/S | - | EPS next 5Y | - |
| P/B | - | EPS Q/Q | -16.75% |
| Dividend | - | Sales Q/Q | - |
| Insider Own | 53.87% | Inst Own | 0.48% |
| Insider Trans | 0.00% | Inst Trans | 6.27% |
| Short Float | 1.01% | Earnings | - |
| Analyst Recom | - | Target Price | - |
| Avg Volume | 1.12M | 52W Range | 1.10 - 12.80 |
|
|
|
|
CERo Therapeutics Holdings, Inc. is a blank check company, formed for the purpose of effecting a merger, capital stock exchange, asset acquisition, stock purchase, reorganization or similar business combination with one or more businesses. The company was founded on June 8, 2021 and is headquartered in Oakland, CA. |
|
| |
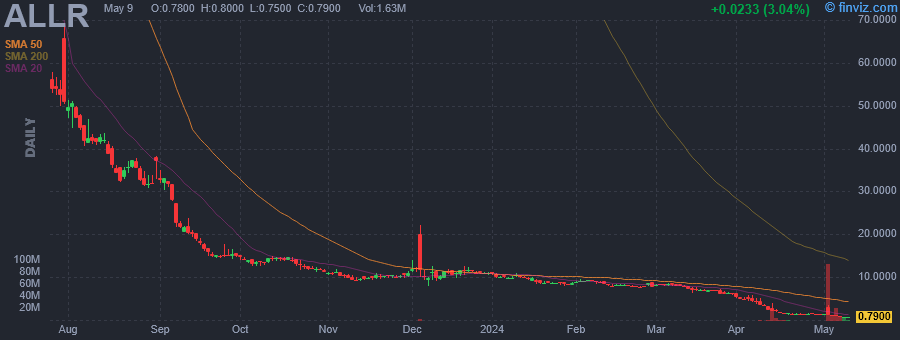 |
| Market Cap | 11.25M | EPS (ttm) | -599.49 |
| P/E | - | EPS this Y | 98.73% |
| Forward P/E | - | EPS next Y | 40.00% |
| PEG | - | EPS past 5Y | 57.56% |
| P/S | - | EPS next 5Y | - |
| P/B | - | EPS Q/Q | 99.34% |
| Dividend | - | Sales Q/Q | - |
| Insider Own | 6.95% | Inst Own | 0.02% |
| Insider Trans | 0.00% | Inst Trans | -16.93% |
| Short Float | 1.35% | Earnings | May 14/a |
| Analyst Recom | 1.00 | Target Price | 8.00 |
| Avg Volume | 3.28M | 52W Range | 0.64 - 285.60 |
|
|
|
|
Allarity Therapeutics, Inc. engages in the development of drugs for personalized treatment of cancer guided by its proprietary Drug Response Predictor (DRP) technology. The company operates in two geographic areas: Denmark and the United States. The company was founded on April 4, 2021 and is headquartered in Boston, MA. |
|
|
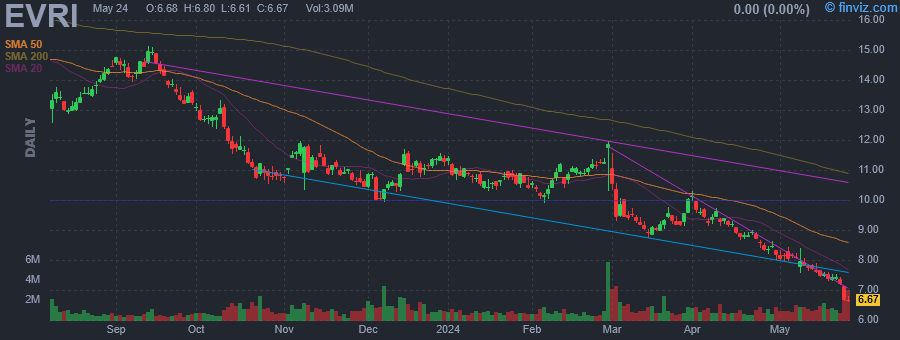 |
| Market Cap | 620.51M | EPS (ttm) | 0.66 |
| P/E | 11.21 | EPS this Y | -18.03% |
| Forward P/E | 7.77 | EPS next Y | 27.32% |
| PEG | 0.56 | EPS past 5Y | 40.40% |
| P/S | 0.77 | EPS next 5Y | 20.00% |
| P/B | 2.67 | EPS Q/Q | -82.37% |
| Dividend | 2.71% | Sales Q/Q | -6.64% |
| Insider Own | 3.10% | Inst Own | 91.26% |
| Insider Trans | -5.38% | Inst Trans | -1.68% |
| Short Float | 4.61% | Earnings | May 08/b |
| Analyst Recom | 2.00 | Target Price | 12.00 |
| Avg Volume | 1.21M | 52W Range | 7.43 - 16.08 |
|
|
|
|
Everi Holdings, Inc. engages in the provision of technology solutions to the casino, interactive, and gaming industry. It operates through the Games and Financial Technology Solutions (FinTech) segments. The Games segment focuses on leased gaming equipment, sales of gaming equipment, gaming systems, interactive solutions, and ancillary products and services. The FinTech segment provides access to cash at gaming facilities via ATM cash withdrawals, credit card cash access transactions and point of sale debit card cash access transactions, check-related services, fully integrated kiosks and maintenance services, compliance, audit and data software, casino credit data, and reporting services and other ancillary offerings. The company was founded on February 4, 2004 and is headquartered in Las Vegas, NV. |
| Insider Trading |
Relationship |
Date |
Transaction |
Cost |
#Shares |
Value ($) |
#Shares Total |
SEC Form 4 |
| TAYLOR RANDY L | President & CEO | May 14 '24 | Sale | 7.65 | 28,713 | 219,634 | 585,281 | May 14 09:03 PM | | EHRLICH DEAN A | EVP, Games Business Leader | May 14 '24 | Sale | 7.67 | 6,337 | 48,613 | 163,622 | May 14 09:05 PM | | Labay Mark F. | EVP, CFO | May 14 '24 | Sale | 7.68 | 5,120 | 39,332 | 159,660 | May 14 09:04 PM | | Rumbolz Michael D | Executive Chairman | May 14 '24 | Sale | 7.60 | 5,040 | 38,304 | 1,082,062 | May 14 09:04 PM | | Lowenhar-Fisher Kate C. | EVP, Chief Legal Officer | May 14 '24 | Sale | 7.65 | 4,742 | 36,279 | 50,151 | May 14 09:05 PM |
|
|
| |
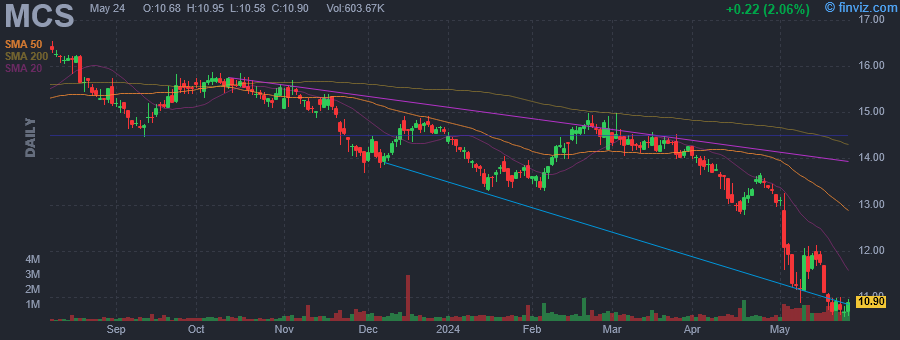 |
| Market Cap | 342.91M | EPS (ttm) | 0.20 |
| P/E | 53.20 | EPS this Y | -61.96% |
| Forward P/E | 23.44 | EPS next Y | 165.71% |
| PEG | 3.55 | EPS past 5Y | -27.96% |
| P/S | 0.48 | EPS next 5Y | 15.00% |
| P/B | 0.75 | EPS Q/Q | -25.82% |
| Dividend | 1.83% | Sales Q/Q | -9.02% |
| Insider Own | 24.77% | Inst Own | 95.09% |
| Insider Trans | 0.00% | Inst Trans | 1.29% |
| Short Float | 22.48% | Earnings | May 02/b |
| Analyst Recom | 1.00 | Target Price | 19.00 |
| Avg Volume | 486.26K | 52W Range | 10.87 - 16.75 |
|
|
|
|
Marcus Corp. engages in the lodging and entertainment industries. It operates through the following business segments: Theatres and Hotels & Resorts. The Theatres segment includes multiscreen motion picture theatres and a family entertainment center. The Hotels & Resorts segment owns and operates full service hotels and resorts. The company was founded by Ben Marcus on November 1, 1935 and is headquartered in Milwaukee, WI. |
| Insider Trading |
Relationship |
Date |
Transaction |
Cost |
#Shares |
Value ($) |
#Shares Total |
SEC Form 4 |
| Marcus Gregory S | President and CEO | Jul 25 '23 | Option Exercise | 13.04 | 57,500 | 749,800 | 248,368 | Jul 28 09:43 AM | | GERSHOWITZ DIANE M | Director | May 30 '23 | Option Exercise | 13.45 | 1,000 | 13,450 | 33,374 | May 31 05:07 PM | | SELIG ALLAN H | Director | May 30 '23 | Option Exercise | 13.45 | 1,000 | 13,450 | 49,989 | May 31 05:11 PM | | STARK BRIAN JAY | Director | May 24 '23 | Option Exercise | 13.45 | 1,000 | 13,450 | 31,880 | May 26 05:59 PM |
|
|
|
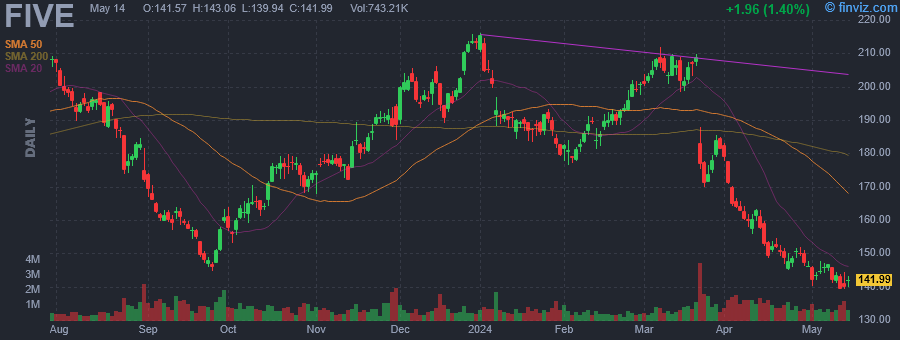 |
| Market Cap | 7.59B | EPS (ttm) | 5.43 |
| P/E | 25.35 | EPS this Y | 11.53% |
| Forward P/E | 19.21 | EPS next Y | 18.69% |
| PEG | 1.31 | EPS past 5Y | 15.26% |
| P/S | 2.13 | EPS next 5Y | 19.33% |
| P/B | 4.79 | EPS Q/Q | 18.99% |
| Dividend | - | Sales Q/Q | 19.15% |
| Insider Own | 2.67% | Inst Own | 106.81% |
| Insider Trans | -0.67% | Inst Trans | 0.51% |
| Short Float | 5.00% | Earnings | Jun 05/a |
| Analyst Recom | 1.62 | Target Price | 206.86 |
| Avg Volume | 954.73K | 52W Range | 139.16 - 216.18 |
|
|
|
|
Five Below, Inc. operates as a specialty value retailer. It operates through the following segments: Leisure, Fashion and Home, and Party and Snack. The Leisure segment includes items such as sporting goods, games, toys, tech, books, electronic accessories, and arts and crafts. The Fashion and Home segment consists of personal accessories, "attitude" t-shirts, beauty offerings, home goods, and storage options. The Party and Snack segment offers party and seasonal goods, greeting cards, candy, and other snacks and beverages. The company was founded by David Schlessinger and Thomas G. Vellios in January 2002 and is headquartered in Philadelphia, PA. |
| Insider Trading |
Relationship |
Date |
Transaction |
Cost |
#Shares |
Value ($) |
#Shares Total |
SEC Form 4 |
| Vellios Thomas | Director | Jan 19 '24 | Sale | 185.82 | 10,000 | 1,858,225 | 333,697 | Jan 23 04:09 PM | | Anderson Joel D | President & CEO | Sep 08 '23 | Buy | 161.50 | 3,100 | 500,650 | 99,656 | Sep 12 04:46 PM | | SARGENT RONALD | Director | Jun 07 '23 | Sale | 193.03 | 55 | 10,617 | 93,619 | Jun 15 04:18 PM |
|
|
| |
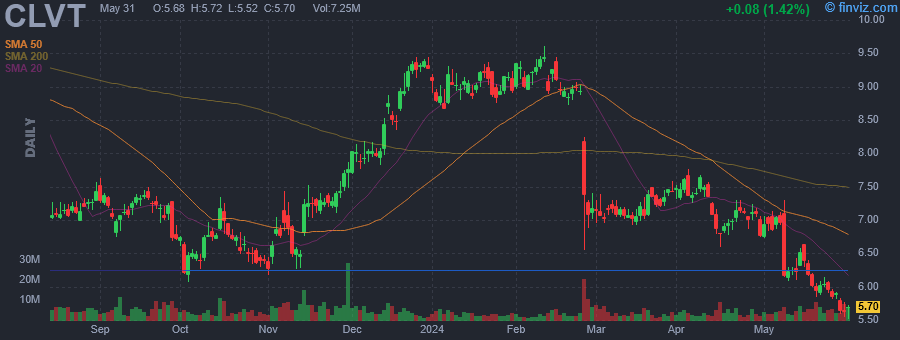 |
| Market Cap | 4.02B | EPS (ttm) | -1.66 |
| P/E | - | EPS this Y | -10.33% |
| Forward P/E | 7.55 | EPS next Y | 8.23% |
| PEG | - | EPS past 5Y | 60.20% |
| P/S | 1.53 | EPS next 5Y | 1.30% |
| P/B | 0.89 | EPS Q/Q | -486.26% |
| Dividend | - | Sales Q/Q | -1.26% |
| Insider Own | 44.61% | Inst Own | 64.38% |
| Insider Trans | 0.00% | Inst Trans | -4.94% |
| Short Float | 11.84% | Earnings | May 08/b |
| Analyst Recom | 2.27 | Target Price | 7.94 |
| Avg Volume | 4.56M | 52W Range | 6.07 - 10.03 |
|
|
|
|
Clarivate Plc engages in the provision of global information, analytics, and workflow solutions. It operates through the following segments: Academia and Government (A&G), Intellectual Property (IP), and Life Sciences and Healthcare (LS&H). The A&G segment involves the provision of research and analytics, content aggregation, and workflow software solutions using artificial intelligence. The IP segment includes the maintenance, intelligence, and management solutions. The LS&H focuses on solutions for research and development, regulatory and safety, and commercialization. The company was founded in 1864 and is headquartered in London, the United Kingdom. |
|
|
 |
| Market Cap | 33.99M | EPS (ttm) | -0.10 |
| P/E | - | EPS this Y | - |
| Forward P/E | - | EPS next Y | - |
| PEG | - | EPS past 5Y | 48.39% |
| P/S | 4.44 | EPS next 5Y | - |
| P/B | 0.34 | EPS Q/Q | 32.87% |
| Dividend | - | Sales Q/Q | 70.39% |
| Insider Own | 76.22% | Inst Own | 2.79% |
| Insider Trans | 9.07% | Inst Trans | -4.86% |
| Short Float | 0.79% | Earnings | Mar 27/a |
| Analyst Recom | 1.00 | Target Price | 4.25 |
| Avg Volume | 28.69K | 52W Range | 0.76 - 1.50 |
|
|
|
|
Allied Gaming & Entertainment, Inc. operates as an experiential entertainment company, which engages in the creation of esports venues and live events for both video games and poker. The company was founded in 2017 and is headquartered in New York, NY. |
| Insider Trading |
Relationship |
Date |
Transaction |
Cost |
#Shares |
Value ($) |
#Shares Total |
SEC Form 4 |
| Knighted Pastures LLC | 10% Owner | Feb 01 '24 | Buy | 1.28 | 110,000 | 141,229 | 8,851,208 | Feb 02 07:07 PM | | Choi Roy | 10% Owner | Feb 01 '24 | Buy | 1.28 | 110,000 | 141,229 | 8,851,208 | Feb 02 07:42 PM | | Knighted Pastures LLC | 10% Owner | Jan 31 '24 | Buy | 1.26 | 159,665 | 201,625 | 8,741,208 | Feb 02 07:07 PM | | Choi Roy | 10% Owner | Jan 31 '24 | Buy | 1.26 | 159,665 | 201,625 | 8,741,208 | Feb 02 07:42 PM | | Knighted Pastures LLC | 10% Owner | Jan 23 '24 | Buy | 1.32 | 100,000 | 132,000 | 8,581,543 | Jan 24 05:42 PM |
|
|
|
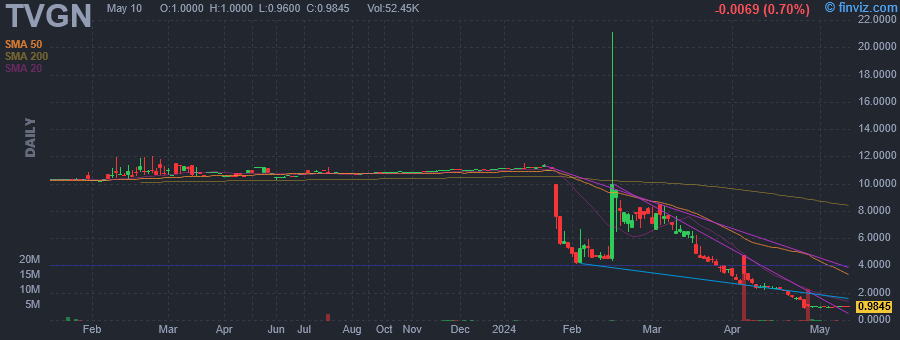 |
| Market Cap | 134.98M | EPS (ttm) | -0.04 |
| P/E | - | EPS this Y | - |
| Forward P/E | - | EPS next Y | - |
| PEG | - | EPS past 5Y | - |
| P/S | - | EPS next 5Y | - |
| P/B | - | EPS Q/Q | -201.83% |
| Dividend | - | Sales Q/Q | - |
| Insider Own | 90.98% | Inst Own | 4.63% |
| Insider Trans | 0.00% | Inst Trans | 0.45% |
| Short Float | 4.58% | Earnings | - |
| Analyst Recom | - | Target Price | - |
| Avg Volume | 991.98K | 52W Range | 0.80 - 21.09 |
|
|
|
|
Tevogen Bio Holdings, Inc. is a clinical-stage specialty immunotherapy company. It develops off-the-shelf therapies for the treatment of infectious diseases, cancers, and neurological disorders. The company was founded on February 14, 2024 and is headquartered in Warren, NJ. |
|
|
