 |
| Market Cap | 11.51B | EPS (ttm) | -3.80 |
| P/E | - | EPS this Y | 38.74% |
| Forward P/E | - | EPS next Y | 48.70% |
| PEG | - | EPS past 5Y | -11.28% |
| P/S | 10.63 | EPS next 5Y | - |
| P/B | 14.71 | EPS Q/Q | 52.15% |
| Dividend | - | Sales Q/Q | 43.20% |
| Insider Own | 6.33% | Inst Own | 90.87% |
| Insider Trans | -15.63% | Inst Trans | 1.75% |
| Short Float | 5.03% | Earnings | May 09/a |
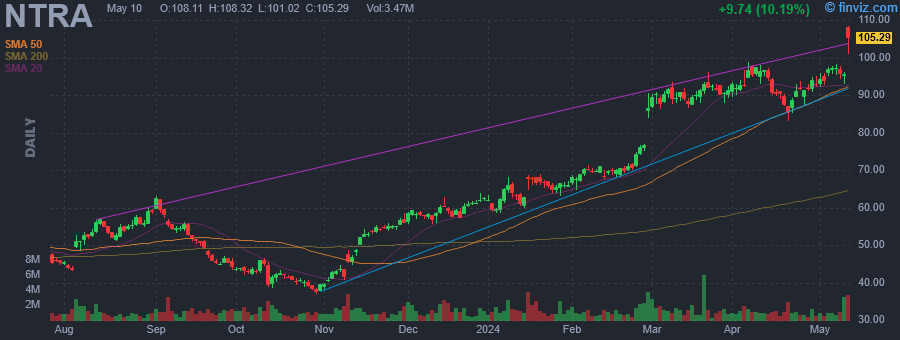
| Analyst Recom | 1.50 | Target Price | 103.89 |
| Avg Volume | 1.39M | 52W Range | 36.90 - 98.82 |
|
|
|
|
Natera, Inc. is a diagnostics company, which engages in the discovery, development, and commercialization of genetic testing services. It provides Panorama non-invasive prenatal test (NIPT), Vistara, horizon carrier screening (HCS), spectrum pre-implantation genetic screening and spectrum pre-implantation genetic diagnosis, Anora products of conception (POC) and non-invasive paternity testing (PAT). The company was founded by Matthew Rabinowitz and Jonathan Sheena in November 2003 and is headquartered in Austin, TX. |
| Insider Trading |
Relationship |
Date |
Transaction |
Cost |
#Shares |
Value ($) |
#Shares Total |
SEC Form 4 |
| Chapman Steven Leonard | CEO AND PRESIDENT | Apr 29 '24 | Sale | 93.14 | 4,084 | 380,378 | 226,235 | May 01 09:05 PM | | Brophy Michael Burkes | CHIEF FINANCIAL OFFICER | Apr 29 '24 | Sale | 93.14 | 1,238 | 115,306 | 69,408 | May 01 09:05 PM | | Moshkevich Solomon | PRESIDENT, CLINICALDIAGNOSTICS | Apr 29 '24 | Sale | 93.14 | 1,196 | 111,394 | 115,833 | May 01 09:05 PM | | RABINOWITZ DANIEL | SEC. AND CHIEF LEGAL OFFICER | Apr 29 '24 | Sale | 93.14 | 1,057 | 98,448 | 204,495 | May 01 09:05 PM | | Fesko John | PRESIDENT, CHIEF BUS. OFFICER | Apr 29 '24 | Sale | 93.14 | 929 | 86,526 | 110,748 | May 01 09:05 PM |
|
|
 |
 |
| Market Cap | 26.18B | EPS (ttm) | -0.80 |
| P/E | - | EPS this Y | 36.39% |
| Forward P/E | - | EPS next Y | 41.46% |
| PEG | - | EPS past 5Y | 3.22% |
| P/S | 5.44 | EPS next 5Y | - |
| P/B | 12.23 | EPS Q/Q | 10.88% |
| Dividend | - | Sales Q/Q | 20.85% |
| Insider Own | 36.88% | Inst Own | 48.16% |
| Insider Trans | -0.32% | Inst Trans | -11.90% |
| Short Float | 7.96% | Earnings | Apr 25/a |
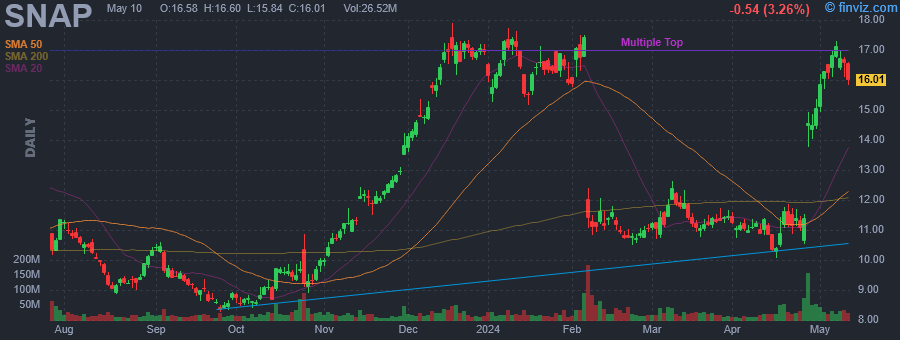
| Analyst Recom | 2.67 | Target Price | 14.85 |
| Avg Volume | 35.45M | 52W Range | 7.86 - 17.90 |
|
|
|
|
Snap, Inc. is a technology company. It engages in the provision of a visual messaging application that was created to help people communicate through short videos and images. The company was founded by Frank Reginald Brown IV, Evan Thomas Spiegel, and Robert C. Murphy in 2010 and is headquartered in Santa Monica, CA. |
| Insider Trading |
Relationship |
Date |
Transaction |
Cost |
#Shares |
Value ($) |
#Shares Total |
SEC Form 4 |
| Murphy Robert C. | Chief Technology Officer | Apr 29 '24 | Sale | 14.27 | 1,000,000 | 14,274,500 | 59,894,865 | May 01 09:00 PM | | Spiegel Evan | Chief Executive Officer | Apr 29 '24 | Sale | 14.35 | 150,000 | 2,153,025 | 3,477,844 | May 01 09:00 PM | | Morrow Rebecca | CAO | Apr 16 '24 | Sale | 10.19 | 428 | 4,362 | 492,656 | Apr 18 07:00 PM | | O'Sullivan Michael J. | General Counsel | Mar 28 '24 | Sale | 11.53 | 18,000 | 207,594 | 474,812 | Apr 01 07:00 PM | | Andersen Derek | Chief Financial Officer | Mar 18 '24 | Sale | 10.99 | 96,953 | 1,065,979 | 2,534,689 | Mar 20 07:00 PM |
|
|
|
 |
| Market Cap | 47.63M | EPS (ttm) | -2.44 |
| P/E | - | EPS this Y | -1.07% |
| Forward P/E | - | EPS next Y | -18.00% |
| PEG | - | EPS past 5Y | 11.87% |
| P/S | 1.96 | EPS next 5Y | - |
| P/B | 0.45 | EPS Q/Q | -16.38% |
| Dividend | - | Sales Q/Q | 21.03% |
| Insider Own | 28.99% | Inst Own | 41.20% |
| Insider Trans | -3.92% | Inst Trans | 13.61% |
| Short Float | 6.31% | Earnings | Mar 13/b |
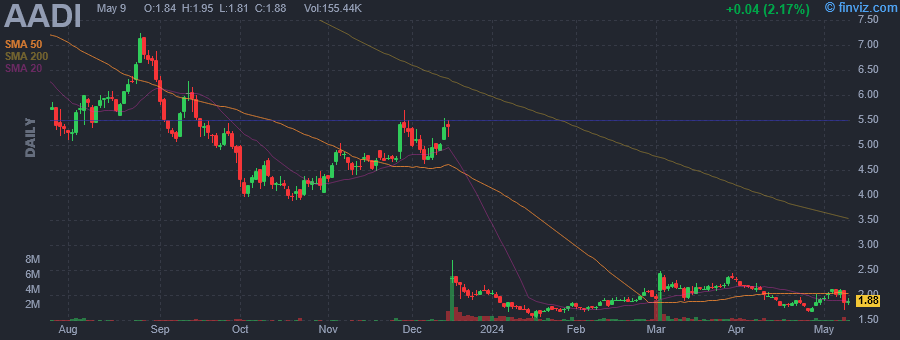
| Analyst Recom | 1.40 | Target Price | 11.67 |
| Avg Volume | 349.59K | 52W Range | 1.55 - 8.60 |
|
|
|
|
Aadi Bioscience, Inc. operates as a clinical-stage biopharmaceutical company. It develops precision therapies for genetically-defined cancer patients with mTOR pathway driver alterations such as alterations in TSC1 or TSC2 genes. The company was founded by Neil Desai in November 2007 and is headquartered in Los Angeles, CA. |
| Insider Trading |
Relationship |
Date |
Transaction |
Cost |
#Shares |
Value ($) |
#Shares Total |
SEC Form 4 |
| Desai Neil | EXECUTIVE CHAIRMAN | May 01 '24 | Sale | 1.93 | 40,000 | 77,184 | 1,331,543 | May 01 08:50 PM | | Desai Neil | EXECUTIVE CHAIRMAN | Apr 02 '24 | Sale | 2.23 | 22,228 | 49,513 | 1,371,543 | Apr 03 04:49 PM | | Desai Neil | EXECUTIVE CHAIRMAN | Apr 01 '24 | Sale | 2.31 | 17,772 | 41,101 | 1,393,771 | Apr 03 04:49 PM | | Desai Neil | EXECUTIVE CHAIRMAN | Mar 04 '24 | Sale | 2.10 | 14,964 | 31,415 | 1,411,543 | Mar 04 07:22 PM | | Desai Neil | EXECUTIVE CHAIRMAN | Mar 01 '24 | Sale | 1.97 | 27,036 | 53,226 | 1,426,507 | Mar 04 07:22 PM |
|
|
| |
 |
| Market Cap | 1.54B | EPS (ttm) | -0.30 |
| P/E | - | EPS this Y | -53.23% |
| Forward P/E | 158.74 | EPS next Y | 109.06% |
| PEG | - | EPS past 5Y | 28.61% |
| P/S | 12.36 | EPS next 5Y | 30.00% |
| P/B | 9.21 | EPS Q/Q | -324.64% |
| Dividend | - | Sales Q/Q | -22.22% |
| Insider Own | 3.86% | Inst Own | 59.57% |
| Insider Trans | -6.38% | Inst Trans | 50.07% |
| Short Float | 15.17% | Earnings | May 02/a |
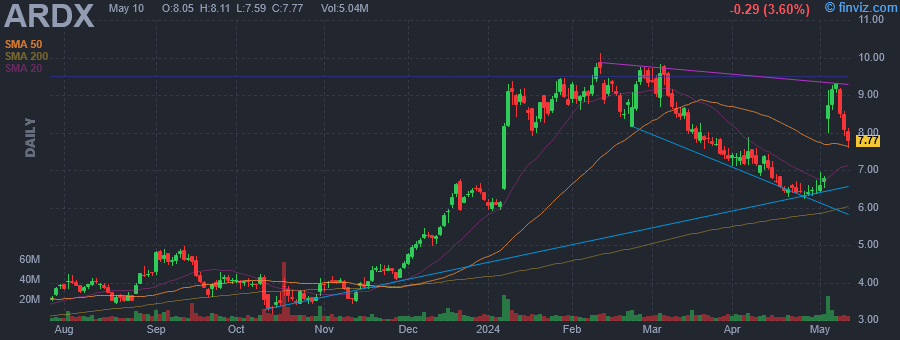
| Analyst Recom | 1.00 | Target Price | 13.39 |
| Avg Volume | 5.53M | 52W Range | 3.16 - 10.13 |
|
|
|
|
Ardelyx, Inc. is a biopharmaceutical company, which engages in the business of developing and commercializing biopharmaceutical products. The firm is also involved in developing a unique and innovative platform that enables the discovery of new biological mechanisms and pathways to develop potent and efficacious therapies that minimize the side effects and drug-drug interactions frequently encountered with traditional, systemically absorbed medicines. The company was founded by Dominique Charmot, Peter G. Schultz, and Jean M. Frechet in October 2007 and is headquartered in Waltham, MA. |
| Insider Trading |
Relationship |
Date |
Transaction |
Cost |
#Shares |
Value ($) |
#Shares Total |
SEC Form 4 |
| RAAB MICHAEL | President & CEO | Apr 29 '24 | Option Exercise | 0.99 | 30,000 | 29,700 | 1,340,933 | May 01 07:59 PM | | RAAB MICHAEL | President & CEO | Apr 29 '24 | Sale | 6.40 | 30,000 | 192,057 | 1,310,933 | May 01 07:59 PM | | RAAB MICHAEL | President & CEO | Apr 15 '24 | Sale | 7.06 | 7,500 | 52,924 | 1,310,933 | Apr 17 04:20 PM | | RAAB MICHAEL | President & CEO | Apr 01 '24 | Sale | 7.31 | 1,518 | 11,097 | 1,318,433 | Apr 02 04:05 PM | | GRAMMER ELIZABETH A | See Remarks | Mar 20 '24 | Sale | 7.73 | 86,000 | 664,978 | 312,993 | Mar 22 04:42 PM |
|
|
|
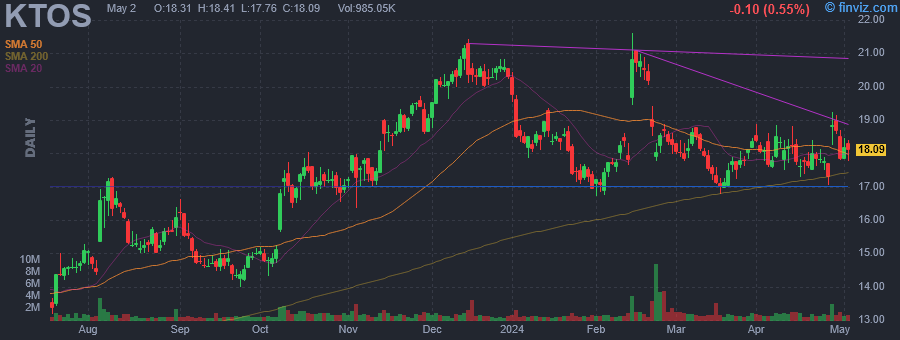 |
| Market Cap | 2.71B | EPS (ttm) | -0.07 |
| P/E | - | EPS this Y | -2.38% |
| Forward P/E | 34.26 | EPS next Y | 29.49% |
| PEG | - | EPS past 5Y | -15.14% |
| P/S | 2.62 | EPS next 5Y | 2.00% |
| P/B | 2.41 | EPS Q/Q | 127.45% |
| Dividend | - | Sales Q/Q | 9.83% |
| Insider Own | 2.44% | Inst Own | 76.73% |
| Insider Trans | -3.68% | Inst Trans | -2.55% |
| Short Float | 2.09% | Earnings | May 07/a |
| Analyst Recom | 1.64 | Target Price | 22.45 |
| Avg Volume | 1.48M | 52W Range | 12.12 - 21.60 |
|
|
|
|
Kratos Defense & Security Solutions, Inc. engages in the provision of mission critical products, services and solutions for United States national security priorities. It operates through the Kratos Government Solutions (KGS) and Unmanned Systems (US) segments. The KGS segment consists of an aggregation of KGS operating segments, including microwave electronic products, space, satellite and cyber, training solutions. The US segment refers to the unmanned aerial, unmanned ground, unmanned seaborne and related command, control and communications system businesses. The company was founded on December 19, 1994, and is headquartered in Round Rock, TX. |
| Insider Trading |
Relationship |
Date |
Transaction |
Cost |
#Shares |
Value ($) |
#Shares Total |
SEC Form 4 |
| Fendley Steven S. | President, US Division | Apr 29 '24 | Sale | 18.76 | 7,000 | 131,300 | 423,098 | May 01 07:43 PM | | Carrai Phillip D | President, STC Division | Apr 15 '24 | Sale | 18.19 | 3,500 | 63,652 | 290,118 | Apr 17 07:50 PM | | Mendoza Marie | SVP & General Counsel | Apr 15 '24 | Sale | 18.18 | 1,500 | 27,271 | 67,030 | Apr 17 07:58 PM | | Fendley Steven S. | President, US Division | Apr 05 '24 | Option Exercise | 0.00 | 13,333 | 0 | 435,234 | Apr 08 07:11 PM | | Fendley Steven S. | President, US Division | Apr 04 '24 | Option Exercise | 0.00 | 3,333 | 0 | 423,193 | Apr 08 07:11 PM |
|
|
| |
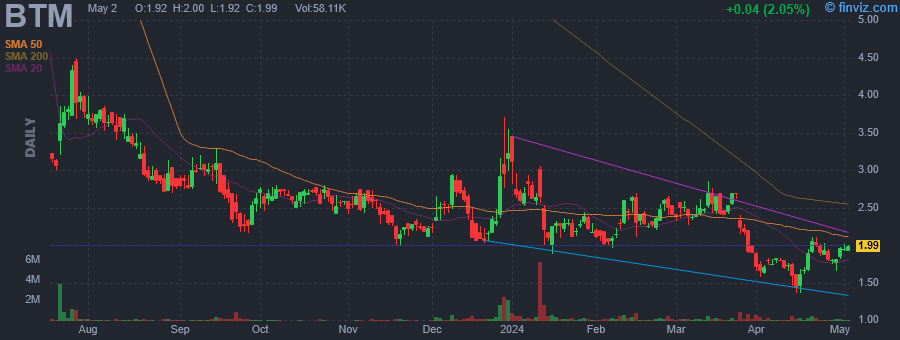 |
| Market Cap | 34.24M | EPS (ttm) | -0.92 |
| P/E | - | EPS this Y | 124.07% |
| Forward P/E | 6.00 | EPS next Y | 150.00% |
| PEG | - | EPS past 5Y | - |
| P/S | 0.07 | EPS next 5Y | - |
| P/B | - | EPS Q/Q | -2133.66% |
| Dividend | - | Sales Q/Q | - |
| Insider Own | 78.39% | Inst Own | 27.58% |
| Insider Trans | -18.78% | Inst Trans | 13.21% |
| Short Float | 11.50% | Earnings | Mar 25/b |
| Analyst Recom | 1.50 | Target Price | 4.56 |
| Avg Volume | 246.91K | 52W Range | 1.36 - 10.85 |
|
|
|
|
Bitcoin Depot Inc. engages in converting cash into crypto currency. It offers payments, spending, and investing space through its kiosks and BDCheckout product. The company was founded by Brandon Mintz in July 2016 and is headquartered in Atlanta, GA. |
| Insider Trading |
Relationship |
Date |
Transaction |
Cost |
#Shares |
Value ($) |
#Shares Total |
SEC Form 4 |
| Buchanan Christopher Scott | Chief Operating Officer | Apr 29 '24 | Sale | 1.75 | 50,000 | 87,655 | 351,276 | May 01 07:29 PM | | Mintz Brandon Taylor | See Remarks | Apr 24 '24 | Sale | 1.72 | 2,906,976 | 4,999,999 | 0 | Apr 26 07:50 PM | | Mintz Brandon Taylor | See Remarks | Apr 01 '24 | Sale | 1.73 | 50,000 | 86,325 | 696,702 | Apr 03 09:27 PM | | Mintz Brandon Taylor | See Remarks | Mar 28 '24 | Sale | 1.96 | 12,865 | 25,214 | 746,702 | Mar 29 03:44 PM | | Mintz Brandon Taylor | See Remarks | Mar 27 '24 | Sale | 1.99 | 62,865 | 124,900 | 759,567 | Mar 29 03:44 PM |
|
|
|
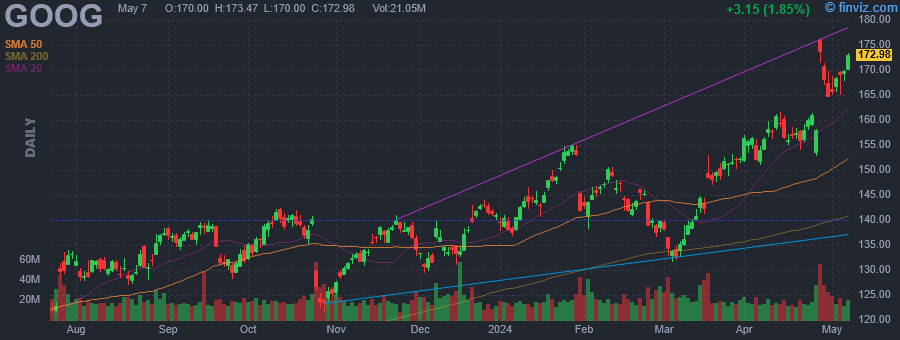 |
| Market Cap | 2048.50B | EPS (ttm) | 6.52 |
| P/E | 25.39 | EPS this Y | 28.30% |
| Forward P/E | 19.51 | EPS next Y | 14.02% |
| PEG | 1.32 | EPS past 5Y | 21.56% |
| P/S | 6.44 | EPS next 5Y | 19.23% |
| P/B | 7.00 | EPS Q/Q | 60.92% |
| Dividend | 0.20% | Sales Q/Q | 15.44% |
| Insider Own | 57.70% | Inst Own | 27.93% |
| Insider Trans | -0.01% | Inst Trans | - |
| Short Float | 0.71% | Earnings | Apr 25/a |
| Analyst Recom | 1.59 | Target Price | 188.31 |
| Avg Volume | 24.04M | 52W Range | 104.50 - 176.42 |
|
|
|
|
Alphabet, Inc. is a holding company, which engages in software, health care, transportation, and other technologies. It operates through the following segments: Google Services, Google Cloud, and Other Bets. The Google Services segment includes products and services such as ads, Android, Chrome, devices, Google Maps, Google Play, Search, and YouTube. The Google Cloud segment refers to infrastructure and platform services, collaboration tools, and other services for enterprise customers. The Other Bets segment relates to the sale of healthcare-related services and internet services. The company was founded by Lawrence E. Page and Sergey Mikhaylovich Brin on October 2, 2015 and is headquartered in Mountain View, CA. |
| Insider Trading |
Relationship |
Date |
Transaction |
Cost |
#Shares |
Value ($) |
#Shares Total |
SEC Form 4 |
| Pichai Sundar | Chief Executive Officer | May 01 '24 | Sale | 166.80 | 22,500 | 3,753,101 | 2,280,511 | May 01 07:29 PM | | ARNOLD FRANCES | Director | Apr 30 '24 | Sale | 167.38 | 80 | 13,390 | 15,551 | Apr 30 05:59 PM | | HENNESSY JOHN L | Director | Apr 26 '24 | Sale | 175.76 | 2,100 | 369,096 | 5,891 | Apr 26 06:53 PM | | Pichai Sundar | Chief Executive Officer | Apr 17 '24 | Sale | 157.41 | 22,500 | 3,541,763 | 2,303,011 | Apr 17 07:30 PM | | HENNESSY JOHN L | Director | Apr 12 '24 | Sale | 159.56 | 800 | 127,648 | 7,991 | Apr 15 08:17 PM |
|
|
| |
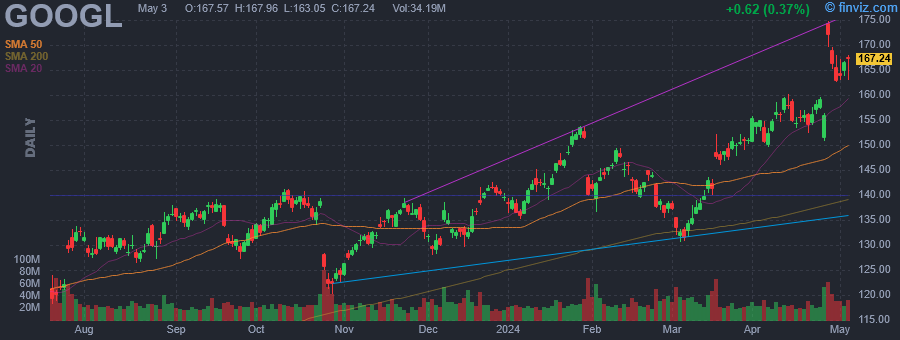 |
| Market Cap | 2027.34B | EPS (ttm) | 6.52 |
| P/E | 25.13 | EPS this Y | 28.36% |
| Forward P/E | 19.31 | EPS next Y | 13.96% |
| PEG | 1.31 | EPS past 5Y | 21.56% |
| P/S | 6.38 | EPS next 5Y | 19.23% |
| P/B | 6.93 | EPS Q/Q | 60.92% |
| Dividend | 0.18% | Sales Q/Q | 15.44% |
| Insider Own | 52.67% | Inst Own | 37.87% |
| Insider Trans | -0.01% | Inst Trans | -0.22% |
| Short Float | 1.00% | Earnings | Apr 25/a |
| Analyst Recom | 1.58 | Target Price | 188.34 |
| Avg Volume | 32.57M | 52W Range | 103.71 - 174.71 |
|
|
|
|
Alphabet, Inc. is a holding company, which engages in software, health care, transportation, and other technologies. It operates through the following segments: Google Services, Google Cloud, and Other Bets. The Google Services segment includes products and services such as ads, Android, Chrome, devices, Google Maps, Google Play, Search, and YouTube. The Google Cloud segment refers to infrastructure and platform services, collaboration tools, and other services for enterprise customers. The Other Bets segment relates to the sale of healthcare-related services and internet services. The company was founded by Lawrence E. Page and Sergey Mikhaylovich Brin on October 2, 2015 and is headquartered in Mountain View, CA. |
| Insider Trading |
Relationship |
Date |
Transaction |
Cost |
#Shares |
Value ($) |
#Shares Total |
SEC Form 4 |
| Pichai Sundar | Chief Executive Officer | May 01 '24 | Sale | 166.80 | 22,500 | 3,753,101 | 2,280,511 | May 01 07:29 PM | | ARNOLD FRANCES | Director | Apr 30 '24 | Sale | 167.38 | 80 | 13,390 | 15,551 | Apr 30 05:59 PM | | HENNESSY JOHN L | Director | Apr 26 '24 | Sale | 175.76 | 2,100 | 369,096 | 5,891 | Apr 26 06:53 PM | | Pichai Sundar | Chief Executive Officer | Apr 17 '24 | Sale | 157.41 | 22,500 | 3,541,763 | 2,303,011 | Apr 17 07:30 PM | | HENNESSY JOHN L | Director | Apr 12 '24 | Sale | 159.56 | 800 | 127,648 | 7,991 | Apr 15 08:17 PM |
|
|
|
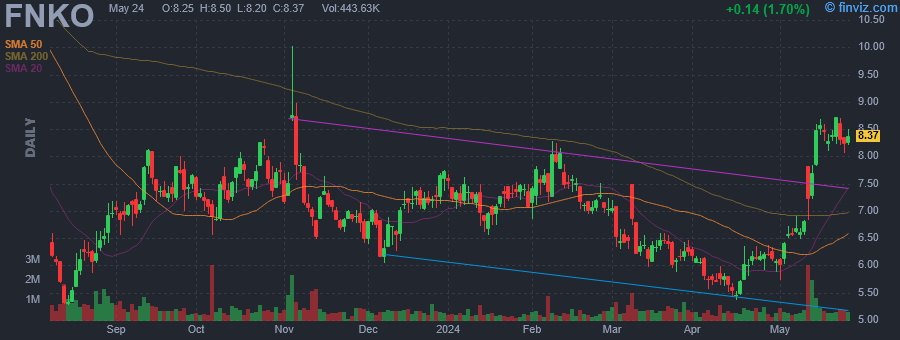 |
| Market Cap | 308.13M | EPS (ttm) | -3.23 |
| P/E | - | EPS this Y | 83.33% |
| Forward P/E | 17.17 | EPS next Y | 341.38% |
| PEG | - | EPS past 5Y | - |
| P/S | 0.28 | EPS next 5Y | 19.40% |
| P/B | 1.31 | EPS Q/Q | 76.13% |
| Dividend | - | Sales Q/Q | -12.55% |
| Insider Own | 39.06% | Inst Own | 62.77% |
| Insider Trans | -0.23% | Inst Trans | 5.22% |
| Short Float | 14.85% | Earnings | May 09/a |
| Analyst Recom | 2.50 | Target Price | 8.62 |
| Avg Volume | 493.18K | 52W Range | 5.27 - 13.42 |
|
|
|
|
Funko, Inc. engages in designing, sourcing, and distributing licensed pop culture products. Its product lines include media and entertainment content, which refer to movies, TV shows, video games, music, and sports. It operates through the United States, Europe, and Other International geographic segments. The company was founded in 1998 and is headquartered in Everett, WA. |
| Insider Trading |
Relationship |
Date |
Transaction |
Cost |
#Shares |
Value ($) |
#Shares Total |
SEC Form 4 |
| Daw Tracy D | CHIEF LEGAL OFFICER | Apr 30 '24 | Sale | 6.06 | 3,755 | 22,762 | 62,425 | May 01 07:24 PM | | Oddie Andrew David | CHIEF COMMERCIAL OFFICER | Apr 30 '24 | Sale | 5.97 | 3,730 | 22,255 | 64,060 | May 01 07:22 PM | | Le Pendeven Yves | Acting CFO | Apr 30 '24 | Sale | 5.95 | 88 | 523 | 28,848 | May 01 07:20 PM | | Le Pendeven Yves | Acting CFO | Apr 29 '24 | Option Exercise | 0.00 | 317 | 0 | 28,936 | May 01 07:20 PM | | Oddie Andrew David | CHIEF COMMERCIAL OFFICER | Apr 29 '24 | Option Exercise | 0.00 | 7,314 | 0 | 67,790 | May 01 07:22 PM |
|
|
|
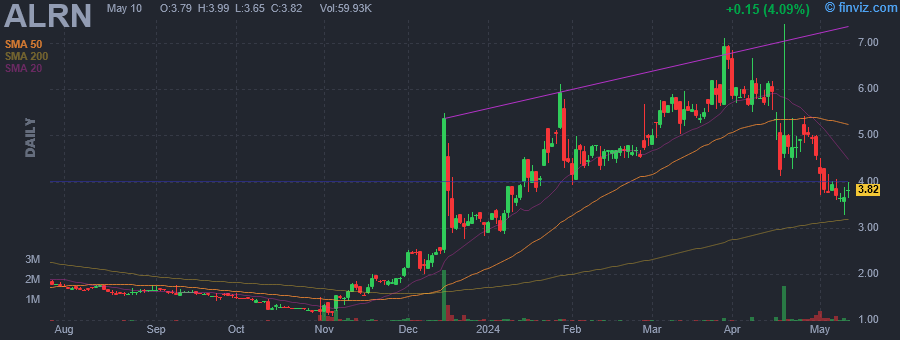 |
| Market Cap | 70.18M | EPS (ttm) | -3.39 |
| P/E | - | EPS this Y | 81.87% |
| Forward P/E | - | EPS next Y | -191.94% |
| PEG | - | EPS past 5Y | 39.67% |
| P/S | - | EPS next 5Y | 2.10% |
| P/B | 2.95 | EPS Q/Q | -53.67% |
| Dividend | - | Sales Q/Q | - |
| Insider Own | 18.15% | Inst Own | 12.12% |
| Insider Trans | -0.84% | Inst Trans | -3.46% |
| Short Float | 0.31% | Earnings | Apr 15/a |
| Analyst Recom | 1.00 | Target Price | 19.00 |
| Avg Volume | 72.12K | 52W Range | 1.01 - 7.42 |
|
|
|
|
Aileron Therapeutics, Inc. is a clinical stage biopharmaceutical company, which engages in the development and commercialization of a novel class of therapeutics for the treatment of cancer and other diseases. It focuses on its lead product candidate, ALRN-6924, which is a cell-permeating peptide that disrupts the interaction of p53 suppressors MDM2 and MDMX with tumor suppressor p53 to reactivate tumor suppression in non-mutant, or wild-type, p53 cancers. The company was founded by Gregory L. Verdine, Rosana Kapeller, Huw M. Nash, Joseph A. Yanchik III, and Loren David Walensky on August 6, 2001 and is headquartered in Austin, TX. |
| Insider Trading |
Relationship |
Date |
Transaction |
Cost |
#Shares |
Value ($) |
#Shares Total |
SEC Form 4 |
| UNIVERSITY OF TEXAS/TEXAS AM I | 10% Owner | May 01 '24 | Sale | 4.21 | 20,315 | 85,473 | 1,779,306 | May 01 07:15 PM | | UNIVERSITY OF TEXAS/TEXAS AM I | 10% Owner | Apr 30 '24 | Sale | 4.97 | 90 | 448 | 1,799,621 | May 01 07:15 PM | | UNIVERSITY OF TEXAS/TEXAS AM I | 10% Owner | Apr 29 '24 | Sale | 4.95 | 10,746 | 53,182 | 1,799,711 | May 01 07:15 PM | | WINDSOR JAMES BRIAN | President and COO | Dec 15 '23 | Buy | 3.37 | 225 | 758 | 225 | Dec 18 05:56 PM | | WINDSOR JAMES BRIAN | President and COO | Nov 20 '23 | Buy | 1.97 | 5,076 | 9,987 | 5,122 | Nov 21 04:43 PM |
|
|
|
