 |
| Market Cap | 16.26M | EPS (ttm) | -0.86 |
| P/E | - | EPS this Y | 35.93% |
| Forward P/E | - | EPS next Y | -43.93% |
| PEG | - | EPS past 5Y | 58.67% |
| P/S | 70.69 | EPS next 5Y | - |
| P/B | 2.25 | EPS Q/Q | 14.05% |
| Dividend | - | Sales Q/Q | 0.00% |
| Insider Own | 9.24% | Inst Own | 10.91% |
| Insider Trans | 0.00% | Inst Trans | -3.33% |
| Short Float | 0.47% | Earnings | May 16/b |
| Analyst Recom | 1.00 | Target Price | 6.50 |
| Avg Volume | 236.58K | 52W Range | 0.28 - 0.80 |
|
|
|
|
Traws Pharma, Inc. is a clinical-stage biopharmaceutical company, which engages in the identification and development of oncology therapeutics. It focuses on discovering and developing small molecule drug candidates to treat cancer. The company was founded by Ramesh Kumar and E. Premkumar Reddy on December 22, 1998 and is headquartered in Newtown, PA. |
|
 |
 |
| Market Cap | 2.89B | EPS (ttm) | 0.53 |
| P/E | 12.53 | EPS this Y | -30.32% |
| Forward P/E | 14.19 | EPS next Y | 24.37% |
| PEG | 0.57 | EPS past 5Y | - |
| P/S | 0.51 | EPS next 5Y | 21.80% |
| P/B | 1.33 | EPS Q/Q | -95.98% |
| Dividend | 14.06% | Sales Q/Q | -4.17% |
| Insider Own | 66.49% | Inst Own | 24.73% |
| Insider Trans | 0.00% | Inst Trans | - |
| Short Float | 7.51% | Earnings | May 16/b |
| Analyst Recom | 2.56 | Target Price | 8.49 |
| Avg Volume | 3.11M | 52W Range | 5.86 - 8.99 |
|
|
|
|
Under Armour, Inc. engages in the development, marketing, and distribution of branded performance apparel, footwear, and accessories for men, women, and youth. It operates through the following geographical segments: North America, EMEA, Asia-Pacific, Latin America, and Other. The company was founded by Kevin A. Plank in 1996 and is headquartered in Baltimore, MD. |
| Insider Trading |
Relationship |
Date |
Transaction |
Cost |
#Shares |
Value ($) |
#Shares Total |
SEC Form 4 |
| Plank Kevin A | Exec. Chair & Brand Chief | May 31 '23 | Sale | 6.13 | 16,000,000 | 98,080,000 | 0 | Jun 02 04:33 PM |
|
|
|
 |
| Market Cap | 2.92B | EPS (ttm) | 0.53 |
| P/E | 12.66 | EPS this Y | -29.22% |
| Forward P/E | 14.27 | EPS next Y | 22.99% |
| PEG | 1.49 | EPS past 5Y | - |
| P/S | 0.51 | EPS next 5Y | 8.50% |
| P/B | 1.34 | EPS Q/Q | -95.98% |
| Dividend | 11.92% | Sales Q/Q | -4.17% |
| Insider Own | 56.72% | Inst Own | 36.41% |
| Insider Trans | 0.00% | Inst Trans | -1.81% |
| Short Float | 10.61% | Earnings | May 16/b |
| Analyst Recom | 2.57 | Target Price | 8.42 |
| Avg Volume | 6.36M | 52W Range | 6.29 - 9.50 |
|
|
| May-16-24 | Downgrade |
William Blair |
Outperform → Mkt Perform |
|
| May-16-24 | Downgrade |
JP Morgan |
Neutral → Underweight |
$8 → $6 |
|
|
|
Under Armour, Inc. engages in the development, marketing, and distribution of branded performance apparel, footwear, and accessories for men, women, and youth. It operates through the following geographical segments: North America, EMEA, Asia-Pacific, Latin America, and Other. The company was founded by Kevin A. Plank in 1996 and is headquartered in Baltimore, MD. |
| Insider Trading |
Relationship |
Date |
Transaction |
Cost |
#Shares |
Value ($) |
#Shares Total |
SEC Form 4 |
| Plank Kevin A | Exec. Chair & Brand Chief | May 31 '23 | Sale | 6.13 | 16,000,000 | 98,080,000 | 0 | Jun 02 04:33 PM |
|
|
| |
 |
| Market Cap | 1.90B | EPS (ttm) | - |
| P/E | - | EPS this Y | 30.75% |
| Forward P/E | 3.15 | EPS next Y | 17.82% |
| PEG | - | EPS past 5Y | - |
| P/S | 0.52 | EPS next 5Y | - |
| P/B | 1.70 | EPS Q/Q | - |
| Dividend | 4.85% | Sales Q/Q | 0.21% |
| Insider Own | 0.14% | Inst Own | 21.27% |
| Insider Trans | 0.00% | Inst Trans | -32.44% |
| Short Float | 0.11% | Earnings | May 16/b |
| Analyst Recom | 1.00 | Target Price | 40.00 |
| Avg Volume | 36.84K | 52W Range | 14.50 - 26.68 |
|
|
|
|
VEON Ltd. is a holding company, which engages in the provision of connectivity and internet services. It operates through the following geographical segments: Pakistan, Ukraine, Kazakhstan, Uzbekistan, Bangladesh, Others, and Headquarters (HQ). The Others segment includes operations in Kyrgyzstan. The HQ segment is involved in management activities within the group in Amsterdam, London, Luxembourg, and Dubai; and costs relating to centrally managed operations. The company was founded by Dmitriy Borisovich Zimin and Augie K. Fabela II in 1992 and is headquartered in Amsterdam, the Netherlands. |
|
|
 |
| Market Cap | 13.38B | EPS (ttm) | 6.45 |
| P/E | 26.75 | EPS this Y | 6.33% |
| Forward P/E | 22.71 | EPS next Y | 11.76% |
| PEG | 2.95 | EPS past 5Y | 39.56% |
| P/S | 4.66 | EPS next 5Y | 9.06% |
| P/B | 11.22 | EPS Q/Q | 14.64% |
| Dividend | 0.32% | Sales Q/Q | 5.87% |
| Insider Own | 10.55% | Inst Own | 84.35% |
| Insider Trans | -16.11% | Inst Trans | 1.28% |
| Short Float | 1.77% | Earnings | May 16/b |
| Analyst Recom | 1.50 | Target Price | 186.00 |
| Avg Volume | 428.43K | 52W Range | 85.43 - 177.19 |
|
|
|
|
Advanced Drainage Systems, Inc. engages in the manufacture of thermoplastic corrugated pipe, which provides a suite of water management products and drainage solutions for use in the construction and infrastructure marketplace. It operates through the following segments: Pipe, Infiltrator, International, and Allied Products & Other. The Pipe segment manufactures and markets thermoplastic corrugated pipe throughout the United States. The Infiltrator segment provides plastic leachfield chambers and systems, septic tanks and accessories, primarily for use in residential applications. The International segment manufactures and markets pipe and allied products in regions outside of the United States. The Allied Products & Other segment manufactures and markets products throughout the United States. Products include StormTech, Nyloplast, ARC Septic Chambers, Inserta Tee, water quality filters and structures, Fittings, and FleXstorm. The company was founded in 1966 and is headquartered in Hilliard, OH. |
| Insider Trading |
Relationship |
Date |
Transaction |
Cost |
#Shares |
Value ($) |
#Shares Total |
SEC Form 4 |
| HUEBERT MICHAEL G. | Executive Vice President | Mar 06 '24 | Sale | 163.52 | 10,000 | 1,635,209 | 13,450 | Mar 08 04:01 PM | | Seetharam Anil | Director | Feb 28 '24 | Sale | 163.00 | 762,895 | 124,351,885 | 0 | Mar 01 04:59 PM | | JONES ROSS M | Director | Feb 28 '24 | Sale | 163.00 | 762,895 | 124,351,885 | 0 | Mar 01 05:03 PM | | WAUN THOMAS J. SR. | EVP, International | Feb 27 '24 | Option Exercise | 46.89 | 1,500 | 70,335 | 11,213 | Feb 29 04:01 PM | | WAUN THOMAS J. SR. | EVP, International | Feb 27 '24 | Sale | 164.39 | 1,500 | 246,585 | 9,713 | Feb 29 04:01 PM |
|
|
| |
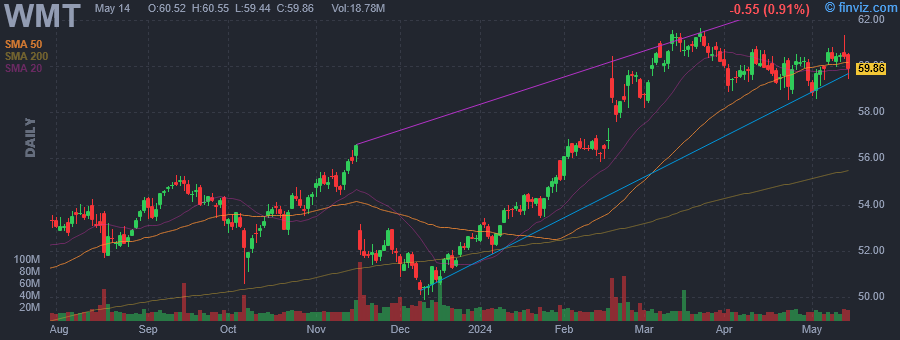 |
| Market Cap | 515.91B | EPS (ttm) | 2.34 |
| P/E | 27.37 | EPS this Y | 8.49% |
| Forward P/E | 24.30 | EPS next Y | 9.56% |
| PEG | 3.42 | EPS past 5Y | 20.49% |
| P/S | 0.78 | EPS next 5Y | 8.00% |
| P/B | 6.15 | EPS Q/Q | 206.21% |
| Dividend | 1.30% | Sales Q/Q | 6.05% |
| Insider Own | 46.29% | Inst Own | 34.85% |
| Insider Trans | -1.40% | Inst Trans | -0.19% |
| Short Float | 0.78% | Earnings | May 16/b |
| Analyst Recom | 1.51 | Target Price | 69.13 |
| Avg Volume | 18.52M | 52W Range | 48.34 - 61.65 |
|
|
|
May-16-24 10:31PM
|
Q1 2025 Walmart Inc Earnings Call
(Thomson Reuters StreetEvents) +6.99% |
|
09:39PM
|
Analyst Report: Walmart Inc.
(Morningstar Research) |
|
08:29PM
|
Walmart Posts Sales Growth, Raises Earnings Outlook for the Year
(The Wall Street Journal) |
|
06:33PM
|
Walmart's boost from high-income shoppers is not good news for economy, says Fmr. Walmart U.S. CEO
(CNBC TV) |
|
06:00PM
|
Walmart posts strong quarter thanks to higher income shoppers
(TheStreet) |
|
05:39PM
|
Dow crosses 40,000, cannabis stocks rise: Market Domination
(Yahoo Finance Video) |
|
05:19PM
|
S&P 500 Gains and Losses Today: Walmart Stock Soars After Strong Earnings Report
(Investopedia) |
|
04:40PM
|
These Stocks Moved the Most Today: Walmart, Deere, 3M, Cisco, Dell, Chubb, GameStop, AST SpaceMobile, and More
(Barrons.com) |
|
04:35PM
|
Walmart Stock Hits Record High. Earnings Impress as Wealthier Shoppers Flock to Value.
(Barrons.com) |
|
04:33PM
|
Walmart's earnings beat helps push Dow past 40,000 mark
(CNBC TV) |
|
Walmart, Inc. engages in retail and wholesale business. The company offers an assortment of merchandise and services at everyday low prices. It operates through the following business segments: Walmart U.S., Walmart International, and Sam's Club. The Walmart U.S. segment operates as a merchandiser of consumer products, operating under the Walmart, Wal-Mart, and Walmart Neighborhood Market brands, as well as walmart.com and other eCommerce brands. The Walmart International segment manages supercenters, supermarkets, hypermarkets, warehouse clubs, and cash and carry outside of the United States. The Sam's Club segment consists of membership-only warehouse clubs and samsclubs.com. The company was founded by Samuel Moore Walton and James Lawrence Walton in 1945 and is headquartered in Bentonville, AR. |
| Insider Trading |
Relationship |
Date |
Transaction |
Cost |
#Shares |
Value ($) |
#Shares Total |
SEC Form 4 |
| Rainey John D | Executive Vice President | May 01 '24 | Sale | 59.08 | 3,000 | 177,248 | 521,613 | May 03 04:38 PM | | McMillon C Douglas | President and CEO | Apr 25 '24 | Sale | 60.03 | 29,124 | 1,748,325 | 4,018,650 | Apr 29 04:30 PM | | Rainey John D | Executive Vice President | Apr 01 '24 | Sale | 60.26 | 3,000 | 180,782 | 524,613 | Apr 02 04:53 PM | | McMillon C Douglas | President and CEO | Mar 28 '24 | Sale | 60.45 | 29,124 | 1,760,400 | 4,047,767 | Apr 01 04:32 PM | | Furner John R. | Executive Vice President | Mar 27 '24 | Sale | 60.81 | 13,125 | 798,131 | 645,517 | Apr 01 04:33 PM |
|
|
|
 |
| Market Cap | 109.68M | EPS (ttm) | 0.26 |
| P/E | 6.62 | EPS this Y | - |
| Forward P/E | - | EPS next Y | - |
| PEG | 0.35 | EPS past 5Y | - |
| P/S | 0.32 | EPS next 5Y | 19.00% |
| P/B | 0.33 | EPS Q/Q | 220.00% |
| Dividend | - | Sales Q/Q | -19.14% |
| Insider Own | 1.75% | Inst Own | 4.82% |
| Insider Trans | 0.00% | Inst Trans | -16.83% |
| Short Float | 0.03% | Earnings | May 16/b |
| Analyst Recom | 1.00 | Target Price | 12.00 |
| Avg Volume | 60.10K | 52W Range | 1.28 - 2.09 |
|
|
|
|
Xunlei Ltd. is a technology company providing distributed cloud services. It provides a wide range of products and services across cloud acceleration, blockchain, shared cloud computing and digital entertainment to deliver an efficient internet experience. The company was founded by Sheng Long Zou and Hao Cheng in December 2002 and is headquartered in Shenzhen, China. |
|
|
|
