 |
| Market Cap | 193.98B | EPS (ttm) | 11.03 |
| P/E | 27.97 | EPS this Y | 3.93% |
| Forward P/E | 23.59 | EPS next Y | 7.82% |
| PEG | 3.69 | EPS past 5Y | 11.18% |
| P/S | 3.00 | EPS next 5Y | 7.58% |
| P/B | 7.15 | EPS Q/Q | 10.08% |
| Dividend | 1.65% | Sales Q/Q | -0.09% |
| Insider Own | 0.24% | Inst Own | 78.40% |
| Insider Trans | -5.12% | Inst Trans | 1.15% |
| Short Float | 1.10% | Earnings | Mar 21/b |
| Analyst Recom | 1.97 | Target Price | 382.65 |
| Avg Volume | 2.71M | 52W Range | 274.62 - 387.51 |
|
|
| Today | Downgrade |
Deutsche Bank |
Buy → Hold |
$409 → $295 |
|
|
|
Accenture is a global professional services company that helps the world's businesses, governments and other organizations build their digital core, optimize their operations, accelerate revenue growth and enhance citizen services, creating tangible value at speed and scale. The company combines technology and leadership in cloud, data and AI with industry experience, functional expertise and global delivery capability. Its services include Strategy & Consulting, Technology, Operations, Industry X, and Song. Accenture operates through the following geographical segments: North America, EMEA, and Growth Markets. The company was founded in 1989 and is headquartered in Dublin, Ireland. |
| Insider Trading |
Relationship |
Date |
Transaction |
Cost |
#Shares |
Value ($) |
#Shares Total |
SEC Form 4 |
| PELISSON Gilles | Director | May 13 '24 | Sale | 308.02 | 7,288 | 2,244,878 | 0 | May 14 04:13 PM | | Shook Ellyn | Chief Leadership & HR Officer | Apr 25 '24 | Sale | 307.22 | 5,000 | 1,536,112 | 13,699 | Apr 26 09:06 AM | | Unruch Joel | General Counsel/Corp Secretary | Apr 19 '24 | Sale | 316.12 | 4,333 | 1,369,733 | 30,702 | Apr 22 04:25 PM | | Ollagnier Jean-Marc | CEO EMEA | Apr 12 '24 | Sale | 315.91 | 6,250 | 1,974,432 | 161,581 | Apr 16 04:11 PM | | McClure Kathleen R | Chief Financial Officer | Apr 12 '24 | Sale | 316.00 | 4,500 | 1,422,008 | 42,781 | Apr 16 04:12 PM |
|
|
 |
 |
| Market Cap | 666.66M | EPS (ttm) | -0.05 |
| P/E | - | EPS this Y | 274.00% |
| Forward P/E | 28.09 | EPS next Y | 42.20% |
| PEG | - | EPS past 5Y | - |
| P/S | 4.01 | EPS next 5Y | - |
| P/B | 1.46 | EPS Q/Q | 32.56% |
| Dividend | - | Sales Q/Q | 38.40% |
| Insider Own | 41.56% | Inst Own | 47.18% |
| Insider Trans | -0.42% | Inst Trans | 7.22% |
| Short Float | 9.58% | Earnings | May 09/a |
| Analyst Recom | 1.22 | Target Price | 7.38 |
| Avg Volume | 1.23M | 52W Range | 3.40 - 7.28 |
|
|
| Today | Downgrade |
JP Morgan |
Overweight → Neutral |
|
|
|
May-09-24 06:10PM
|
Altus Power, Inc. (AMPS) Reports Q1 Loss, Tops Revenue Estimates
(Zacks) |
|
04:10PM
|
Altus Power, Inc. Announces First Quarter 2024 Financial Results
(Business Wire) |
|
May-02-24 10:01AM
|
Analysts Estimate Altus Power, Inc. (AMPS) to Report a Decline in Earnings: What to Look Out for
(Zacks) |
|
Apr-29-24 08:30AM
|
Altus Power Announces CEO Transition
(Business Wire) |
|
Apr-15-24 04:30PM
|
Altus Power, Inc. Announces Date for Release of First Quarter 2024 Financial Results and Conference Call
(Business Wire) -6.18% |
|
Apr-10-24 04:42PM
|
10 Underperforming Stocks Insiders are Buying
(Insider Monkey) -5.42% |
|
Mar-16-24 04:31PM
|
Altus Power, Inc. (NYSE:AMPS) Q4 2023 Earnings Call Transcript
(Insider Monkey) |
|
Mar-14-24 05:45PM
|
Altus Power, Inc. (AMPS) Reports Q4 Loss, Misses Revenue Estimates
(Zacks) |
|
04:10PM
|
Altus Power, Inc. Announces Fourth Quarter and Full Year 2023 Financial Results
(Business Wire) |
|
Mar-07-24 10:00AM
|
Altus Power, Inc. (AMPS) May Report Negative Earnings: Know the Trend Ahead of Next Week's Release
(Zacks) |
|
Altus Power, Inc. is a clean electrification company, which engages in the development, ownership, construction, and operation of roof, ground, and carport-based photovoltaic solar energy generation and storage systems. The company was founded on September 4, 2013 and is headquartered in Greenwich, CT. |
| Insider Trading |
Relationship |
Date |
Transaction |
Cost |
#Shares |
Value ($) |
#Shares Total |
SEC Form 4 |
| Felton Gregg J | CO-FOUNDER CO-CEO CO-PRESIDENT | Mar 28 '24 | Buy | 4.78 | 12,500 | 59,750 | 11,894,603 | Apr 01 08:28 AM | | NORELL LARS | CO-FOUNDER CO-CEO CO-PRESIDENT | Mar 01 '24 | Sale | 6.86 | 40,000 | 274,520 | 21,614,907 | Mar 05 05:31 PM | | Savino Anthony | COFOUNDER,CHIEF CONST. OFFICER | Feb 16 '24 | Sale | 7.15 | 4,598 | 32,876 | 3,887,663 | Feb 26 07:36 PM | | Weber Dustin | CHIEF FINANCIAL OFFICER | Feb 16 '24 | Sale | 7.15 | 4,350 | 31,102 | 1,884,926 | Feb 26 07:41 PM | | Savino Anthony | COFOUNDER,CHIEF CONST. OFFICER | Feb 15 '24 | Sale | 7.14 | 15,275 | 109,014 | 3,892,261 | Feb 16 06:27 PM |
|
|
|
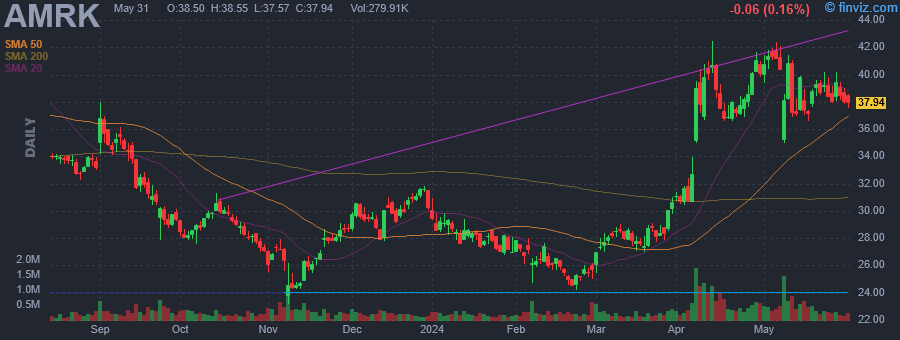 |
| Market Cap | 853.80M | EPS (ttm) | 3.26 |
| P/E | 11.44 | EPS this Y | -70.27% |
| Forward P/E | 9.35 | EPS next Y | 53.17% |
| PEG | - | EPS past 5Y | - |
| P/S | 0.08 | EPS next 5Y | - |
| P/B | 1.46 | EPS Q/Q | -85.56% |
| Dividend | 2.13% | Sales Q/Q | 13.42% |
| Insider Own | 23.22% | Inst Own | 65.72% |
| Insider Trans | -3.45% | Inst Trans | -3.94% |
| Short Float | 23.40% | Earnings | May 07/a |
| Analyst Recom | 2.00 | Target Price | 38.75 |
| Avg Volume | 457.41K | 52W Range | 23.14 - 42.48 |
|
|
| Today | Downgrade |
B. Riley Securities |
Buy → Neutral |
$33 |
|
|
Today 12:23PM
|
A-Mark Precious Metals Insider Sold Shares Worth $958,574, According to a Recent SEC Filing
(MT Newswires) -6.28% |
|
May-14-24 09:10PM
|
Director Michael Wittmeyer Sells 18,448 Shares of A-Mark Precious Metals Inc (AMRK)
(GuruFocus.com) +7.22% |
|
05:03PM
|
A-Mark Precious Metals Insider Sold Shares Worth $694,278, According to a Recent SEC Filing
(MT Newswires) |
|
May-13-24 07:01PM
|
Insider Sale: Director Michael Wittmeyer Sells 44,585 Shares of A-Mark Precious Metals Inc (AMRK)
(GuruFocus.com) |
|
12:01PM
|
A-Mark Precious Metals Insider Sold Shares Worth $385,335, According to a Recent SEC Filing
(MT Newswires) |
|
May-08-24 12:25PM
|
Hidden Gems: Unveiling the 5 Stocks on Hedge Funds' Radar
(Insider Monkey) -5.43% |
|
10:53AM
|
A-Mark Precious Metals, Inc. (NASDAQ:AMRK) Q3 2024 Earnings Call Transcript
(Insider Monkey) |
|
07:31AM
|
Today's Biggest Pre-Market Stock Movers: 10 Top Gainers and Losers on Wednesday
(InvestorPlace) |
|
03:50AM
|
A-Mark Precious Metals Inc (AMRK) (Q3 2024) Earnings Call Transcript Highlights: Navigating ...
(GuruFocus.com) |
|
May-07-24 08:58PM
|
AMRK Stock Earnings: A-Mark Precious Metals Misses EPS, Beats Revenue for Q3 2024
(InvestorPlace) |
|
A-Mark Precious Metals, Inc. engages in the trading of gold, silver, platinum, and palladium bullion numismatic coins, and related products. It operates through the following segments: Wholesale Trading and Ancillary Services, Direct-to-Consumer, and Secured Lending. The Wholesale Trading and Ancillary Services segment is involved in the distribution and purchasing of metal products from sovereign and private mints. The Direct-to-Consumer segment provides access to a multitude of products through its wholly owned subsidiaries. The Secured Lending segment includes coin and precious metal dealers, investors, and collectors. The company was founded by Steven C. Markoff on April 9, 1965 and is headquartered in El Segundo, CA. |
| Insider Trading |
Relationship |
Date |
Transaction |
Cost |
#Shares |
Value ($) |
#Shares Total |
SEC Form 4 |
| ROBERTS GREGORY N | Chief Executive Officer | May 14 '24 | Option Exercise | 8.40 | 15,000 | 126,000 | 43,202 | May 15 12:18 PM | | ROBERTS GREGORY N | Chief Executive Officer | May 14 '24 | Sale | 38.93 | 15,000 | 583,964 | 28,202 | May 15 12:18 PM | | ROBERTS GREGORY N | Chief Executive Officer | May 13 '24 | Option Exercise | 8.40 | 10,000 | 84,000 | 38,202 | May 15 12:18 PM | | Wittmeyer Michael R. | Director | May 13 '24 | Sale | 37.63 | 18,448 | 694,278 | 329,502 | May 14 04:56 PM | | ROBERTS GREGORY N | Chief Executive Officer | May 13 '24 | Sale | 37.46 | 10,000 | 374,610 | 28,202 | May 15 12:18 PM |
|
|
| |
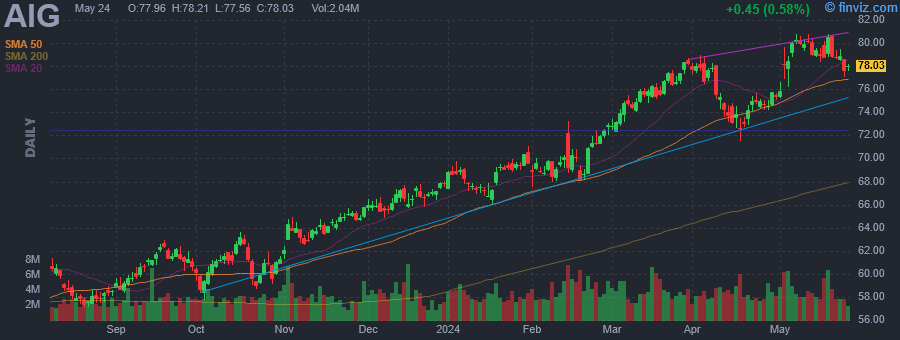 |
| Market Cap | 52.36B | EPS (ttm) | 6.70 |
| P/E | 11.78 | EPS this Y | 4.80% |
| Forward P/E | 9.98 | EPS next Y | 11.12% |
| PEG | 1.18 | EPS past 5Y | - |
| P/S | 1.07 | EPS next 5Y | 10.00% |
| P/B | 1.22 | EPS Q/Q | 5516.83% |
| Dividend | 2.00% | Sales Q/Q | 20.01% |
| Insider Own | 0.27% | Inst Own | 94.16% |
| Insider Trans | -15.65% | Inst Trans | -3.40% |
| Short Float | 1.03% | Earnings | May 01/a |
| Analyst Recom | 1.91 | Target Price | 84.27 |
| Avg Volume | 4.13M | 52W Range | 52.07 - 80.83 |
|
|
| Today | Downgrade |
HSBC Securities |
Buy → Hold |
$86 |
|
|
|
American International Group, Inc. engages in the provision of property casualty insurance, life insurance, retirement products, and other financial services to commercial and individual customers. It operates through the following segments: General Insurance, Life and Retirement, and Other Operations. The General Insurance segment consists of insurance businesses in North America and International business areas. The Life and Retirement segment includes Individual Retirement, Group Retirement, Life Insurance, and Institutional Markets. The Other Operations segment covers income from assets held by the company and other corporate subsidiaries. The company was founded by Cornelius Vander Starr in 1919 and is headquartered in New York, NY. |
| Insider Trading |
Relationship |
Date |
Transaction |
Cost |
#Shares |
Value ($) |
#Shares Total |
SEC Form 4 |
| Zaffino Peter | Chairman & CEO | Mar 15 '24 | Option Exercise | 64.53 | 333,000 | 21,488,490 | 838,420 | Mar 18 04:36 PM | | Zaffino Peter | Chairman & CEO | Mar 15 '24 | Sale | 75.87 | 333,000 | 25,265,116 | 505,420 | Mar 18 04:36 PM | | Inglis John C | Director | Mar 14 '24 | Buy | 75.39 | 659 | 49,682 | 659 | Mar 18 04:36 PM | | Bolt Thomas Allen | EVP and Chief Risk Officer | Feb 22 '24 | Option Exercise | 0.00 | 2,752 | 0 | 63,130 | Feb 22 04:30 PM | | Carbone Kathleen | VP & Chief Accounting Officer | Feb 22 '24 | Option Exercise | 0.00 | 1,926 | 0 | 13,652 | Feb 22 04:30 PM |
|
|
|
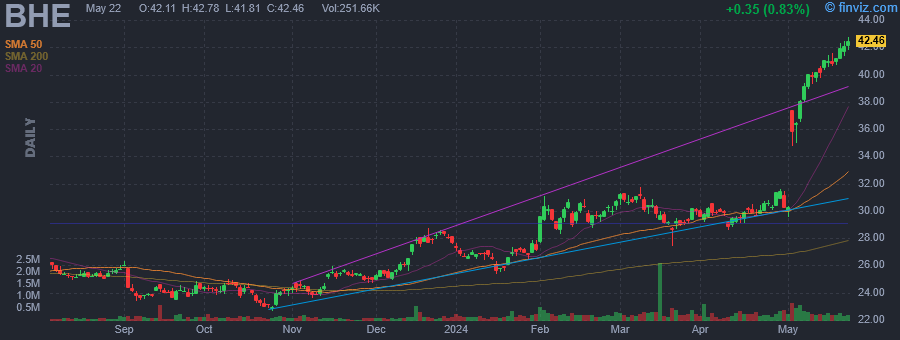 |
| Market Cap | 1.48B | EPS (ttm) | 1.83 |
| P/E | 22.36 | EPS this Y | 1.96% |
| Forward P/E | 16.84 | EPS next Y | 17.07% |
| PEG | 1.02 | EPS past 5Y | 29.60% |
| P/S | 0.52 | EPS next 5Y | 22.00% |
| P/B | 1.36 | EPS Q/Q | 10.77% |
| Dividend | 1.61% | Sales Q/Q | -2.75% |
| Insider Own | 2.59% | Inst Own | 92.35% |
| Insider Trans | -3.89% | Inst Trans | 0.44% |
| Short Float | 2.16% | Earnings | May 01/a |
| Analyst Recom | 2.00 | Target Price | 35.75 |
| Avg Volume | 336.68K | 52W Range | 21.16 - 41.10 |
|
|
| Today | Downgrade |
Fox Advisors |
Overweight → Equal Weight |
|
|
|
|
Benchmark Electronics, Inc. engages in the provision of integrated electronic manufacturing services, engineering and design services, and technology solutions. It operates through the following geographical segments: Americas, Asia, and Europe. The firm offers services to original equipment manufacturers of industrial control telecommunication equipment, computers, and related products for business enterprises, medical devices, and testing and instrumentation products. Its services include comprehensive and integrated design and manufacturing services and solutions from initial product concept to volume production, including direct order fulfillment and aftermarket services. The company was founded by Cary T. Fu, Steven A. Barton, and Donald E. Nigbor in 1979 and is headquartered in Tempe, AZ. |
| Insider Trading |
Relationship |
Date |
Transaction |
Cost |
#Shares |
Value ($) |
#Shares Total |
SEC Form 4 |
| McCreary Jeffrey Stephen | Director | May 08 '24 | Sale | 39.49 | 10,000 | 394,900 | 45,062 | May 08 05:09 PM | | JANICK JAN M | SVP, Chief Technology Officer | May 07 '24 | Sale | 38.87 | 6,777 | 263,422 | 67,774 | May 08 05:06 PM | | Kamal Arvind | Interim CFO | May 07 '24 | Sale | 38.38 | 783 | 30,052 | 20,735 | May 08 05:04 PM | | Benck Jeff | President and CEO | Feb 20 '24 | Option Exercise | 29.22 | 68,305 | 1,995,872 | 442,749 | Feb 22 09:33 PM | | Beaver Stephen J | SVP, General Counsel and CLO | Feb 20 '24 | Option Exercise | 0.00 | 13,213 | 0 | 86,779 | Feb 22 09:35 PM |
|
|
| |
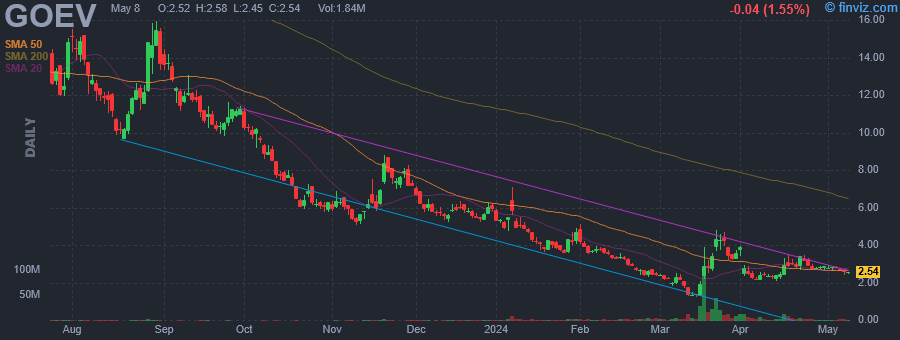 |
| Market Cap | 170.85M | EPS (ttm) | -7.35 |
| P/E | - | EPS this Y | 66.26% |
| Forward P/E | - | EPS next Y | 43.43% |
| PEG | - | EPS past 5Y | -482.58% |
| P/S | 191.96 | EPS next 5Y | - |
| P/B | 0.99 | EPS Q/Q | -905.16% |
| Dividend | - | Sales Q/Q | - |
| Insider Own | 12.18% | Inst Own | 7.56% |
| Insider Trans | -0.37% | Inst Trans | 22.67% |
| Short Float | 25.35% | Earnings | May 14/a |
| Analyst Recom | 1.29 | Target Price | 6.86 |
| Avg Volume | 8.79M | 52W Range | 1.22 - 19.50 |
|
|
| Today | Downgrade |
R. F. Lafferty |
Buy → Hold |
|
|
|
|
Canoo, Inc. is a mobility technology company, which engages in the designing and developing of electric vehicles. It designed a multi-purpose platform to deliver maximum vehicle interior space and adaptable to support a wide range of vehicle applications for consumers and businesses. The company was founded on August 6, 2018 and is headquartered in Torrance, CA. |
| Insider Trading |
Relationship |
Date |
Transaction |
Cost |
#Shares |
Value ($) |
#Shares Total |
SEC Form 4 |
| Ruiz Hector M. | GENERAL COUNSEL, CORP SECY | Feb 07 '24 | Sale | 0.16 | 745 | 119 | 283,355 | Feb 09 04:07 PM | | MURTHY RAMESH | SVP and CAO | Jan 24 '24 | Sale | 0.18 | 1,217 | 219 | 283,669 | Jan 25 08:24 PM | | Ruiz Hector M. | GENERAL COUNSEL, CORP SECY | Jan 04 '24 | Sale | 0.23 | 3,444 | 792 | 284,100 | Jan 04 08:03 PM | | Ruiz Hector M. | GENERAL COUNSEL, CORP SECY | Jan 02 '24 | Sale | 0.25 | 912 | 228 | 287,544 | Jan 04 08:03 PM | | MURTHY RAMESH | SVP and CAO | Dec 26 '23 | Sale | 0.24 | 205 | 49 | 281,886 | Dec 27 06:57 PM |
|
|
|
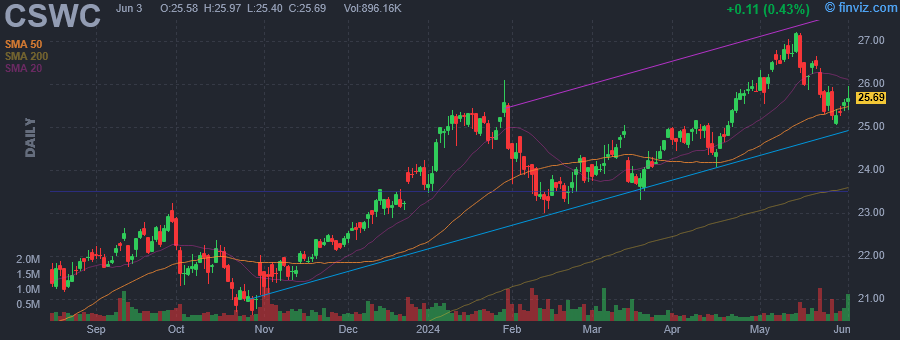 |
| Market Cap | 1.13B | EPS (ttm) | 2.05 |
| P/E | 12.87 | EPS this Y | -2.03% |
| Forward P/E | 9.77 | EPS next Y | 2.07% |
| PEG | 12.87 | EPS past 5Y | 0.72% |
| P/S | 8.19 | EPS next 5Y | 1.00% |
| P/B | 1.57 | EPS Q/Q | -43.97% |
| Dividend | 9.27% | Sales Q/Q | -28.49% |
| Insider Own | 4.47% | Inst Own | 25.70% |
| Insider Trans | 0.03% | Inst Trans | 2.60% |
| Short Float | 2.03% | Earnings | May 14/a |
| Analyst Recom | 1.67 | Target Price | 26.33 |
| Avg Volume | 292.16K | 52W Range | 17.42 - 27.22 |
|
|
| Today | Downgrade |
JMP Securities |
Mkt Outperform → Mkt Perform |
|
|
|
|
Capital Southwest is a publiclya"owned business development company with total assets of $496 million as of June 30, 2010. We provide patient capital to exceptional businesses with significant growth potential. As a public company, we have the flexibility to hold investments indefinitely, which has provided the management teams of our holdings a stable ownership platform since we were founded in 1961. We are not a private equity firm or a venture capital firm or a fund. Capital Southwest is a business development company with a refreshingly different investment mindset. |
| Insider Trading |
Relationship |
Date |
Transaction |
Cost |
#Shares |
Value ($) |
#Shares Total |
SEC Form 4 |
| Rogers-Windsor Ramona Lynn | Director | Dec 21 '23 | Buy | 23.29 | 500 | 11,645 | 11,664 | Dec 21 04:03 PM | | Rogers-Windsor Ramona Lynn | Director | Nov 02 '23 | Buy | 21.67 | 500 | 10,835 | 11,164 | Nov 02 04:37 PM |
|
|
| |
 |
| Market Cap | 12.50B | EPS (ttm) | 12.58 |
| P/E | 26.84 | EPS this Y | 10.68% |
| Forward P/E | 24.20 | EPS next Y | 8.71% |
| PEG | 2.60 | EPS past 5Y | 7.38% |
| P/S | 0.86 | EPS next 5Y | 10.31% |
| P/B | 4.25 | EPS Q/Q | -12.63% |
| Dividend | 0.53% | Sales Q/Q | -0.10% |
| Insider Own | 0.49% | Inst Own | 89.27% |
| Insider Trans | -0.39% | Inst Trans | -7.27% |
| Short Float | 2.59% | Earnings | Mar 11/a |
| Analyst Recom | 2.07 | Target Price | 333.19 |
| Avg Volume | 300.44K | 52W Range | 212.50 - 344.01 |
|
|
| Today | Downgrade |
Northcoast |
Buy → Neutral |
|
|
|
|
Casey's General Stores, Inc. engages in the management and operation of convenience stores and gasoline stations. It provides self-service gasoline, a wide selection of grocery items, and an array of freshly prepared food items. The firm offers food, beverages, tobacco products, health and beauty aids, automotive products, and other non-food items. The company was founded by Donald F. Lamberti in 1968 and is headquartered in Ankeny, IA. |
| Insider Trading |
Relationship |
Date |
Transaction |
Cost |
#Shares |
Value ($) |
#Shares Total |
SEC Form 4 |
| Lindsey Katrina S | Chief Legal Officer | Mar 02 '24 | Option Exercise | 0.00 | 102 | 0 | 1,348 | Mar 05 03:50 PM | | Lindsey Katrina S | Chief Legal Officer | Jan 03 '24 | Option Exercise | 0.00 | 716 | 0 | 1,548 | Jan 05 02:48 PM | | Spanos Mike | Director | Jan 03 '24 | Buy | 275.43 | 725 | 199,687 | 1,791 | Jan 05 02:47 PM | | Brennan Thomas P JR | Chief Merch. Officer | Dec 13 '23 | Sale | 276.11 | 1,430 | 394,837 | 7,375 | Dec 14 04:41 PM | | Trojan Greg | Director | Sep 06 '23 | Option Exercise | 0.00 | 612 | 0 | 1,287 | Sep 08 04:42 PM |
|
|
|
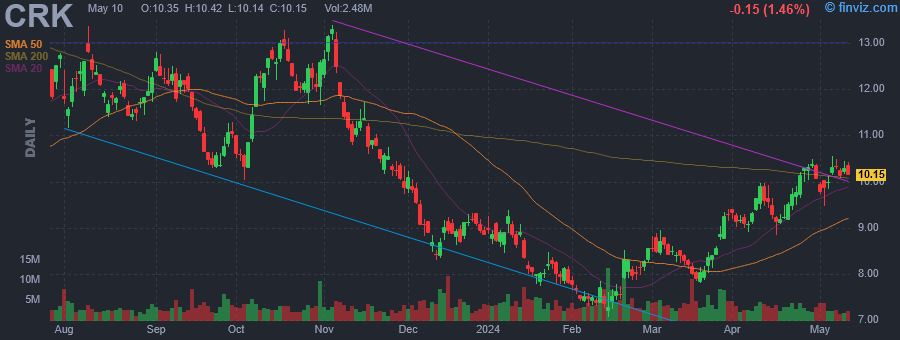 |
| Market Cap | 3.11B | EPS (ttm) | 0.22 |
| P/E | 48.47 | EPS this Y | -117.05% |
| Forward P/E | 9.69 | EPS next Y | 1469.12% |
| PEG | 2.42 | EPS past 5Y | - |
| P/S | 2.21 | EPS next 5Y | 20.00% |
| P/B | 1.27 | EPS Q/Q | -112.10% |
| Dividend | 3.53% | Sales Q/Q | -31.42% |
| Insider Own | 71.80% | Inst Own | 33.53% |
| Insider Trans | 6.34% | Inst Trans | 3.26% |
| Short Float | 34.02% | Earnings | May 01/a |
| Analyst Recom | 2.93 | Target Price | 10.35 |
| Avg Volume | 4.13M | 52W Range | 7.07 - 13.39 |
|
|
| Today | Downgrade |
CapitalOne |
Overweight → Equal Weight |
|
|
|
|
Comstock Resources, Inc. engages in the acquisition, development, and exploration of oil and natural gas. The firm operations concentrated in the Haynesville shale, a premier natural gas basin located in East Texas. The company was founded in 1919 and is headquartered in Frisco, TX. |
| Insider Trading |
Relationship |
Date |
Transaction |
Cost |
#Shares |
Value ($) |
#Shares Total |
SEC Form 4 |
| Blue Star Exploration Corp | 10% Owner | Mar 25 '24 | Buy | 8.04 | 12,500,000 | 100,450,000 | 194,821,429 | Mar 25 09:04 PM |
|
|
|
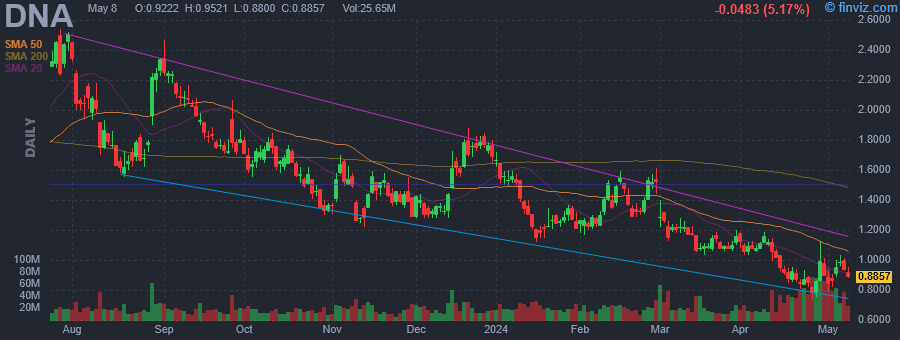 |
| Market Cap | 1.75B | EPS (ttm) | -0.43 |
| P/E | - | EPS this Y | 35.87% |
| Forward P/E | - | EPS next Y | 31.07% |
| PEG | - | EPS past 5Y | - |
| P/S | 8.41 | EPS next 5Y | 31.20% |
| P/B | 1.63 | EPS Q/Q | 22.83% |
| Dividend | - | Sales Q/Q | -52.98% |
| Insider Own | 33.26% | Inst Own | 55.85% |
| Insider Trans | -0.59% | Inst Trans | 4.32% |
| Short Float | 20.76% | Earnings | May 09/a |
| Analyst Recom | 3.71 | Target Price | 1.43 |
| Avg Volume | 35.22M | 52W Range | 0.72 - 2.55 |
|
|
| Today | Downgrade |
BTIG Research |
Neutral → Sell |
|
|
|
|
Ginkgo Bioworks Holdings, Inc. is a biotech company. Its platform is market agnostic and enables biotechnology applications across diverse markets, from food and agriculture to industrial chemicals to pharmaceuticals. It operates through the Cell Programming/Foundry, and Biosecurity segments. The company was founded by Jason Kelly, Reshma Shetty, Bartholomew Canton, Austin Che, and Thomas F. Knight, Jr. in 2008 and is headquartered in Boston, MA. |
| Insider Trading |
Relationship |
Date |
Transaction |
Cost |
#Shares |
Value ($) |
#Shares Total |
SEC Form 4 |
| SLOAN HARRY | Director | May 14 '24 | Buy | 0.91 | 297,619 | 271,815 | 718,540 | May 14 05:16 PM | | DEKKERS MARIJN E | Director | May 14 '24 | Sale | 0.93 | 1,727,056 | 1,606,162 | 281,217 | May 14 05:13 PM | | Coen Steven P. | See remarks | May 02 '24 | Sale | 0.84 | 131,928 | 111,479 | 162,527 | May 06 04:53 PM | | Dmytruk Mark E. | See remarks | May 02 '24 | Sale | 0.84 | 47,806 | 40,396 | 925,400 | May 06 04:55 PM | | Dmytruk Mark E. | See remarks | Apr 02 '24 | Sale | 1.05 | 51,169 | 53,727 | 865,079 | Apr 04 04:40 PM |
|
|
|
