


Finviz ticker and asset pages have been redesigned to make market research faster, cleaner, and more consistent. Whether you’re analyzing Apple, Gold futures, EURUSD, Bitcoin or our new index pages for S&P 500, you now have the same clear view of every symbol.
New Index Pages Now Also on Finviz
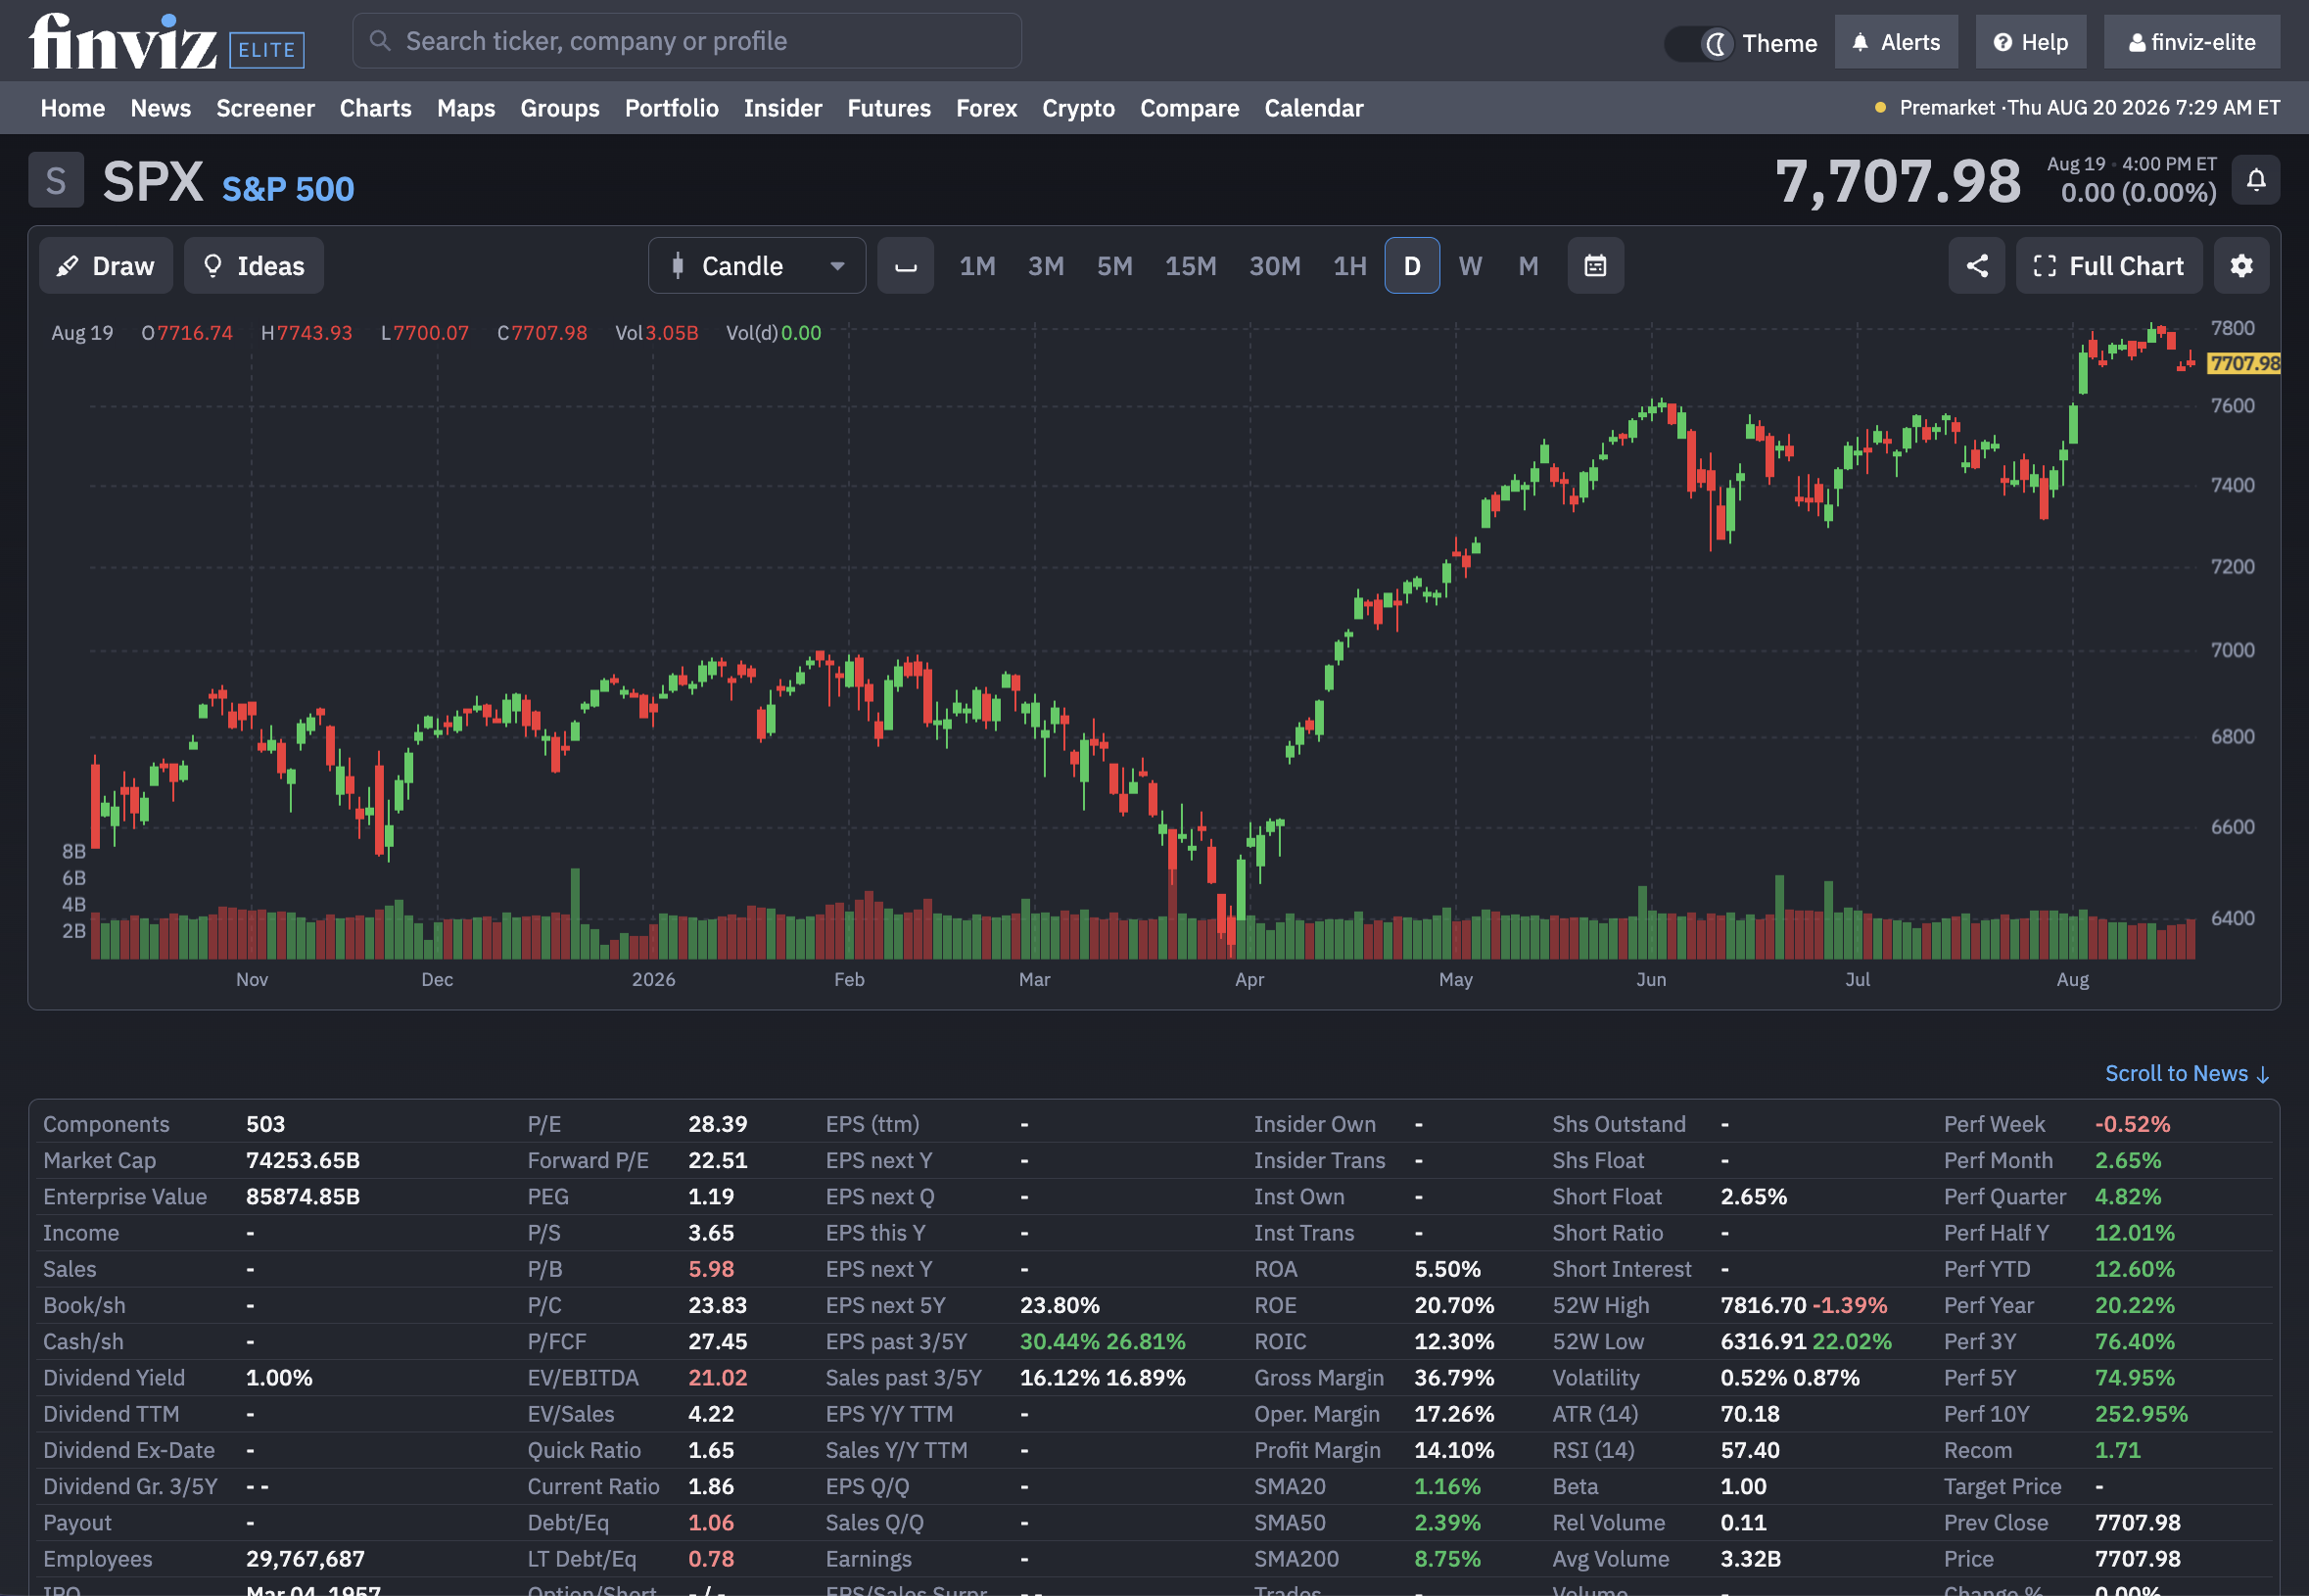
We’ve unified the Stock, Futures, Indexes, Forex, and Crypto pages into one familiar experience across Finviz. In the screenshot below, you'll see our new S&P 500 Index page equipped with price action, charts, and fundamental data like P/E Ratio for the entire index:
Navigate Every Part of a Stock in One Click
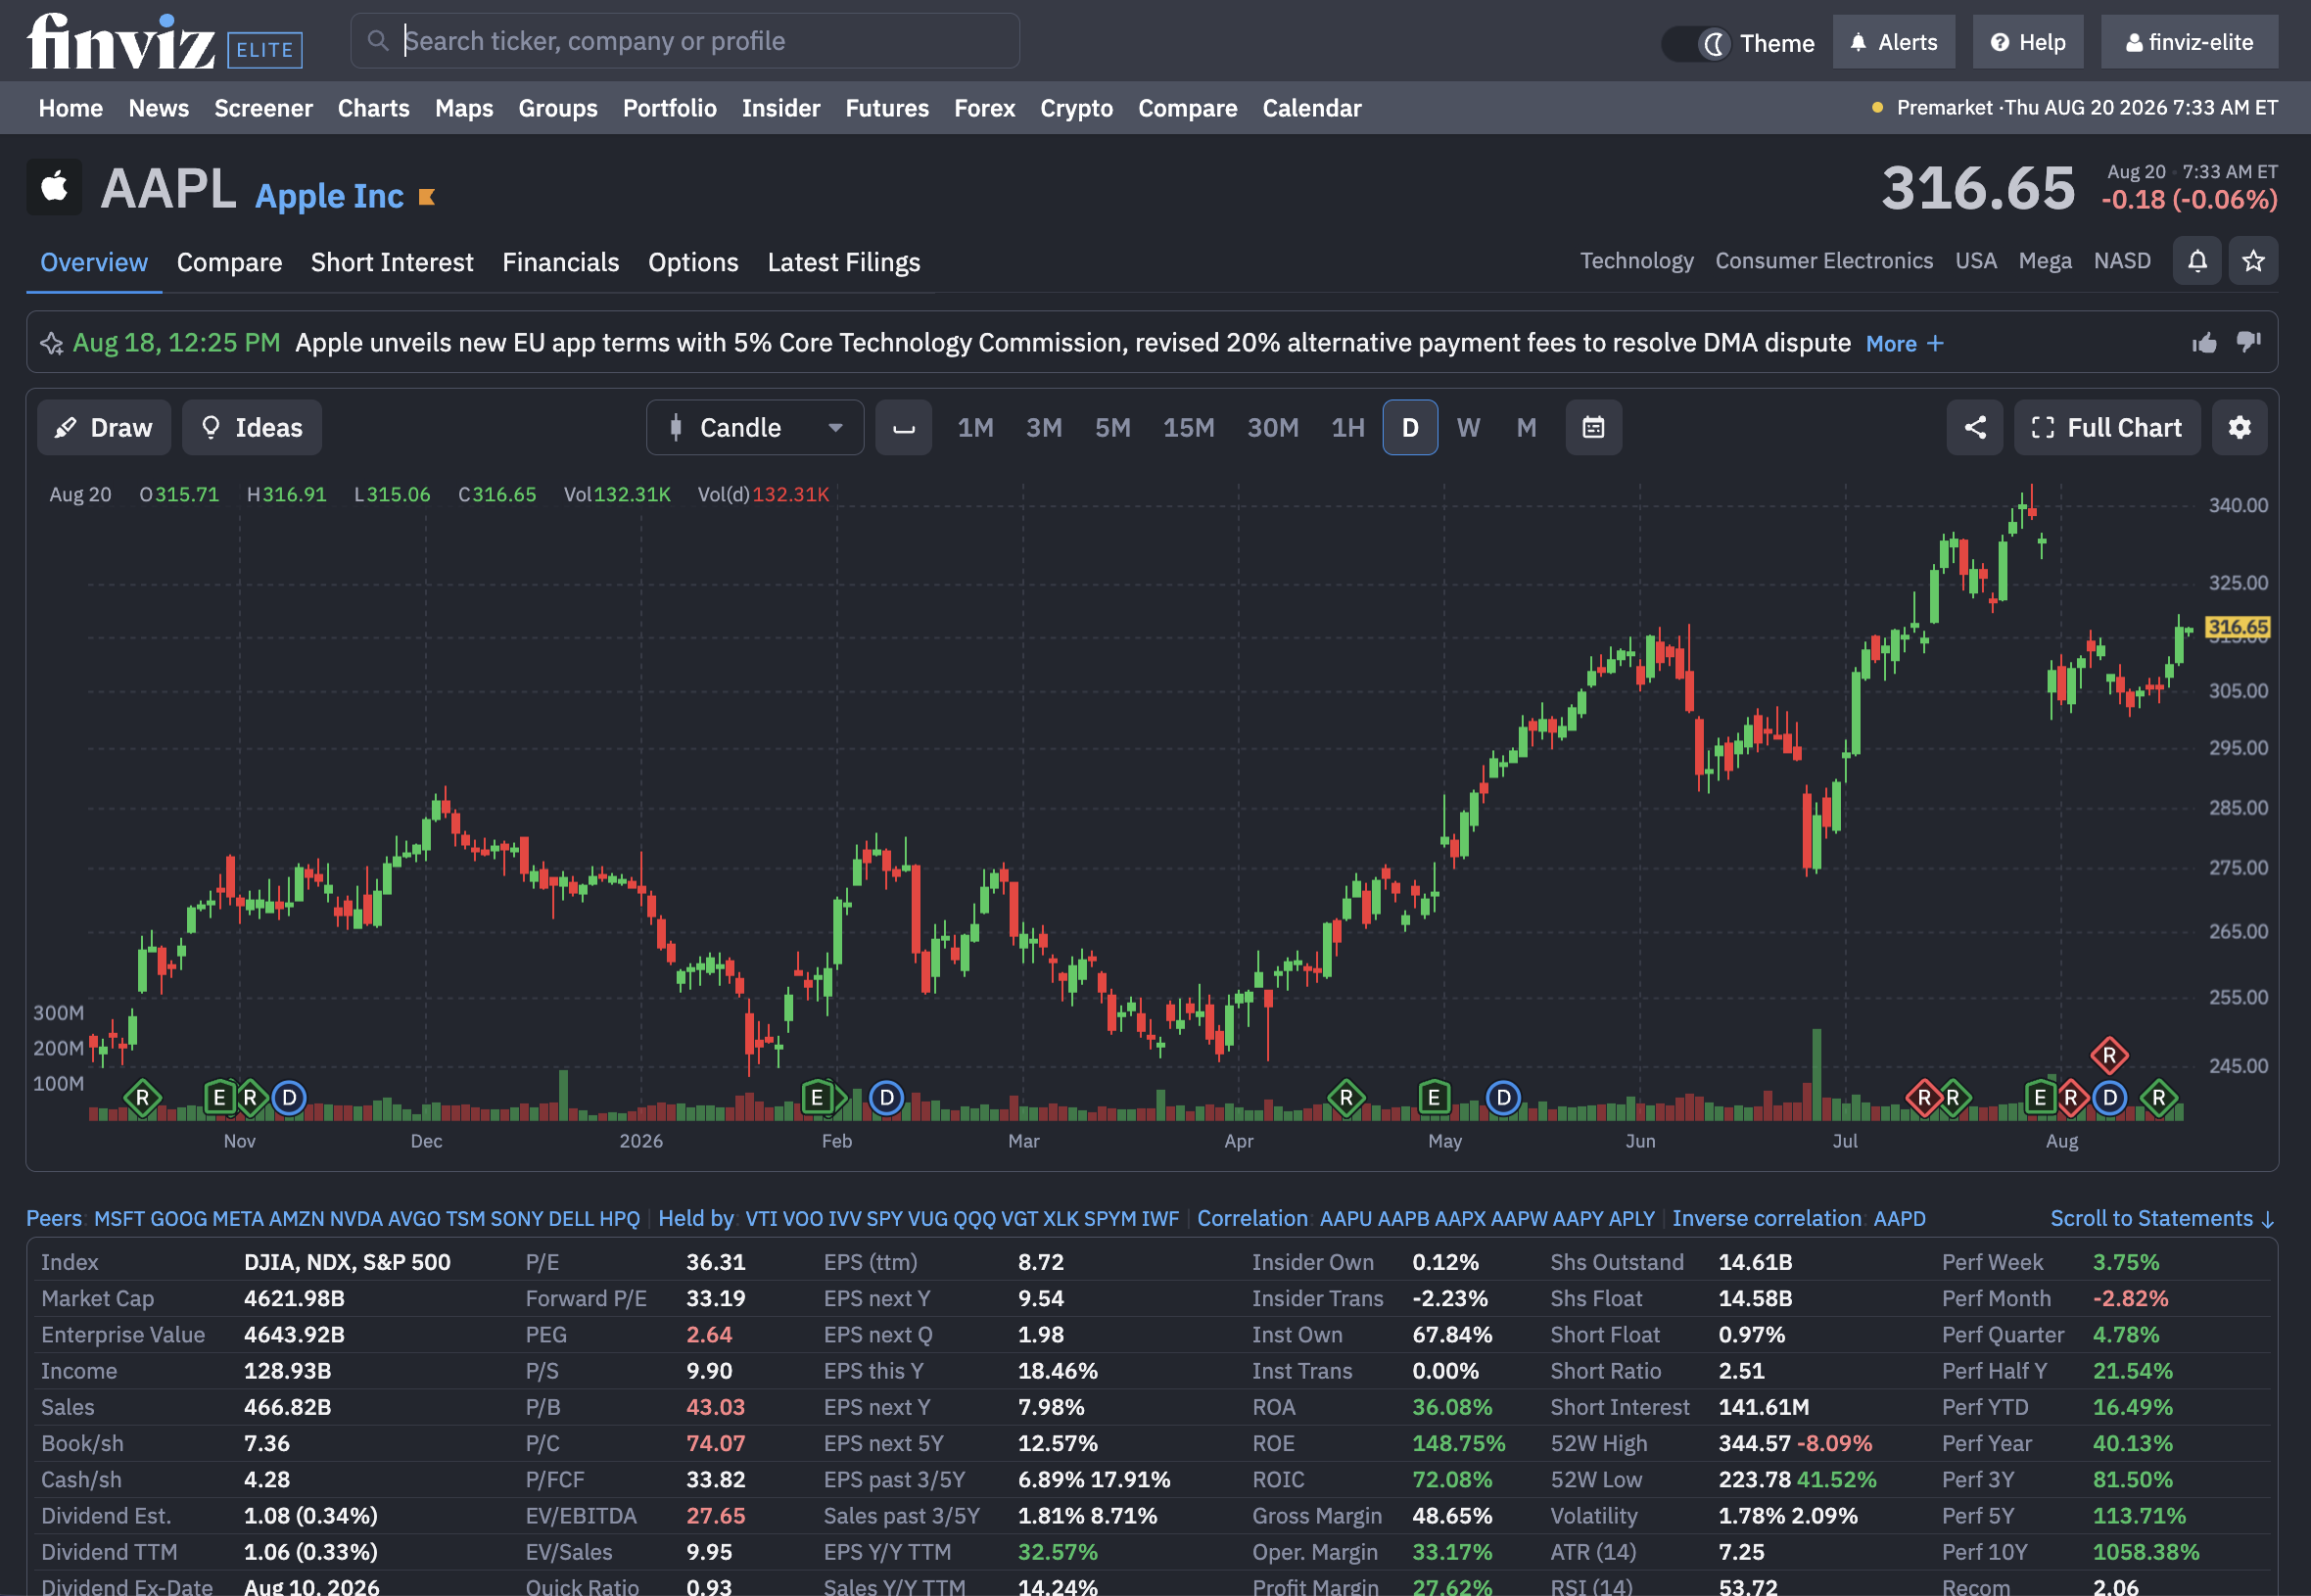
The redesigned top navigation for Stock Pages makes it easier to move between the major parts of a company’s Finviz profile:
- Overview: The complete snapshot, including the chart, company data, performance metrics, news, analyst information, and more.
- Compare: See how the stock measures up against relevant companies, competitors, or market benchmarks. Here's an example comparing AAPL to GOOGL.
- Short Interest: Review short-selling activity and understand how bearish positioning may be changing. For example, check out Gamestop short interest.
- Financials: Dig into the company’s income statement, balance sheet, cash flow, growth, and operating performance. What's Warren Buffett planning at Berkshire Hathaway with all this cash?
- Options: Explore the stock’s options market and related activity. Option premiums at Micron have been rich lately.
- Latest Filings: Quickly access recent company filings without leaving the stock page. Let's see what Palantir has filed recently.
Instead of searching across separate tools or pages, you can move through the entire research process from one streamlined navigation bar.
Unlimited Alerts on Every Ticker Page
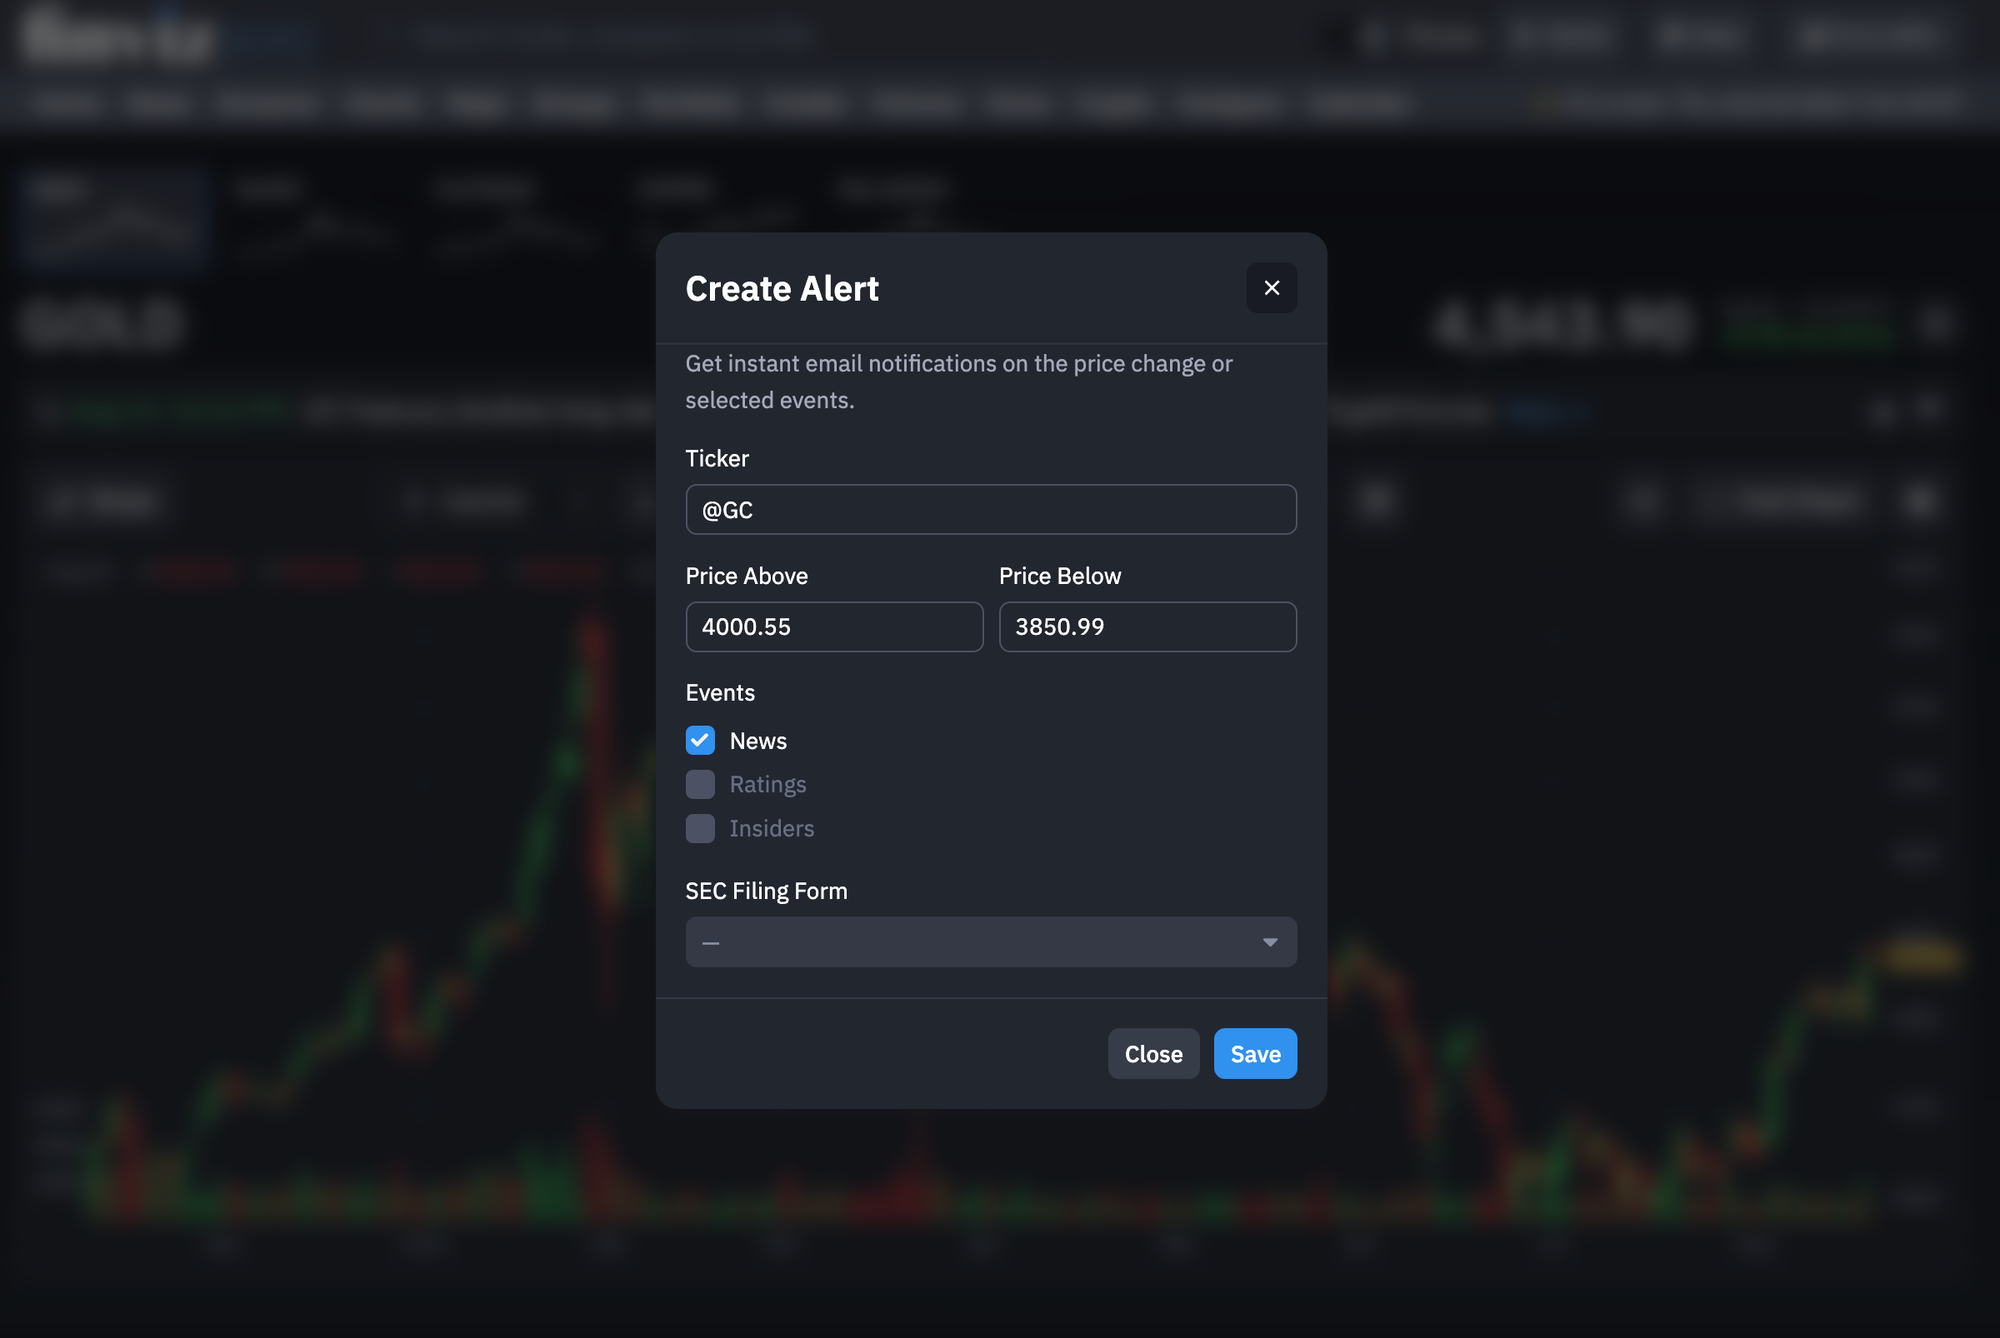
The alert button is now positioned beside the stock’s key information, making it easy to turn research into ongoing monitoring.
Finviz Elite members can create unlimited alerts, allowing you to track the stocks, setups, and market events that matter without having to manually revisit every chart. Alerts can help you stay on top of changing prices, technical conditions, news, insider transactions, ratings, and other important developments.
Find something interesting, create an alert, and let Finviz continue watching it for you.
Organize Ideas With Color Flags
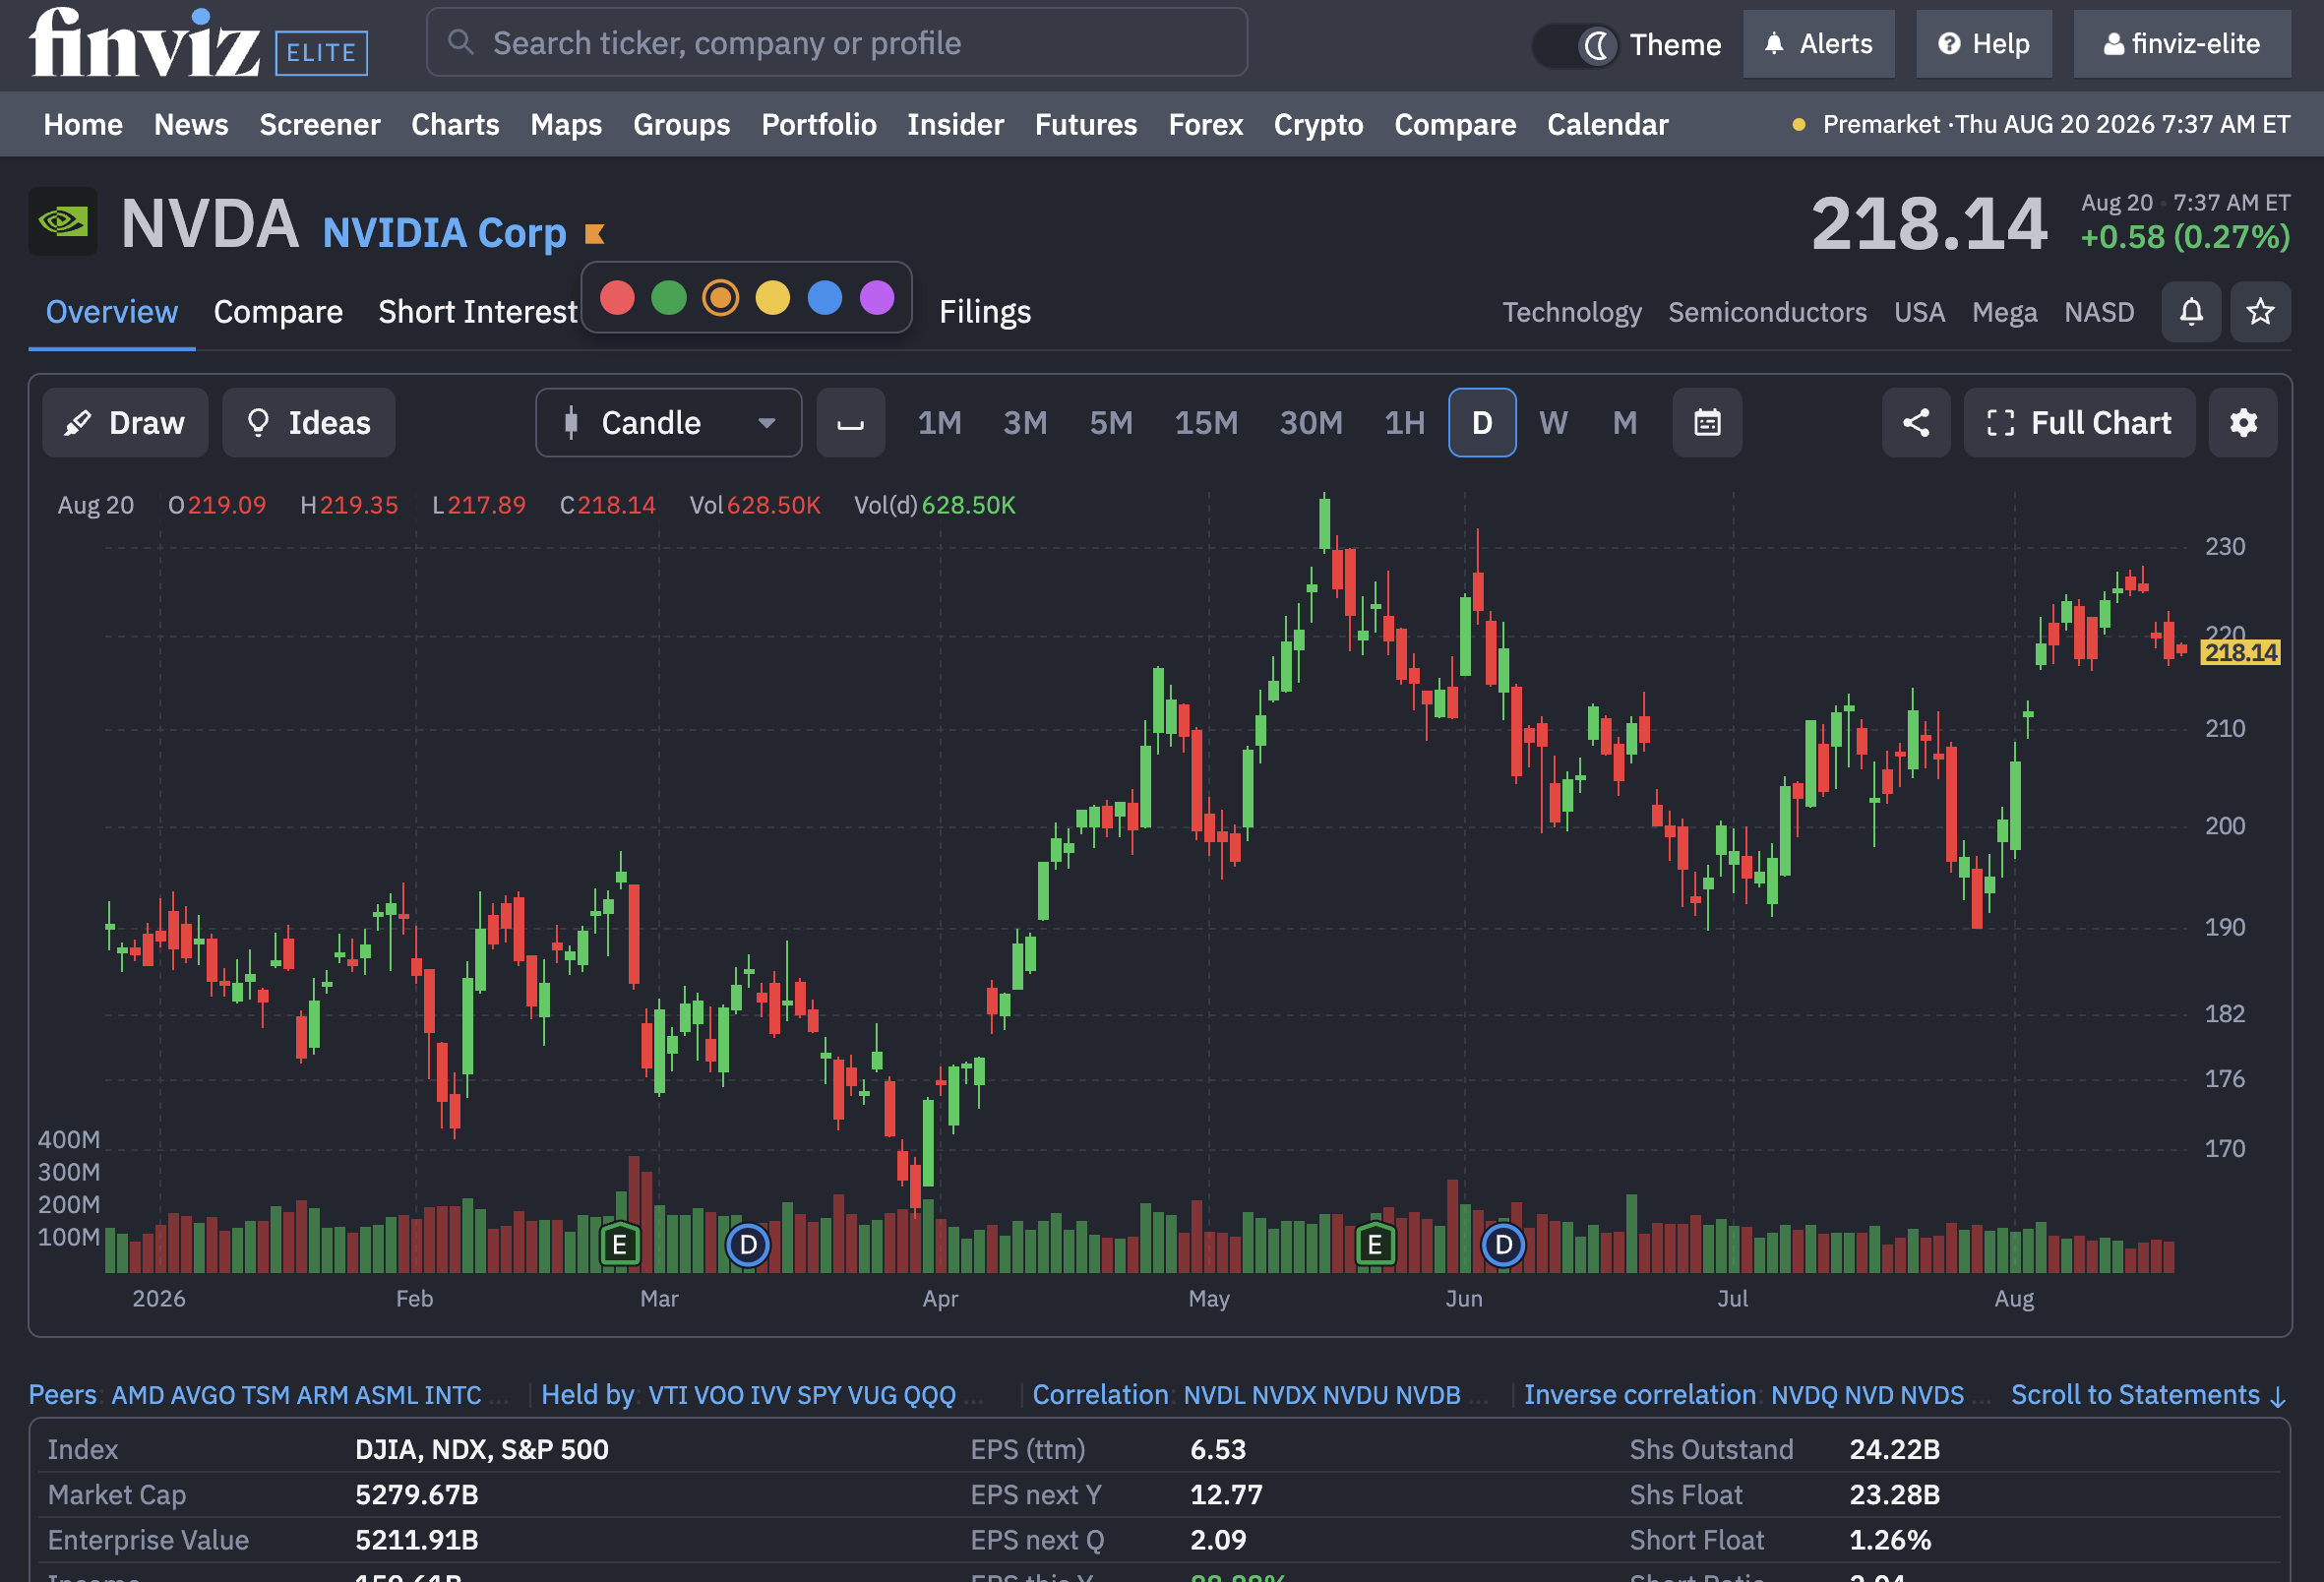
The star beside each asset gives you a fast way to save and visually organize it using Finviz Color Flags.
Color Flags make it possible to create your own research language. You might use one color for active positions, another for potential breakouts, another for earnings setups, and another for longer-term ideas.
For example:
- Red for urgent or high-risk names
- Green for active opportunities
- Blue for long-term research
- Yellow for stocks approaching an important level
- Purple for upcoming earnings or event-driven setups
There is no required system. The colors are yours to define, making it easier to recognize the status of an idea wherever it appears across Finviz.
See More of the Chart With Less Distraction
The chart is now given more room to breathe. Its wider presentation makes trends, support and resistance levels, moving averages, volume, and major events easier to see at a glance.
Frequently used controls are placed directly above the chart. You can quickly:
- Change the chart type or technical view
- Move between intraday, daily, weekly, and monthly timeframes
- Select a custom date range
- Open drawing tools
- Explore chart ideas
- Share the chart
- Expand into the full charting experience
- Adjust chart settings
For example, draw and research any chart directly from our symbol pages:
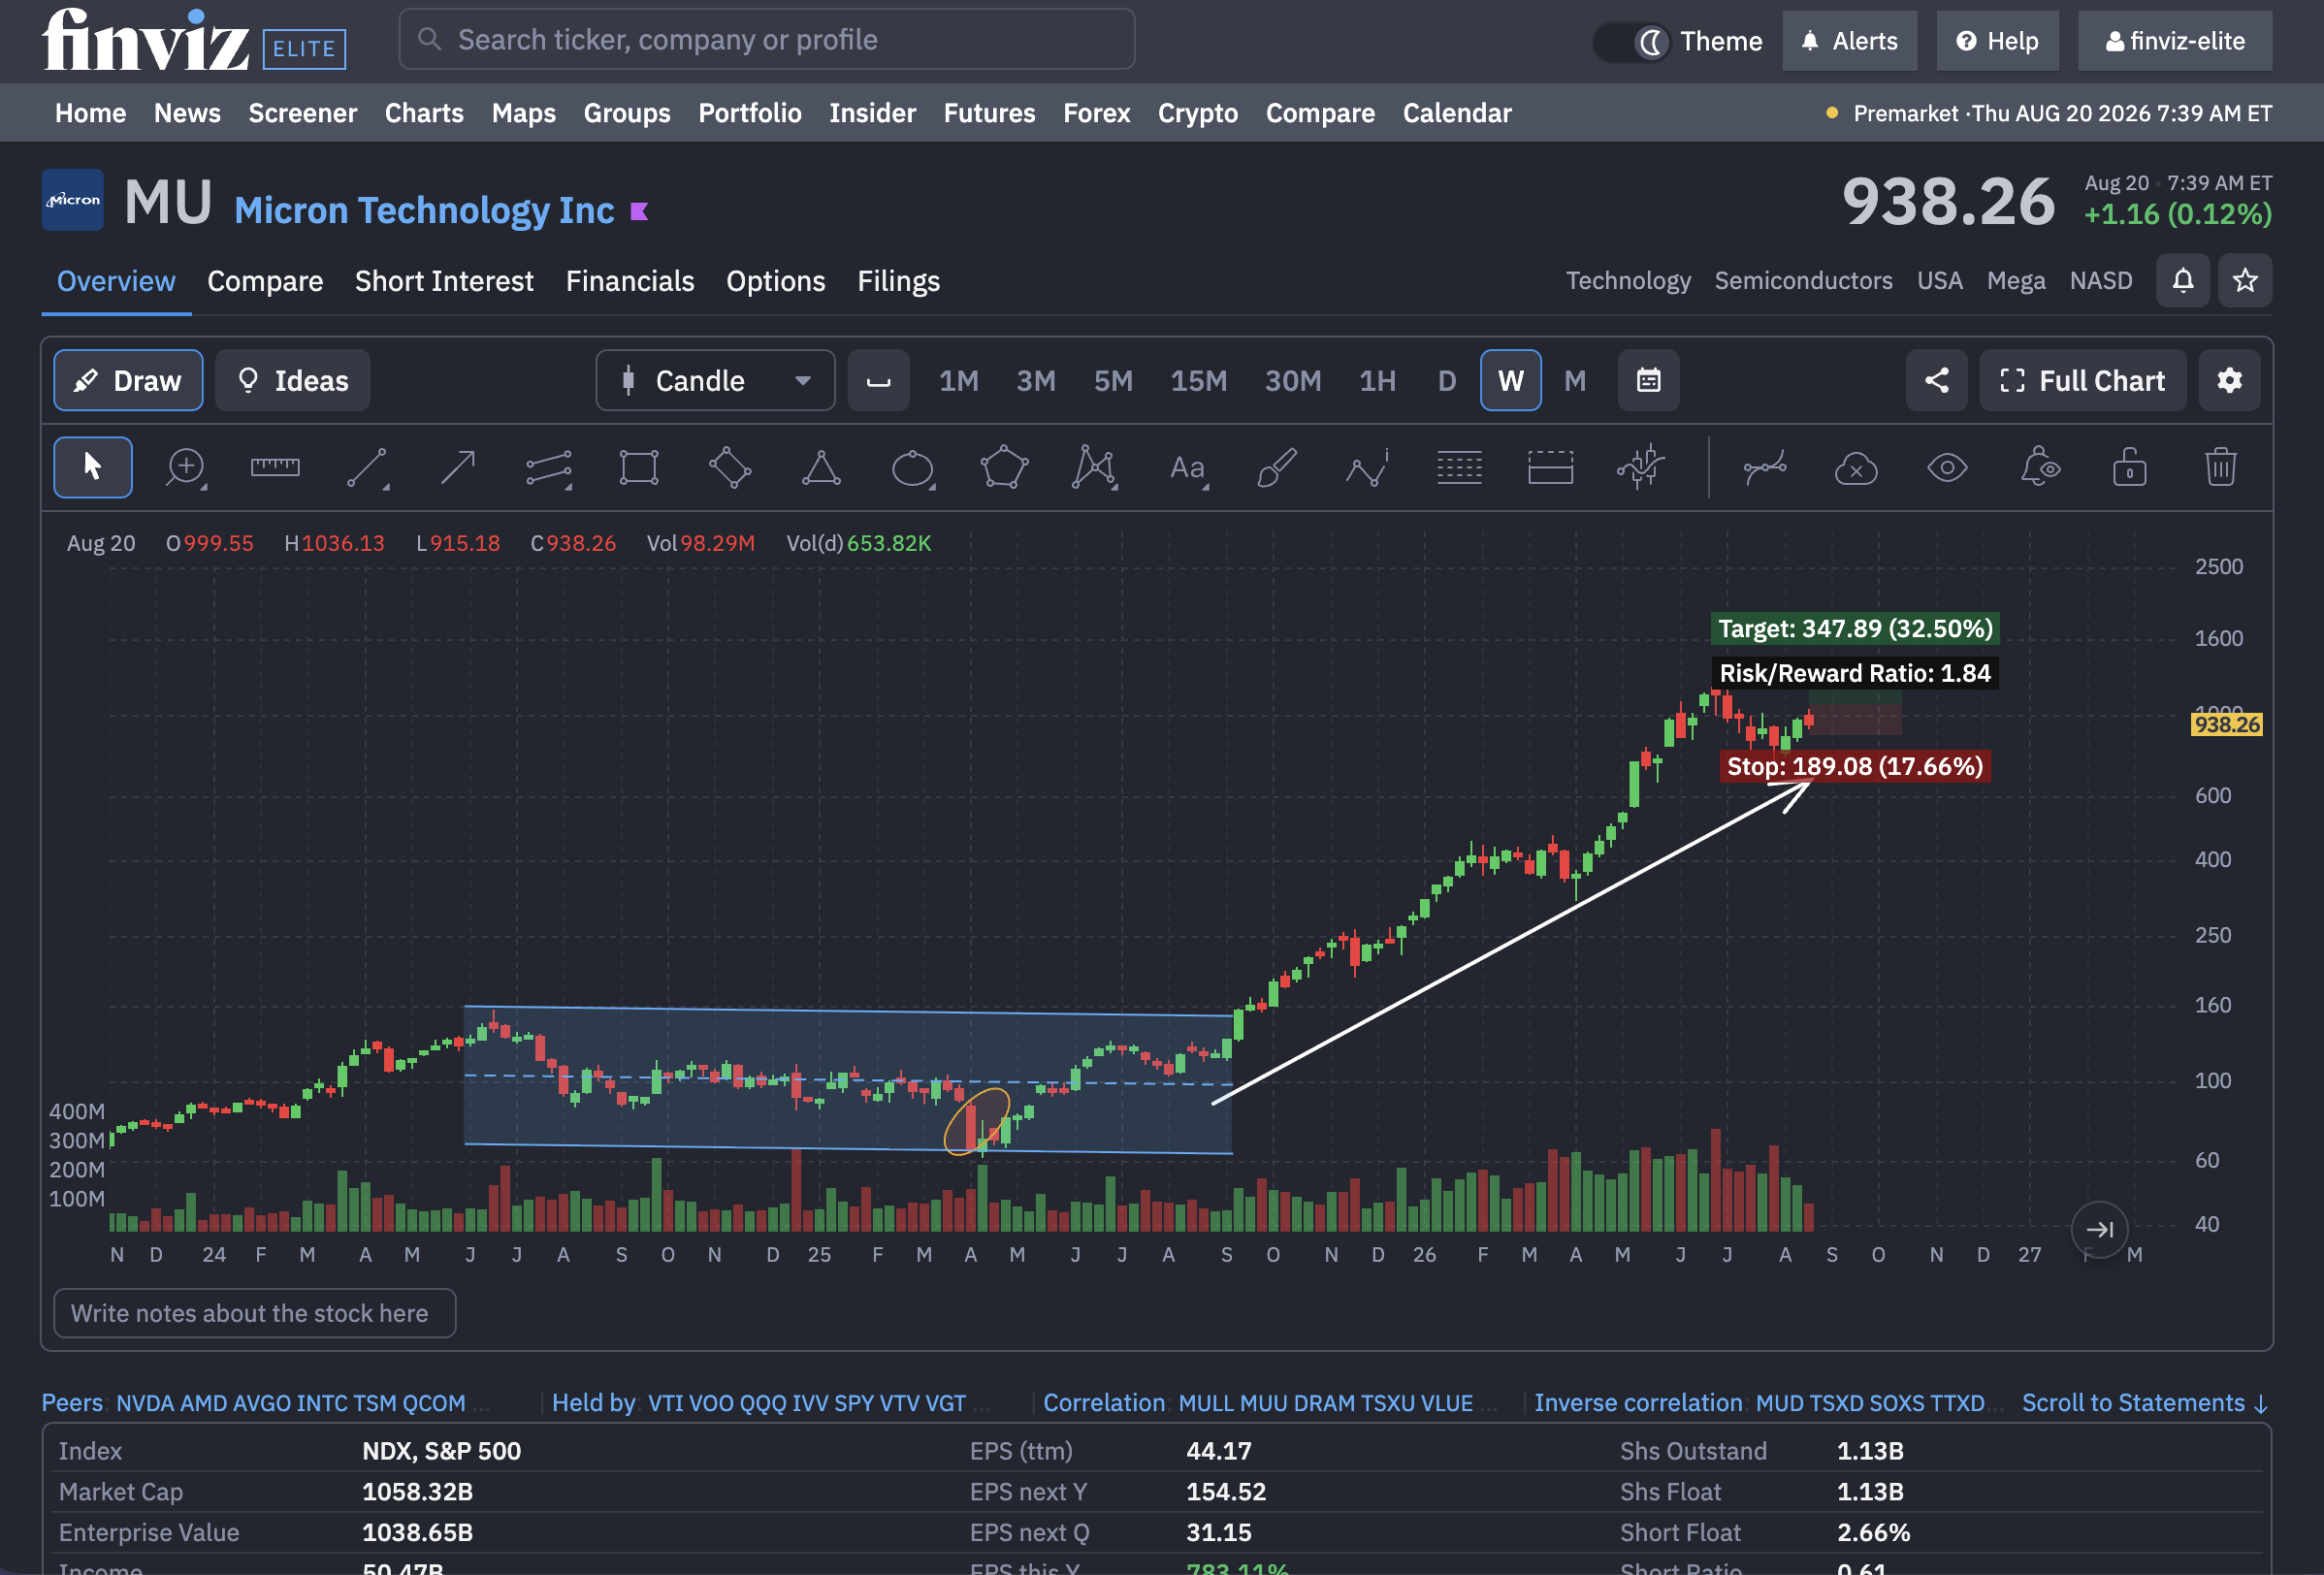
Timeframe and range controls are no longer buried inside the experience. They are visible when you need them, helping you move quickly from short-term price action to a broader historical view.
The current price is also presented prominently in both the header and chart, so you can immediately connect the latest move with the larger technical structure.
Research the Market With Less Friction
The redesigned Finviz asset pages are built around a simple goal: make important information easier to see and powerful tools easier to use.
Open any Finviz stock page, explore the new navigation, expand the chart, create an alert, and start organizing your ideas with Color Flags. Whether you follow one market or move between several, the new unified experience gives you a faster and more focused way to research what matters.