


We've created a new tool called Find Similar Charts that makes discovering charts that match your desired pattern instantaneous.
Find a chart you like, click the Find Similar Charts button, and we'll find matching charts just like it. Here’s how it works:
Find the Same Setup Across the Market
The Find Similar Charts panel is available on the right side of Finviz charts.
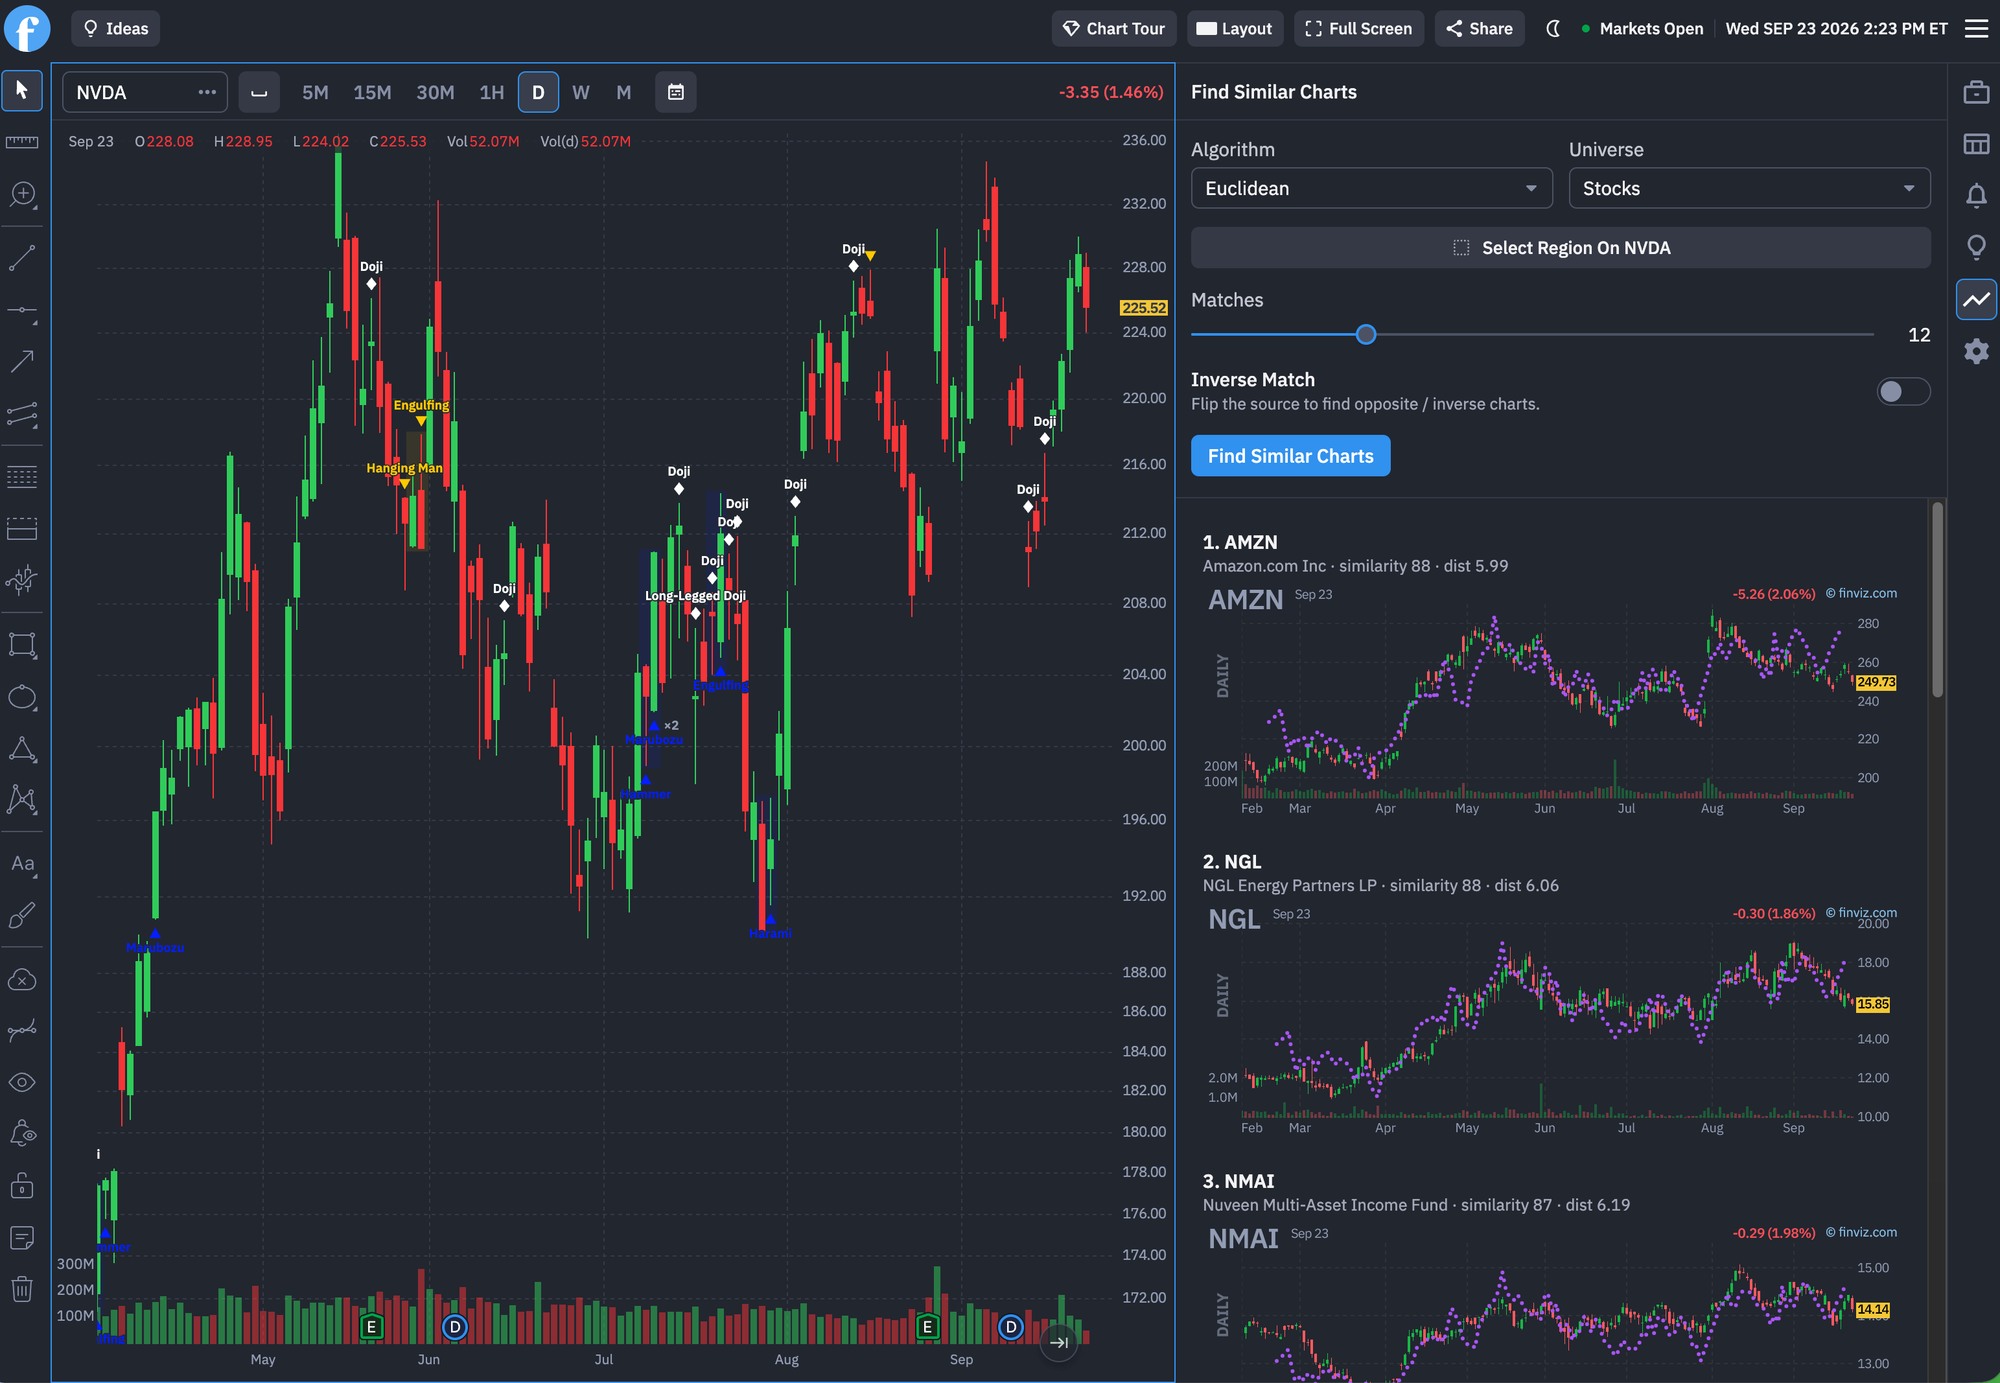
To get started, first open a chart on our full screen Advanced Charts that's caught your attention. For example, if NVDA is forming a price structure you want to track, you can use that chart as the source and our new Find Similar Charts feature will search for similar patterns.
On the screenshot below, you can see we're looking at a chart of NVDIA while on the right we can see similar charts such as AMZN, NGL, and more:
Select The Algorithm You Need
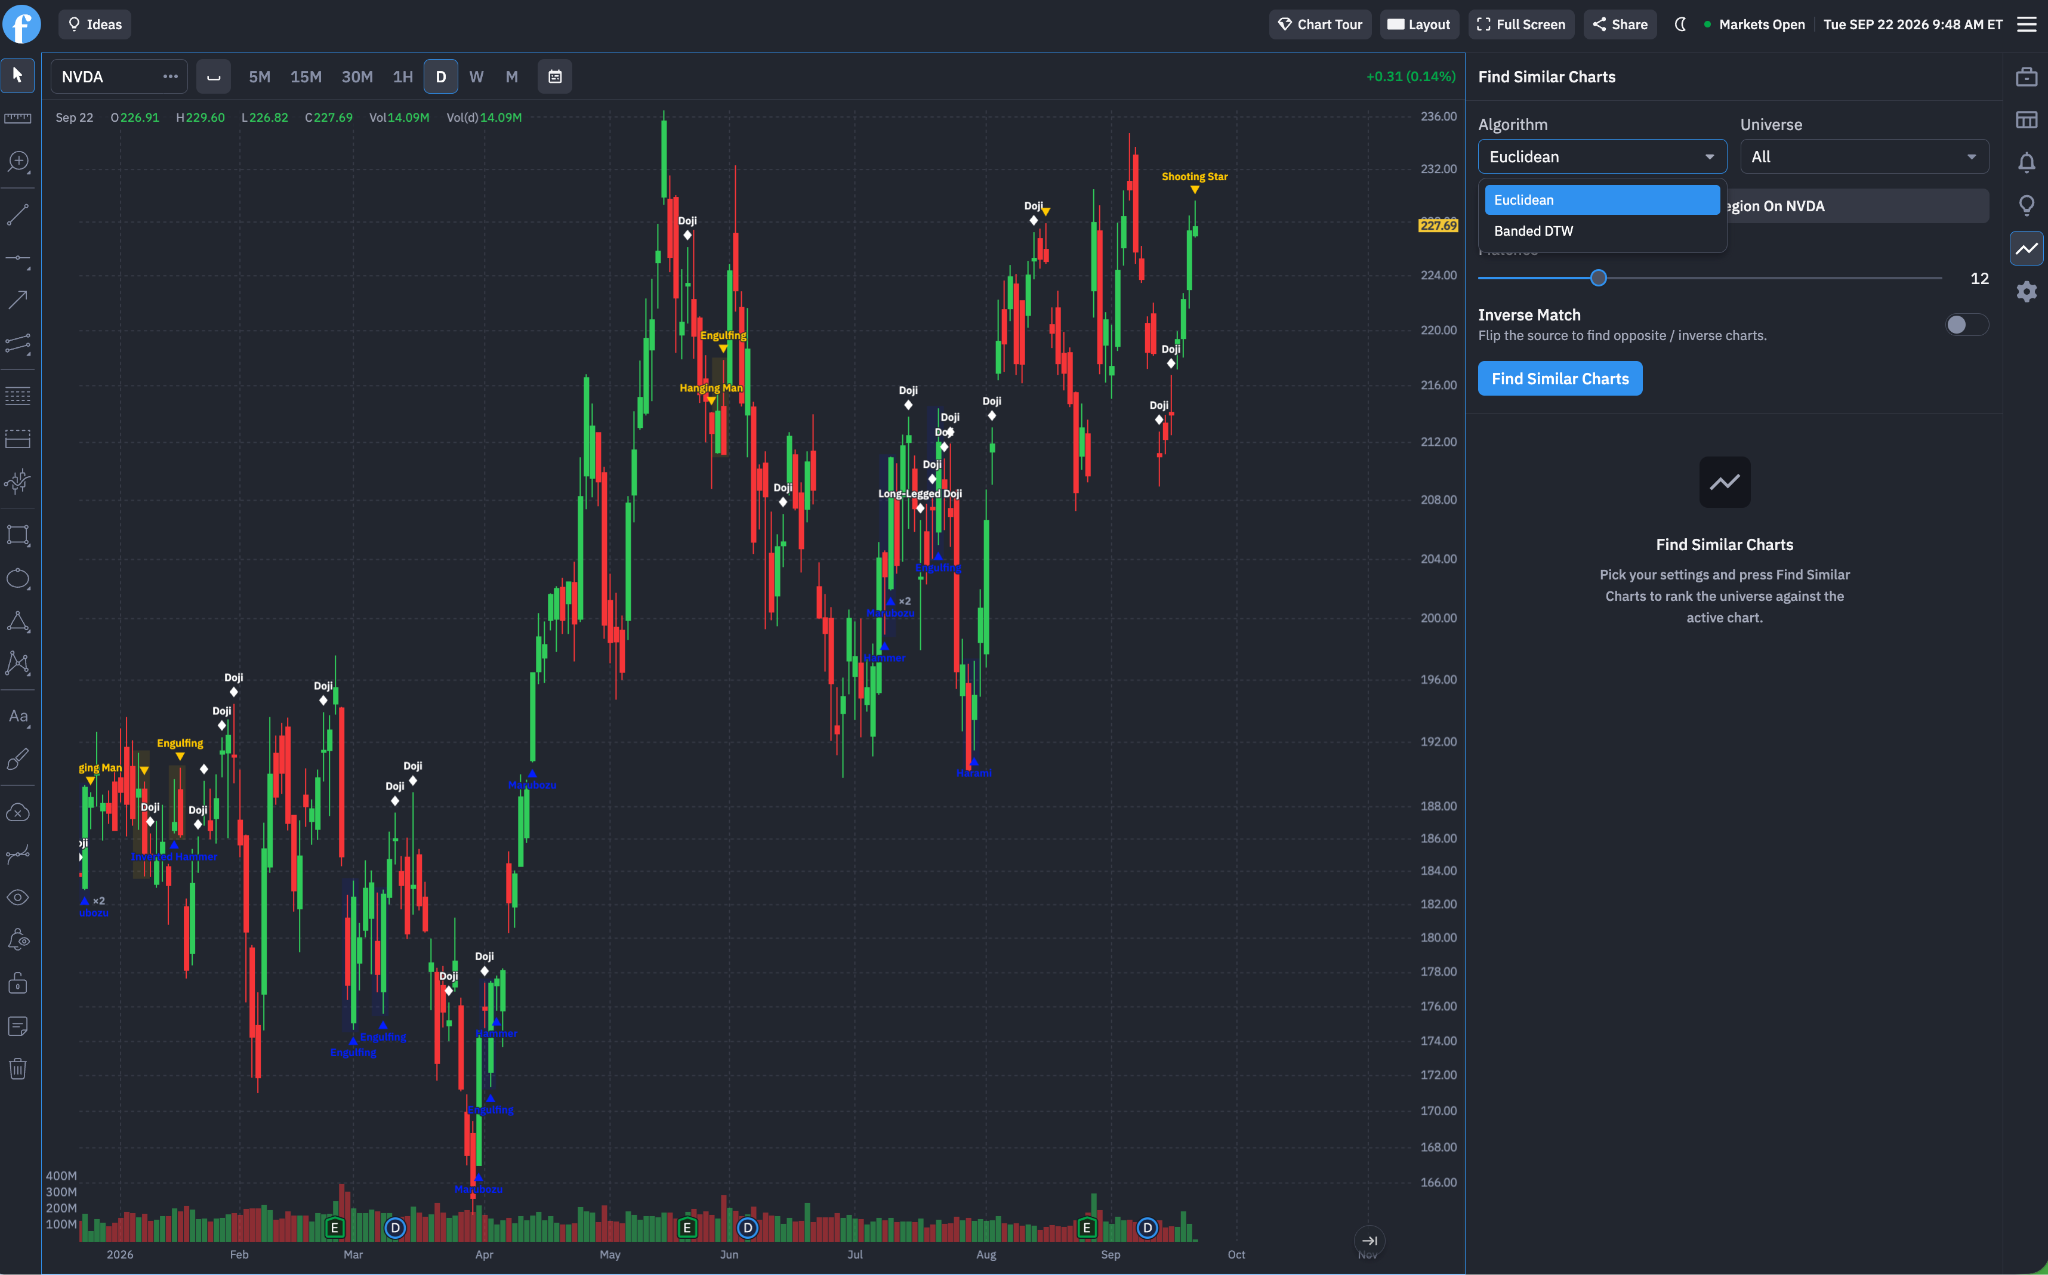
We currently provide two chart-matching options and you have the control to select either:
- Euclidean: Looks for charts whose price patterns line up closely at the same points in time. Use it when you want the shape and timing of the move to match.
- Banded DTW: Looks for the same general pattern while allowing parts of it to unfold a little faster or slower. The “band” limits how far the timing can shift, so the matches still follow a similar sequence.
These give users different ways to compare the source chart with potential matches. The dropdown menu is shown here on the right-hand side:
You do not need to change the algorithm every time. But having multiple methods gives traders more control over how the similarity search is performed.
Try both when researching a setup and compare the results.
Search Stocks, ETFs, or Both
The Universe setting determines where Finviz looks for matches. You can search:
- Stocks only
- ETFs only
- Both choices together
This can be useful when the pattern matters more than the ticker itself or if there are matching tickers. For example, in the image below we are searching for ETFs that match the current daily pattern of NVDA and the most close matches are the 2x and 3x NVIDIA ETFs and ETNs:
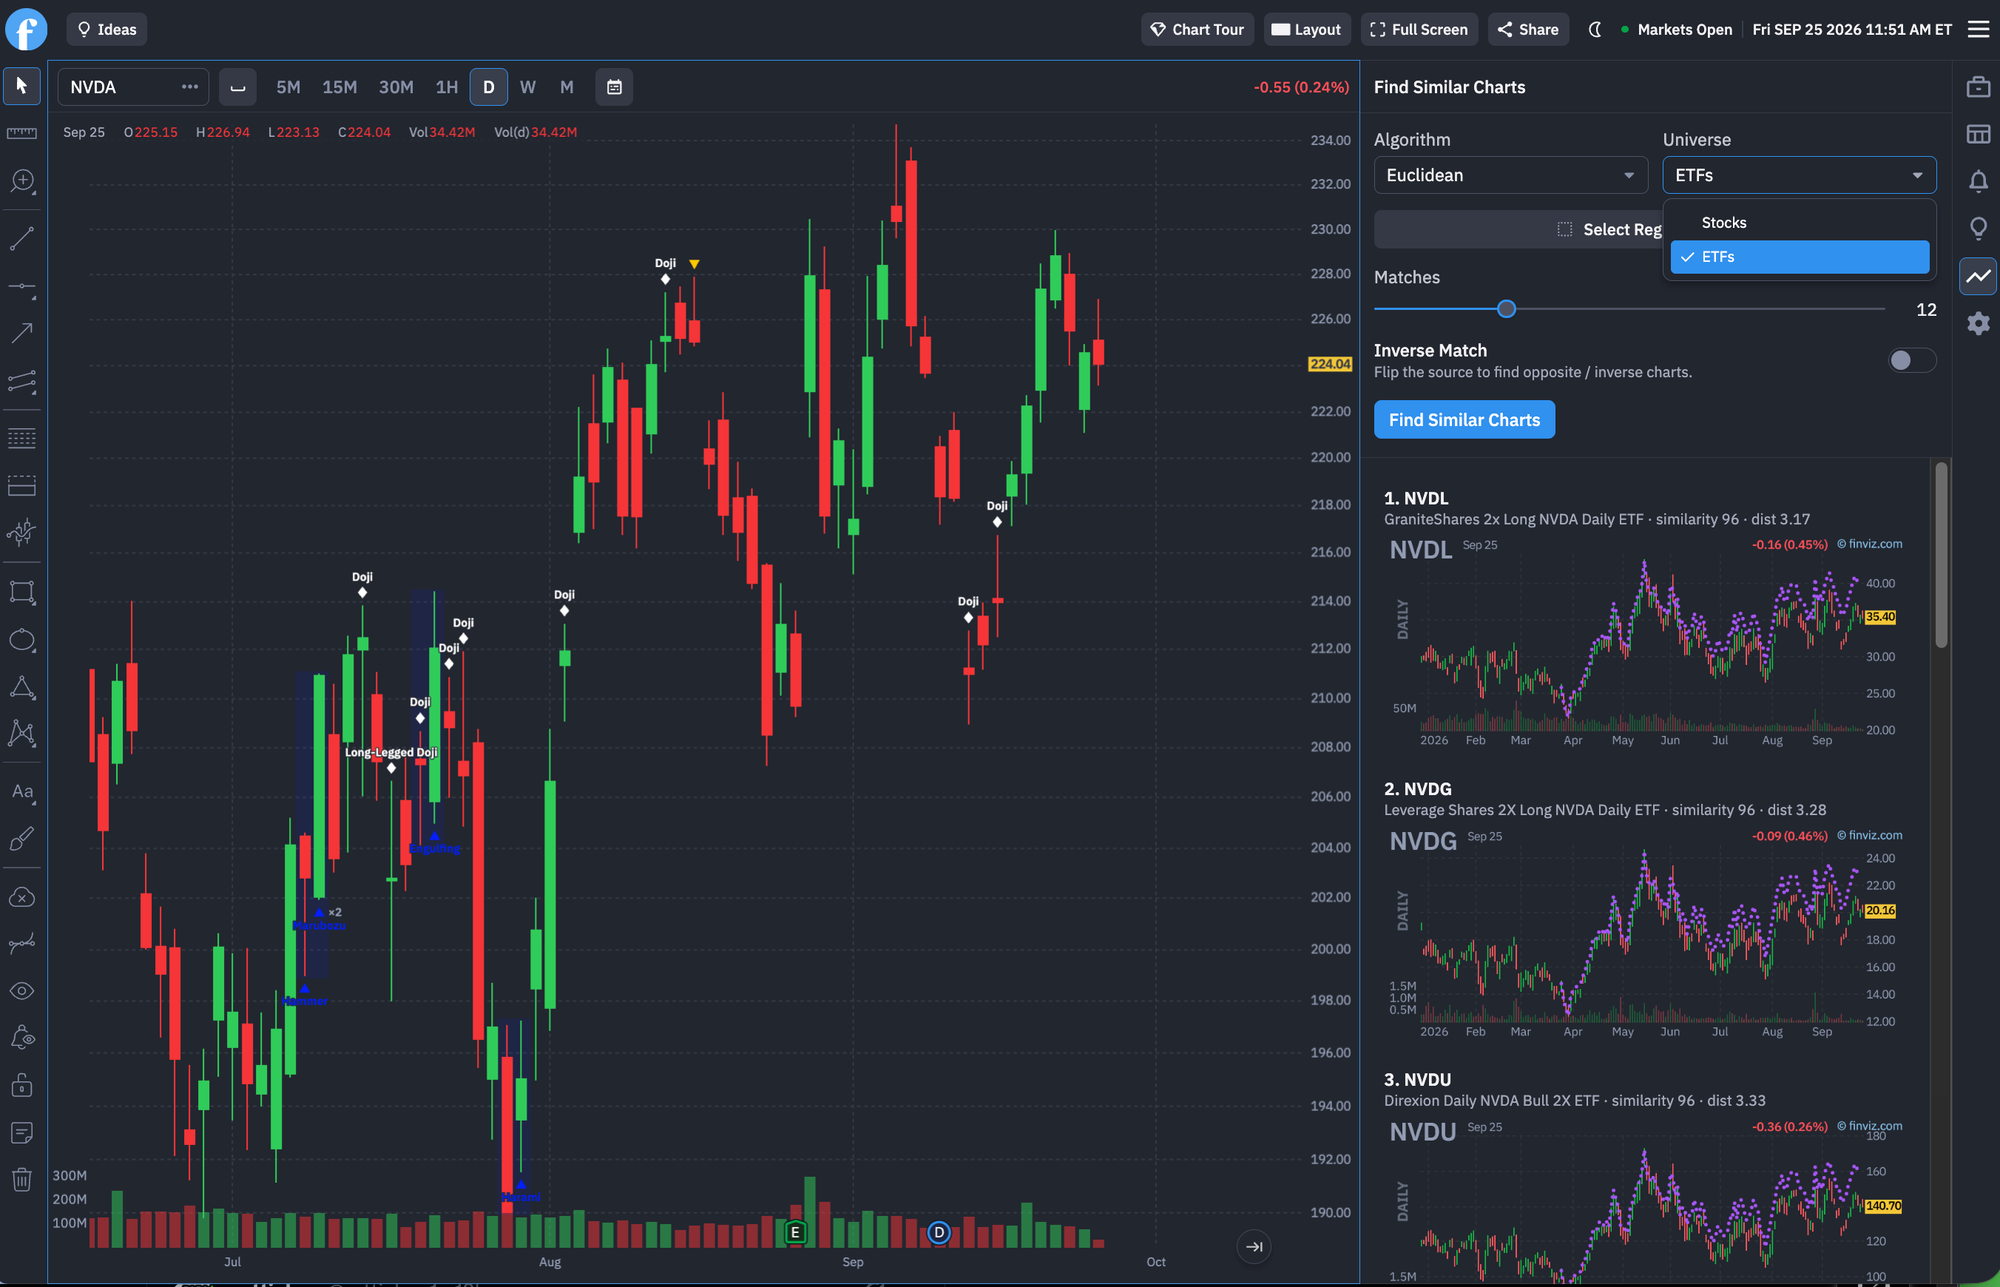
Learning how to find matching charts across stocks, ETFs or both can be become a powerful way to scan different aspects of the market especially related to matching ETFs, leveraged products or deep correlations.
Select the Exact Part of the Chart You Want to Match
One of the most useful features is Select Region.
Click it and highlight the section of the active chart you want Finviz to use as the reference pattern.
Suppose a stock spent several sessions consolidating, broke higher, pulled back, and is now approaching its previous high. In that case, select only that region and then have Find Similar Charts do the hard work.
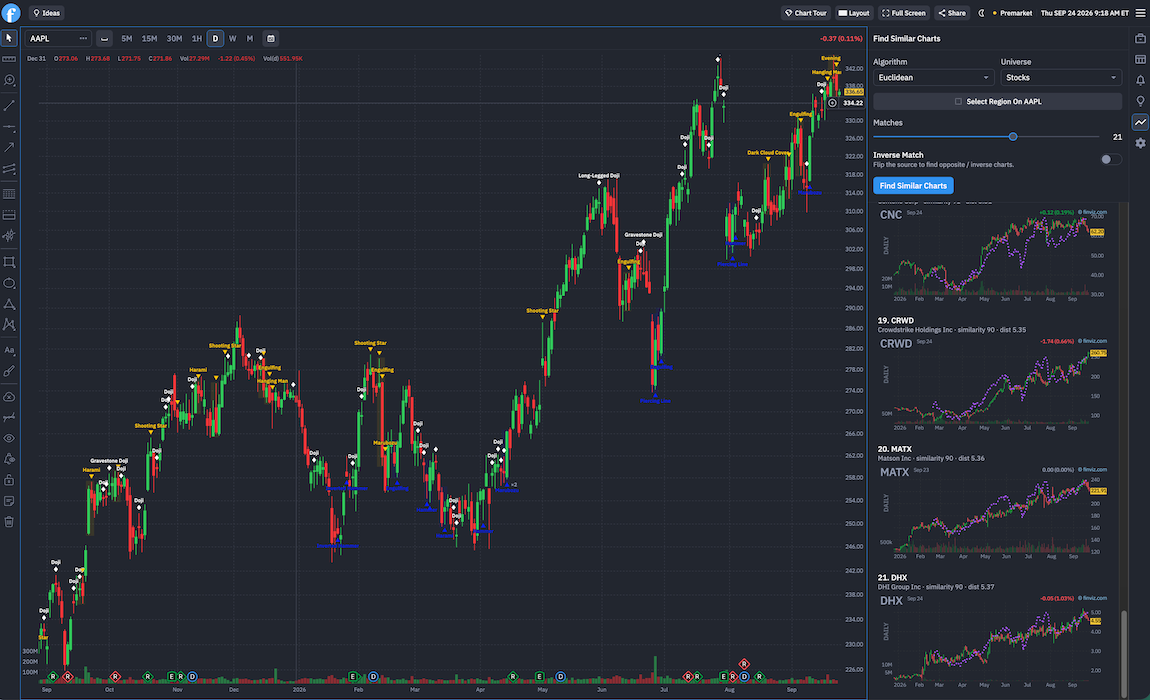
In this example, look how perfectly the region we selected on Apple here matches the charts on the right hand side:
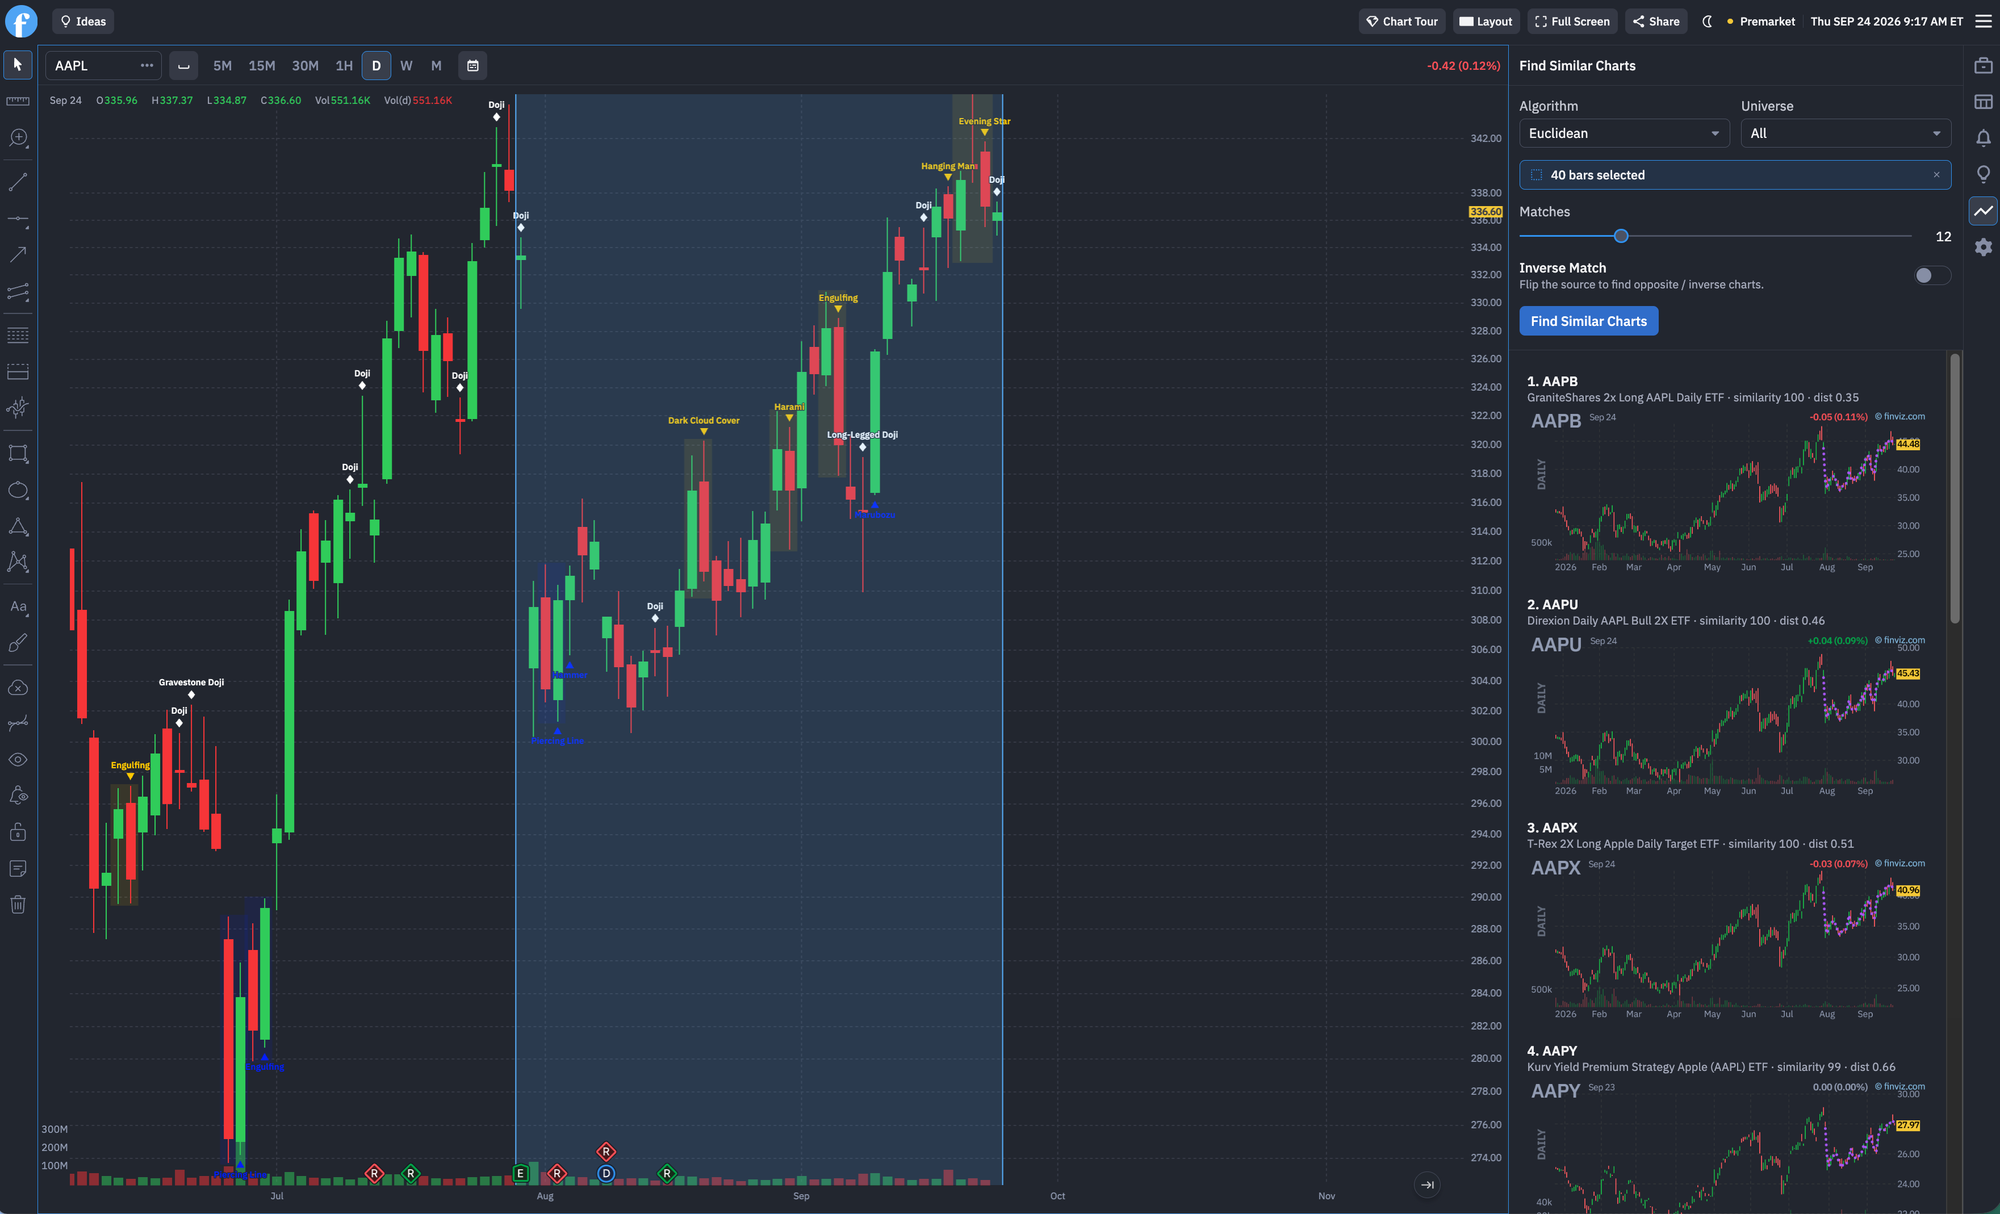
This makes the search much more focused. It also makes it detailed and specific to your needs.
Control How Many Matches You Want to See
The Matches setting lets you adjust how many similar charts Finviz returns.
A smaller number gives you a tighter group to review. Increasing it lets you explore more possible matches. Here, in this screenshot, we've asked for 21 chart matches and in a matter of seconds they are presented to us on the right-hand side:
From there, traders can go through the results and compare things such as:
- Trend structure
- Recent highs and lows
- Breakouts and pullbacks
- Consolidation patterns
- Support and resistance areas
- Where the current price sits within the setup
The tool finds the visual similarities. You can then decide which charts deserve further research.
Find the Opposite Setup With Inverse Match
Sometimes you do not want another chart moving the same way.
You want the opposite.
This is how traders can create perfect pair trades or mean reversion strategies.
That is where Inverse Match comes in.
Turn it on and Finviz flips the source pattern when searching for matches. Now it's looking for the opposite of what you want.
For example, if your original chart shows a strong bullish structure, Inverse Match can help surface charts showing a similar structure in the opposite direction like this:
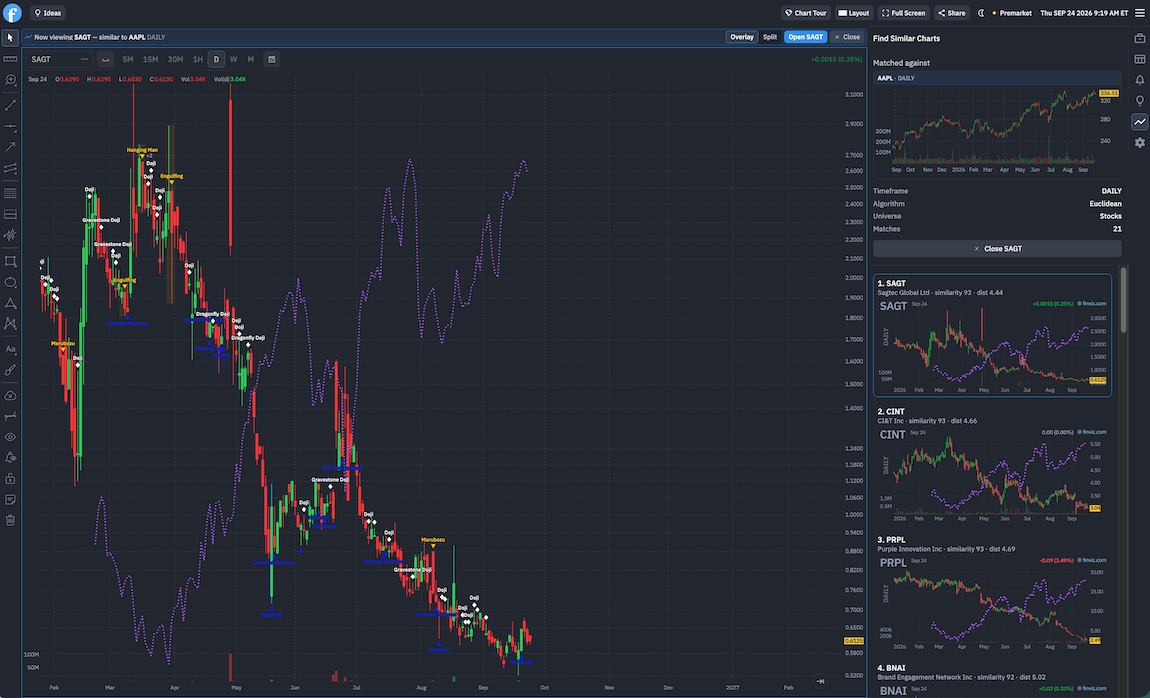
In other words, the same chart can become the starting point for searching in both directions. Additionally, you can see the charts overlaid on each other one as the original candlestick chart and the other as a dotted line. Visualize them both on the same chart or split them into two separate charts.
We feel strongly that the Find Inverse Charts is a powerful tool that the best traders will utilize to their advantage.
Start With a Setup, Not a Ticker
Traditional screening usually starts with conditions. You might search for stocks above a moving average, near a 52-week high, trading above a certain volume level, or meeting specific fundamental criteria.
Find Similar Charts adds another approach.
Start with a chart pattern you already see.
Then ask Finviz: What else looks like this right now?
We're excited to see all the ways traders use this new feature.
Finviz Team