


With a single click, your Finviz Elite membership can now identify, label, and show every meaningful candlestick on the chart you're looking at.
This new Automatic Candlestick Pattern Detection tool is now live on our Advanced Charting interface. It allows traders to move between intraday, daily, weekly, and monthly timeframes while spotting specific candlesticks at the speed of light:
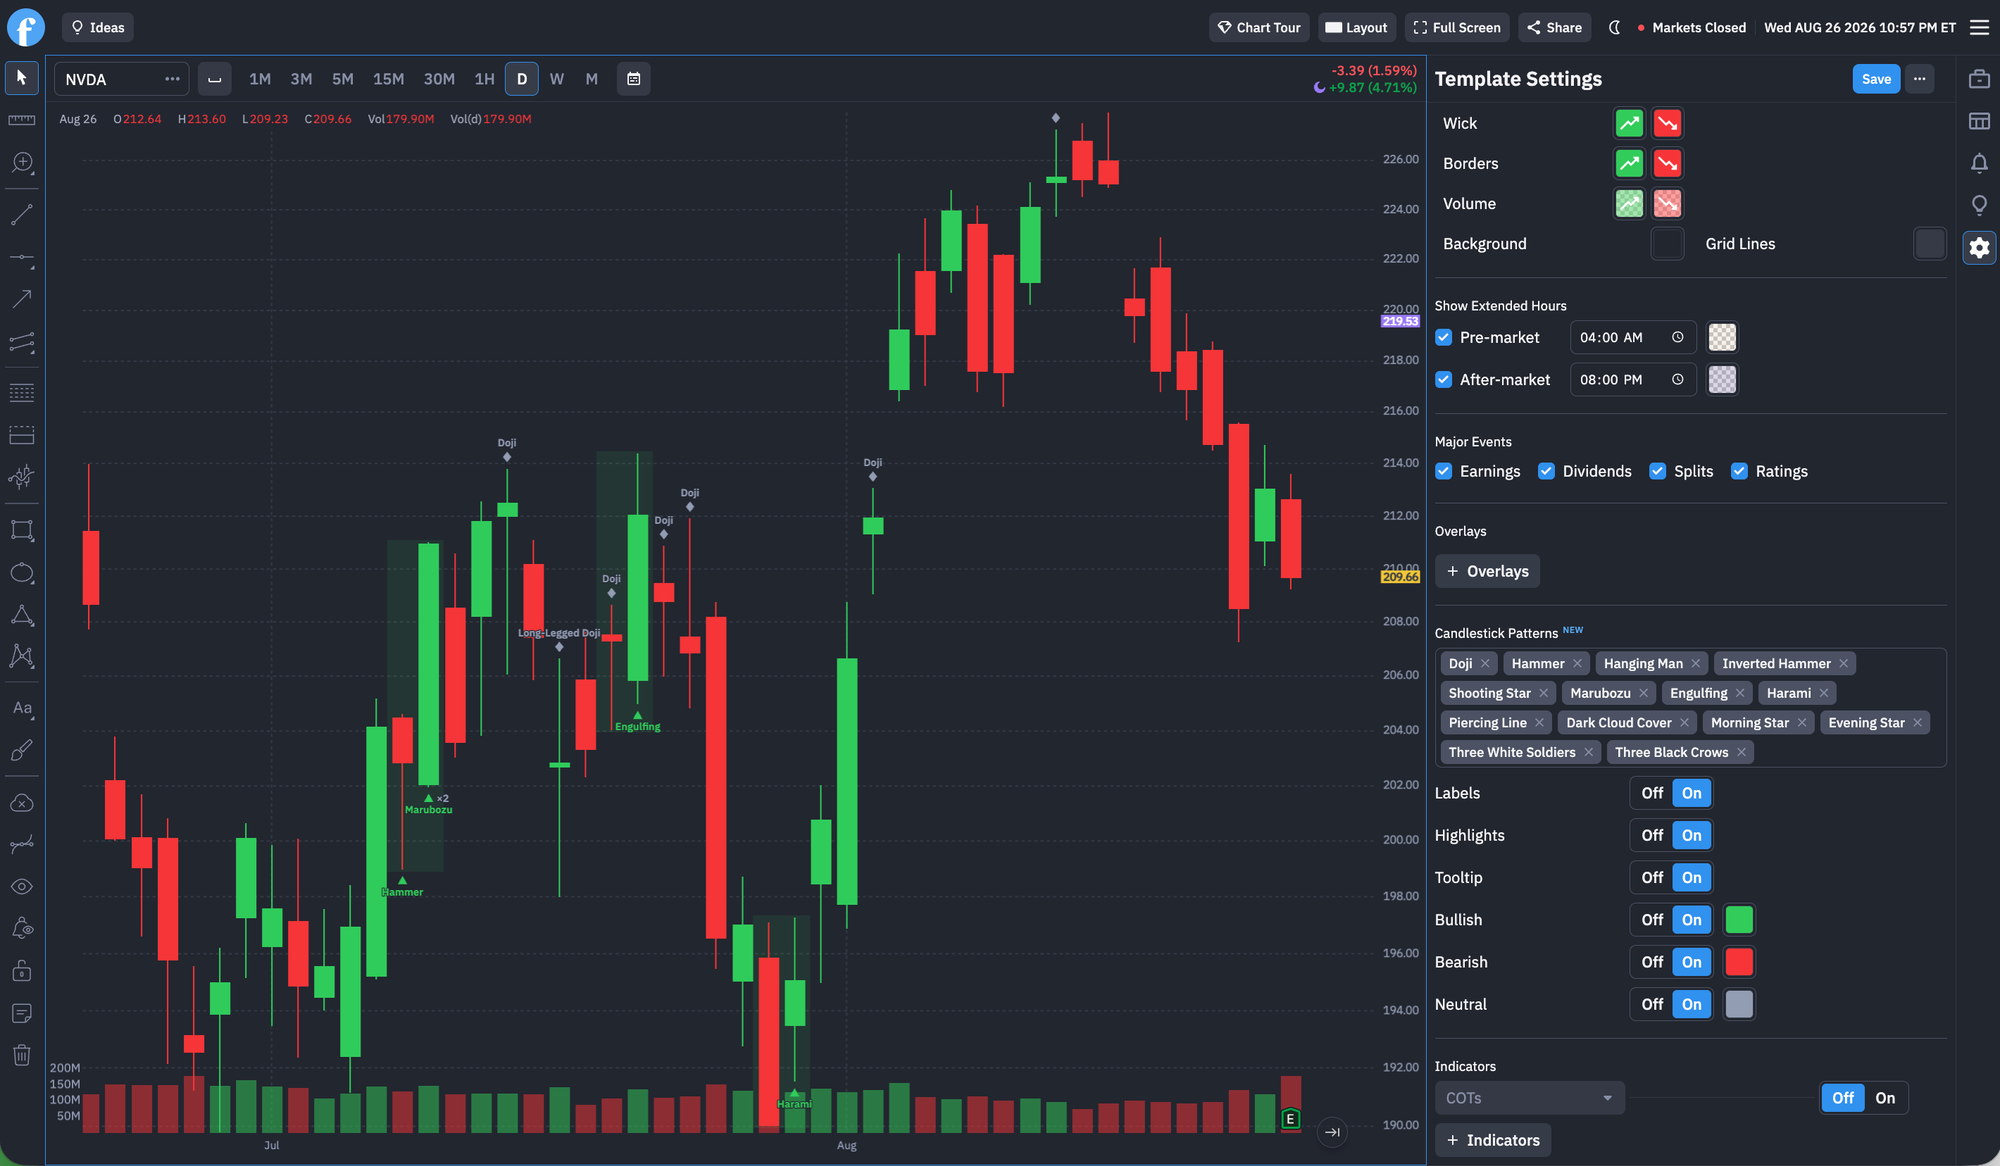
Detect 14 Different Candlestick Patterns – Instantly
Elite members can now automatically detect 14 widely followed candlestick patterns once their chart is open:
- Doji
- Hammer
- Hanging Man
- Inverted Hammer
- Shooting Star
- Marubozu
- Engulfing
- Harami
- Piercing Line
- Dark Cloud Cover
- Morning Star
- Evening Star
- Three White Soldiers
- Three Black Crows
Traders can use this tool to spot patterns they prefer to trade or to act as a fact checker of their work. Think you've spotted a Doji candlestick? Turn on Automatic Candlestick Pattern Detection to confirm.
Detect Candles on Any Timeframe
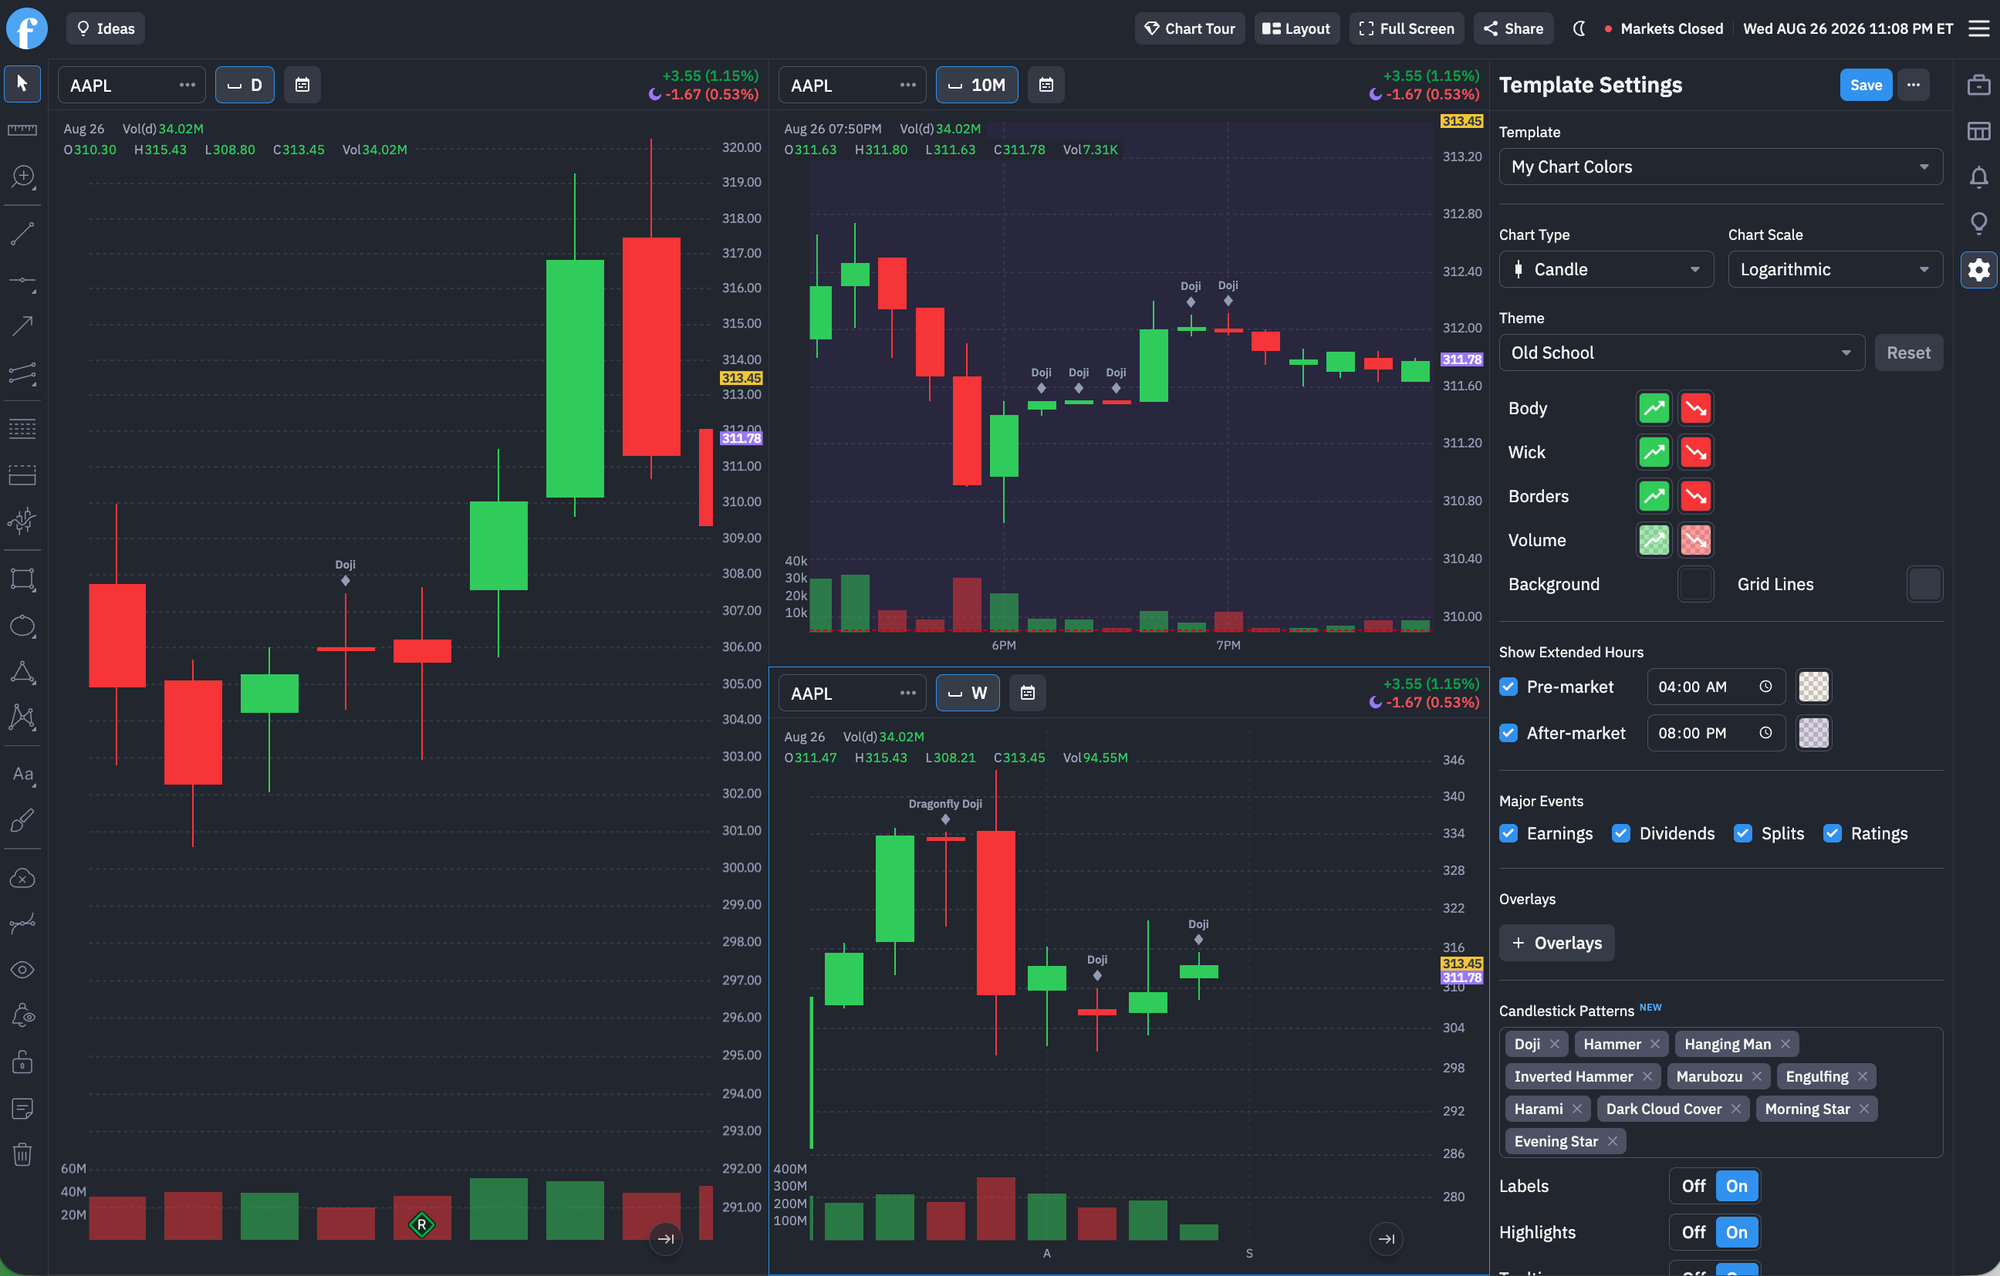
Our Automatic Candlestick Detection tool works across all timeframes. Move from short-term price action to the bigger picture while keeping your selected patterns active.
This creates a faster way to study how specific patterns form across different intervals without repeatedly redrawing, rescanning, or reconfiguring the chart.
On the multiple chart layout you see below, we have three different timeframes of Apple (Daily, Weekly, and 10-minute) all with our Automatic Candlestick Detection turned on:
Customize Your Candlestick Experience
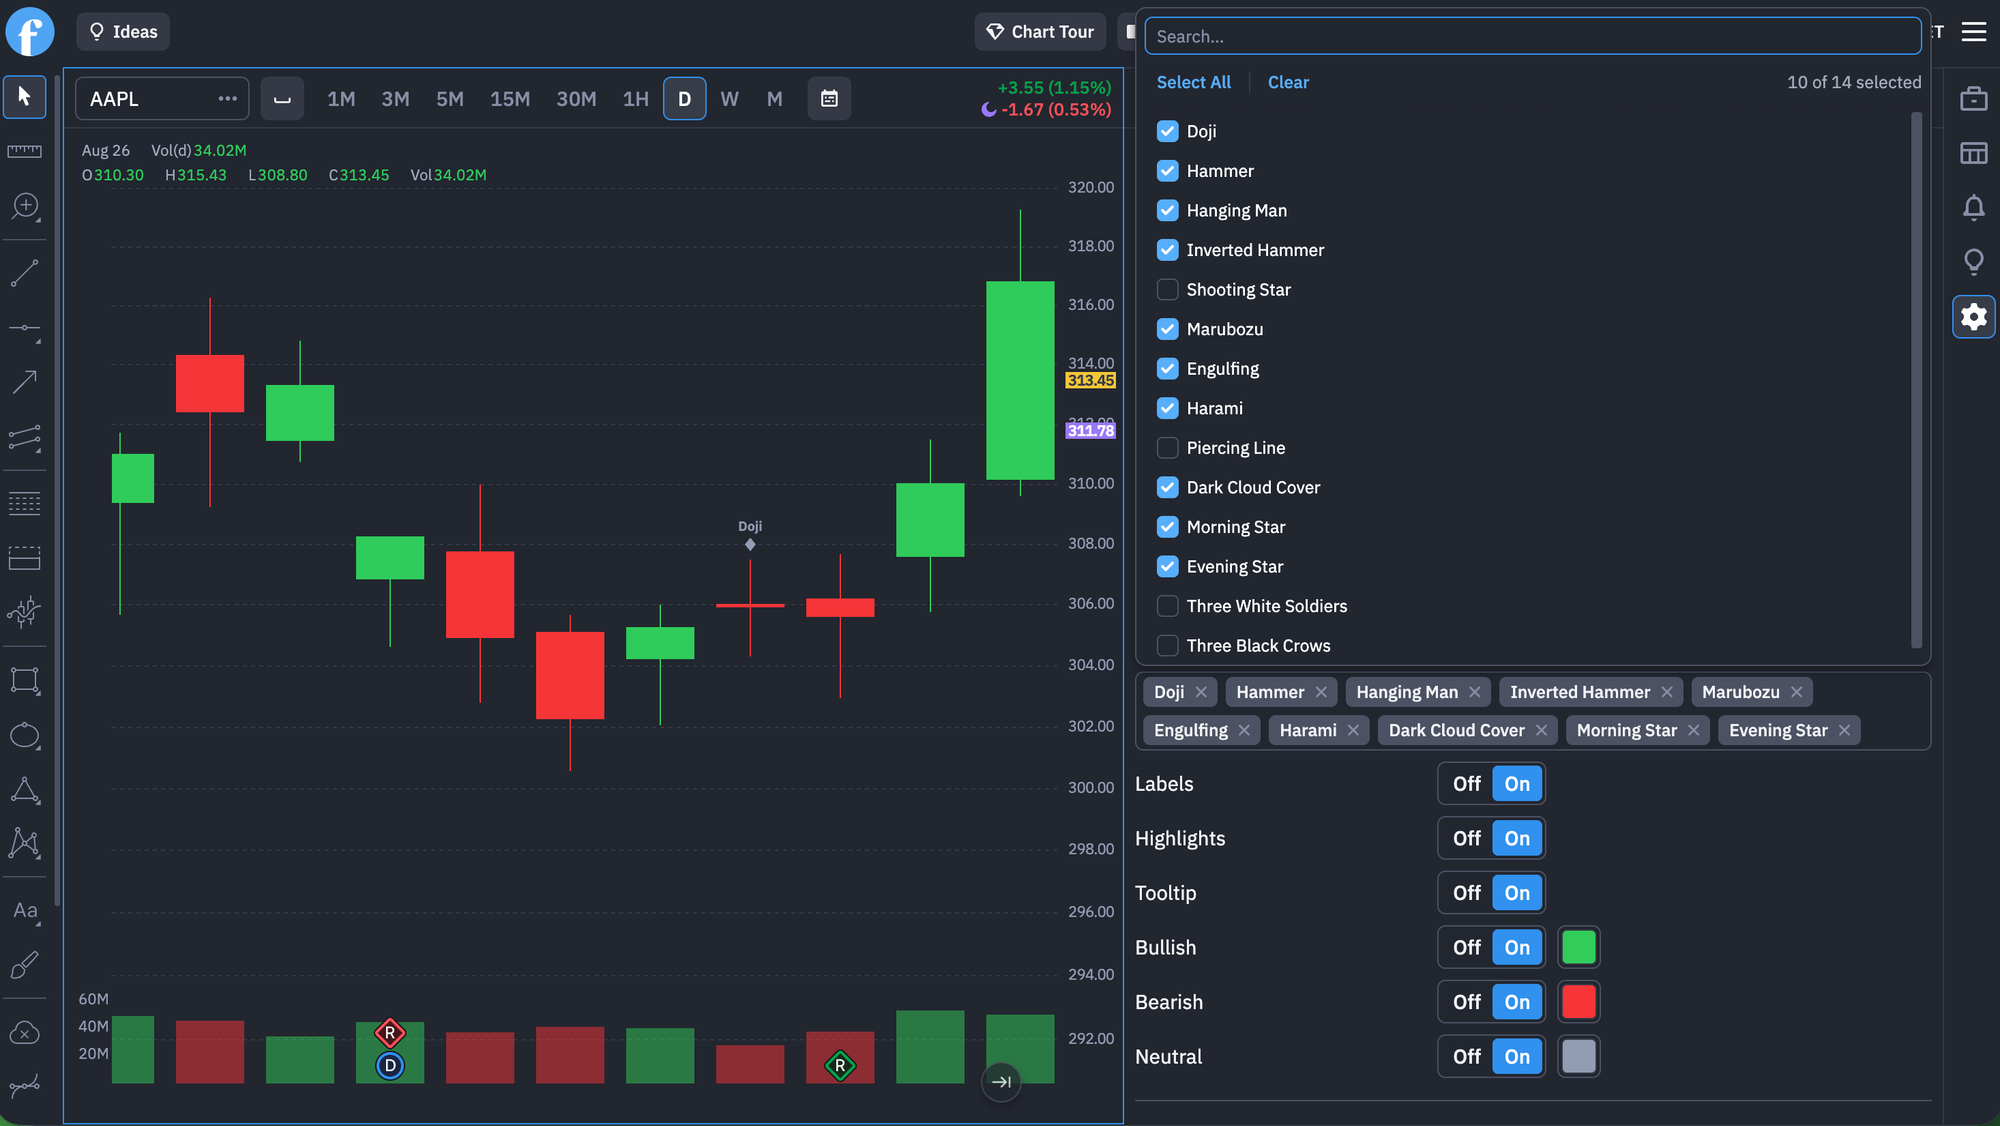
Our Candlestick Detection is fully customizable inside the Template Settings. Elite members can do the following once they begin using the tool:
- Turn pattern labels on or off
- Highlight the candles where patterns appear
- Enable tooltips for additional context
- Show or hide bullish, bearish, and neutral patterns
- Customize the colors used for each category
- Search for and select specific patterns
These quick toggles and customizations allow traders to navigate the tool faster and personalize it to their exact look and feel:
A New Way to Chart on Finviz
As most traders know, charts contain hundreds or thousands of candles. And it can grow exponentially if you switch timeframes. Tracking all of this data, and the patterns within them, can become an impossible task. But now, we've turned that visual history into something you can scan in seconds.
Open a chart, select the candlestick patterns you want to track, and let your Finviz Elite plan surface them automatically.
We're excited to see how everyone uses this new tool and thanks for reading!
Finviz Team