


Earnings can move a stock in seconds, and now, Finviz members can see earnings results alongside a company’s ticker symbol as soon as they’re reported.
This release marks a major step forward for Finviz because of what it means: real-time earnings data is now sourced directly from company SEC filings and specifically for Finviz members. As soon as a filing becomes available, we process the results and display them on the company’s stock page. No more scrolling through social media feeds or searching news posts for the numbers. They’re right in front of you on Finviz.
In this post, we’ll show you how to access the latest results and explore each company’s earnings data in greater detail.
Earnings Results Appear When the SEC Filing Hits
There’s no need to refresh multiple news feeds or wait for the numbers to appear on social media. Earnings results now arrive live.
Earnings data appears directly on each Finviz stock page when the company submits its SEC filing. Hover over the E (Earnings) icon on the chart to view the results, as shown here on Apple’s stock page:
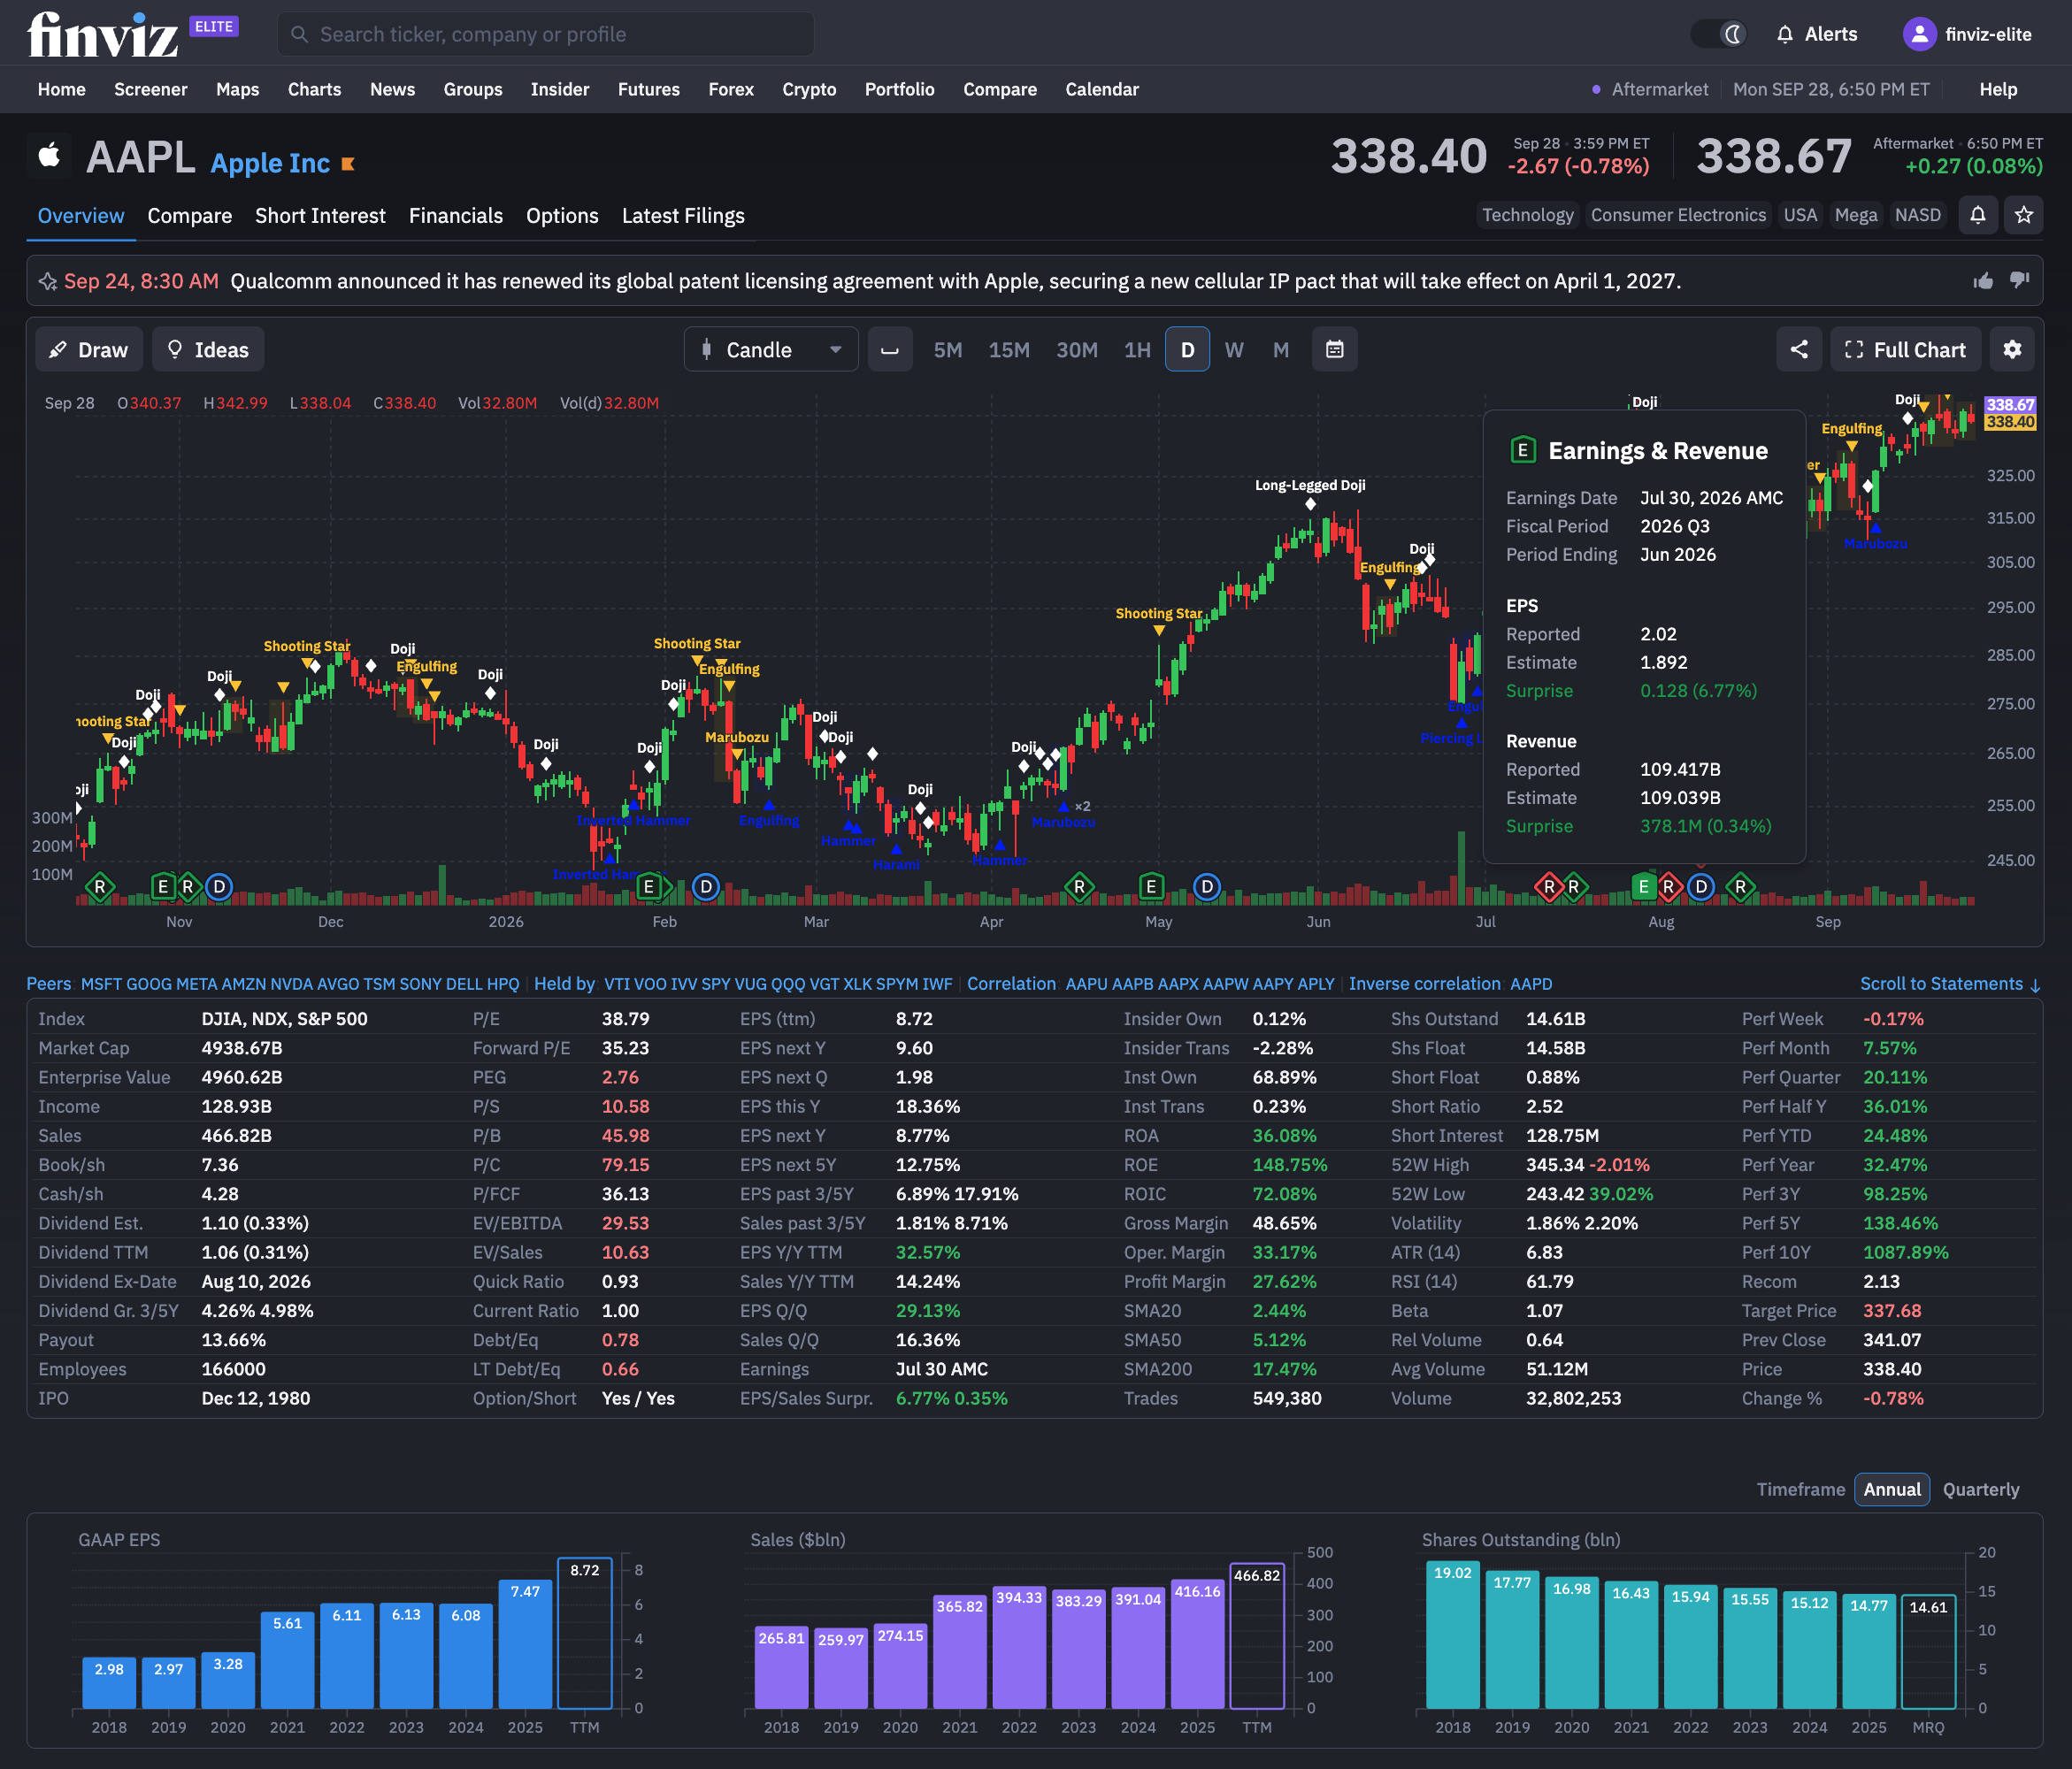
The earnings icon displays data from the company’s SEC filing. When the filing becomes available, Finviz processes the new information and updates the earnings event on the stock page in real time.
Click the earnings event to view the report details without leaving the chart. With earnings results and price action in one place, you can see what the company reported and how the stock reacted.
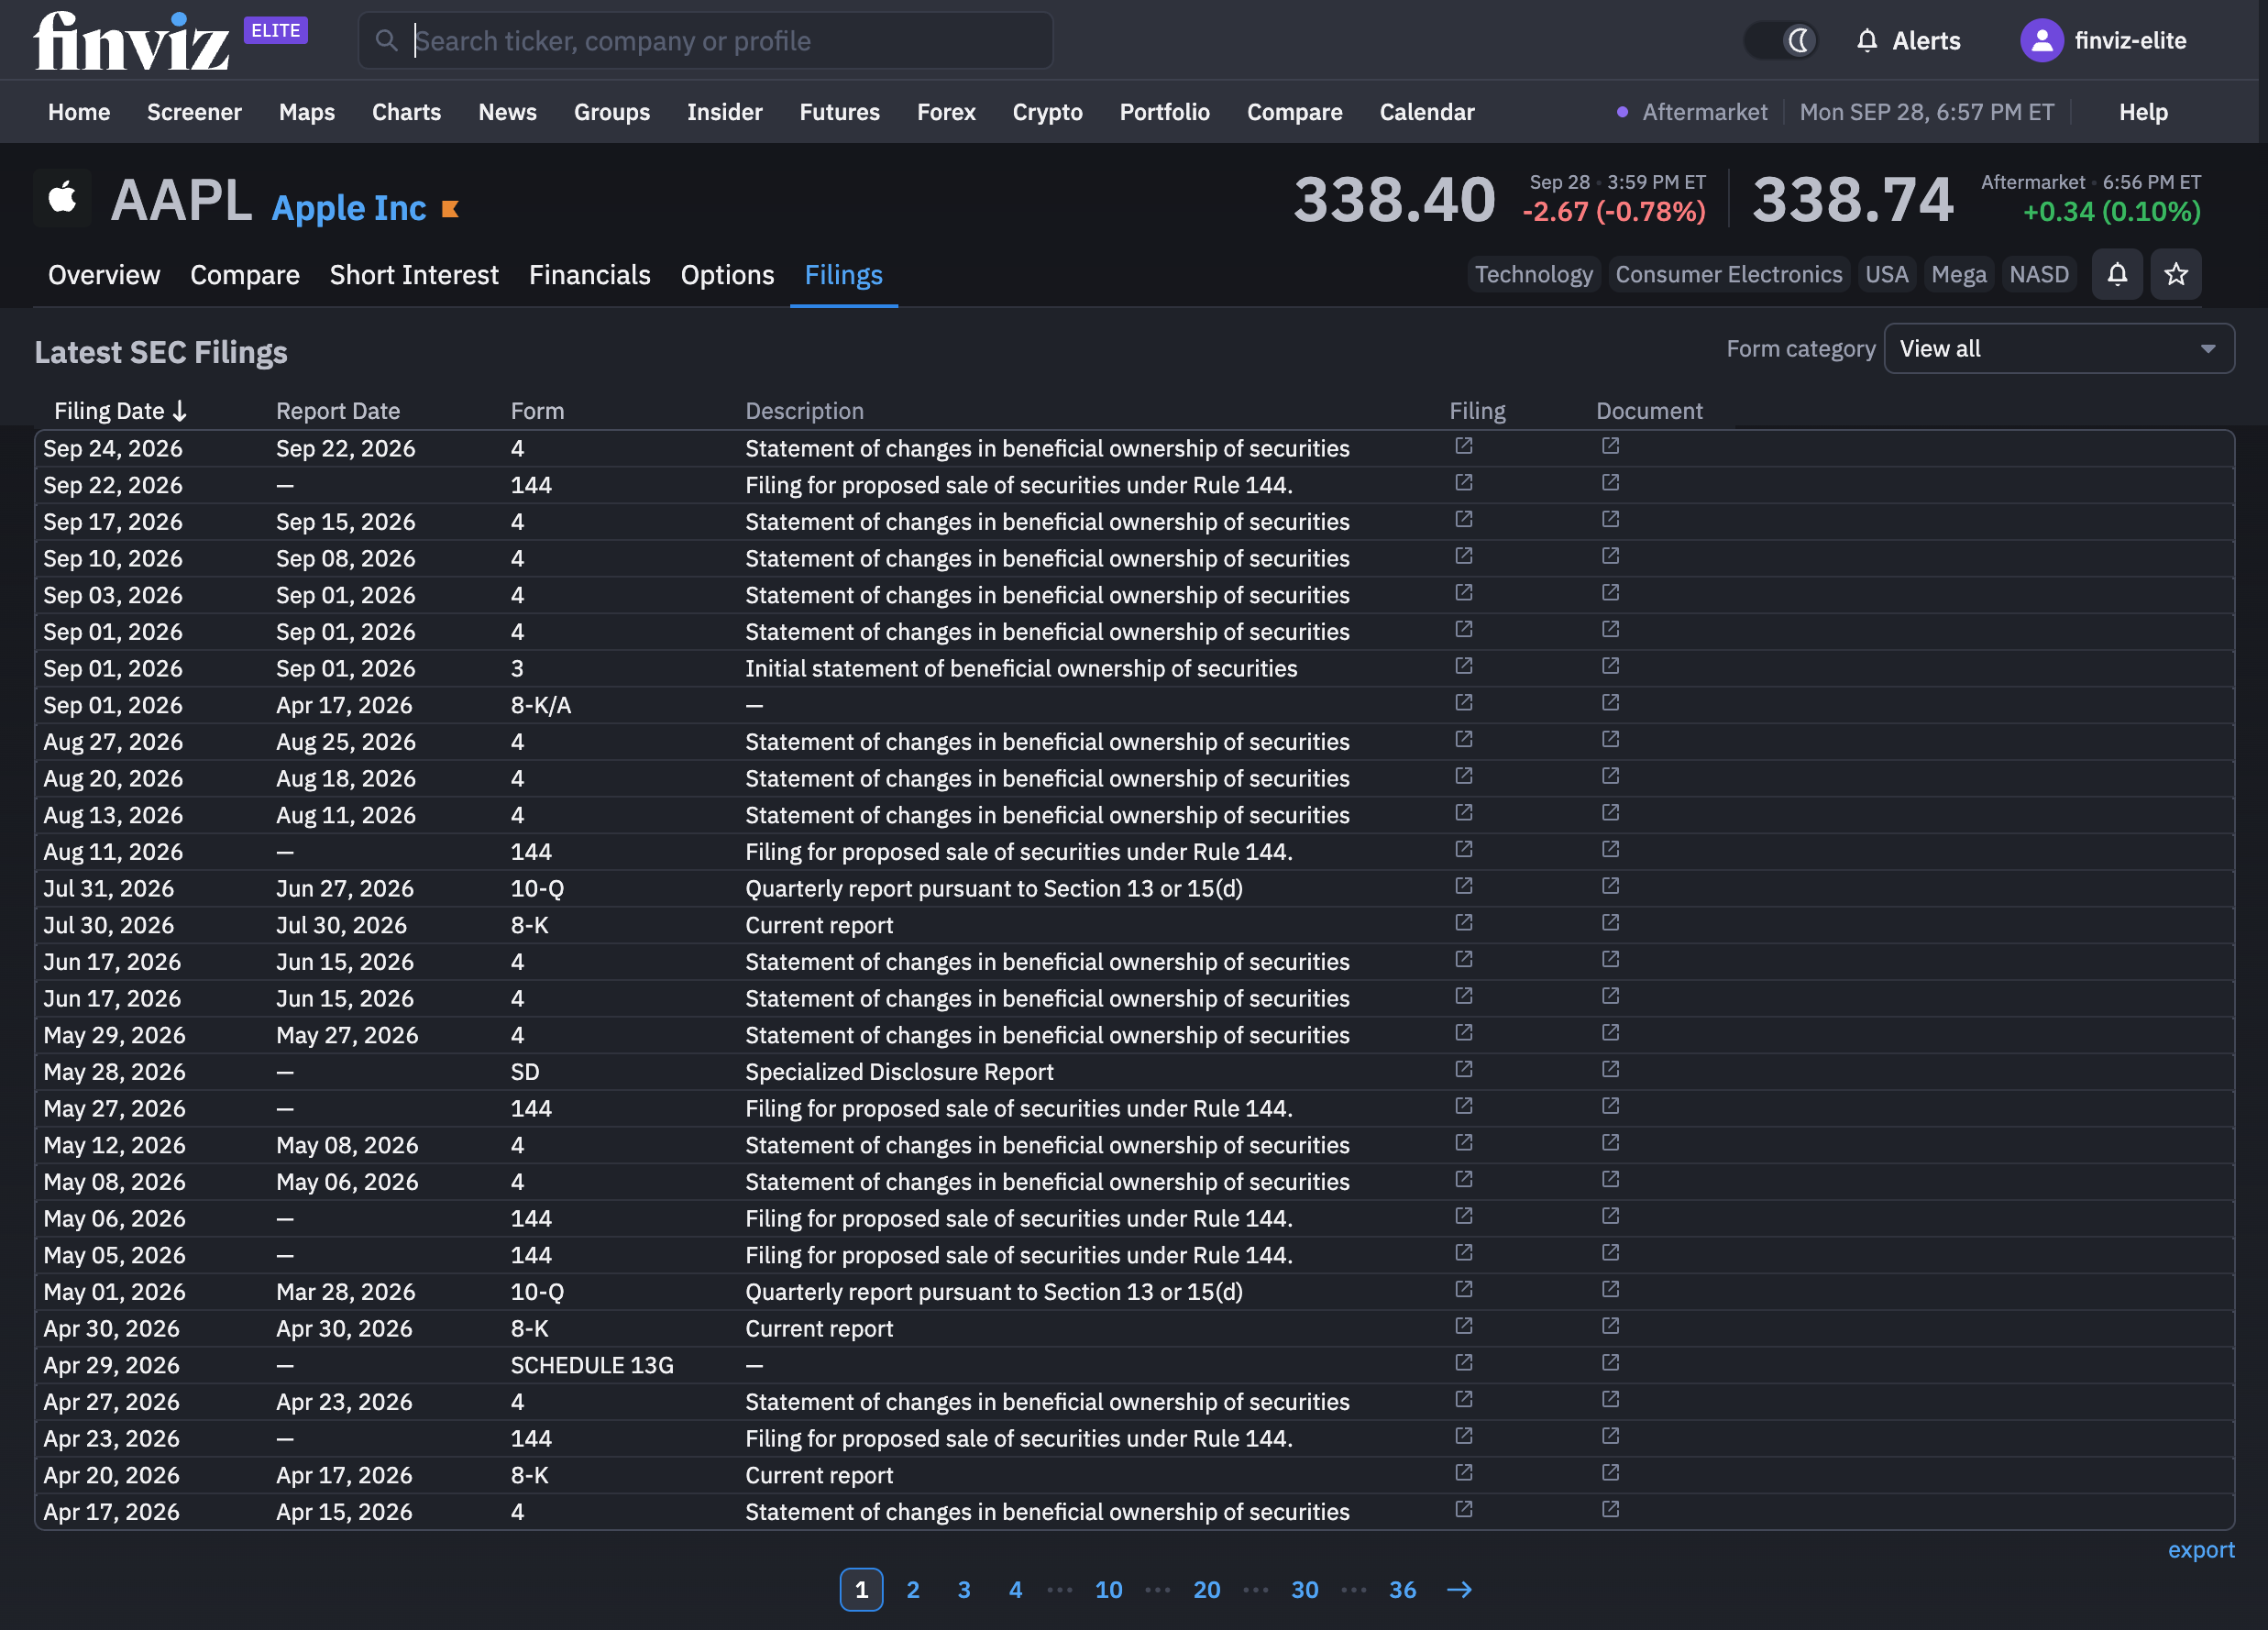
You can also find each company’s SEC filings, including earnings reports, organized on its Latest Filings page. Here’s a look at Apple’s latest filings:
Go Deeper on the Financials of Every Earnings Report
To explore earnings in more detail, open the Financials tab on a company’s stock page and select Earnings. This view also updates in real time when the company’s SEC filing becomes available, displaying the latest results alongside analyst estimates in easy-to-read charts and tables.
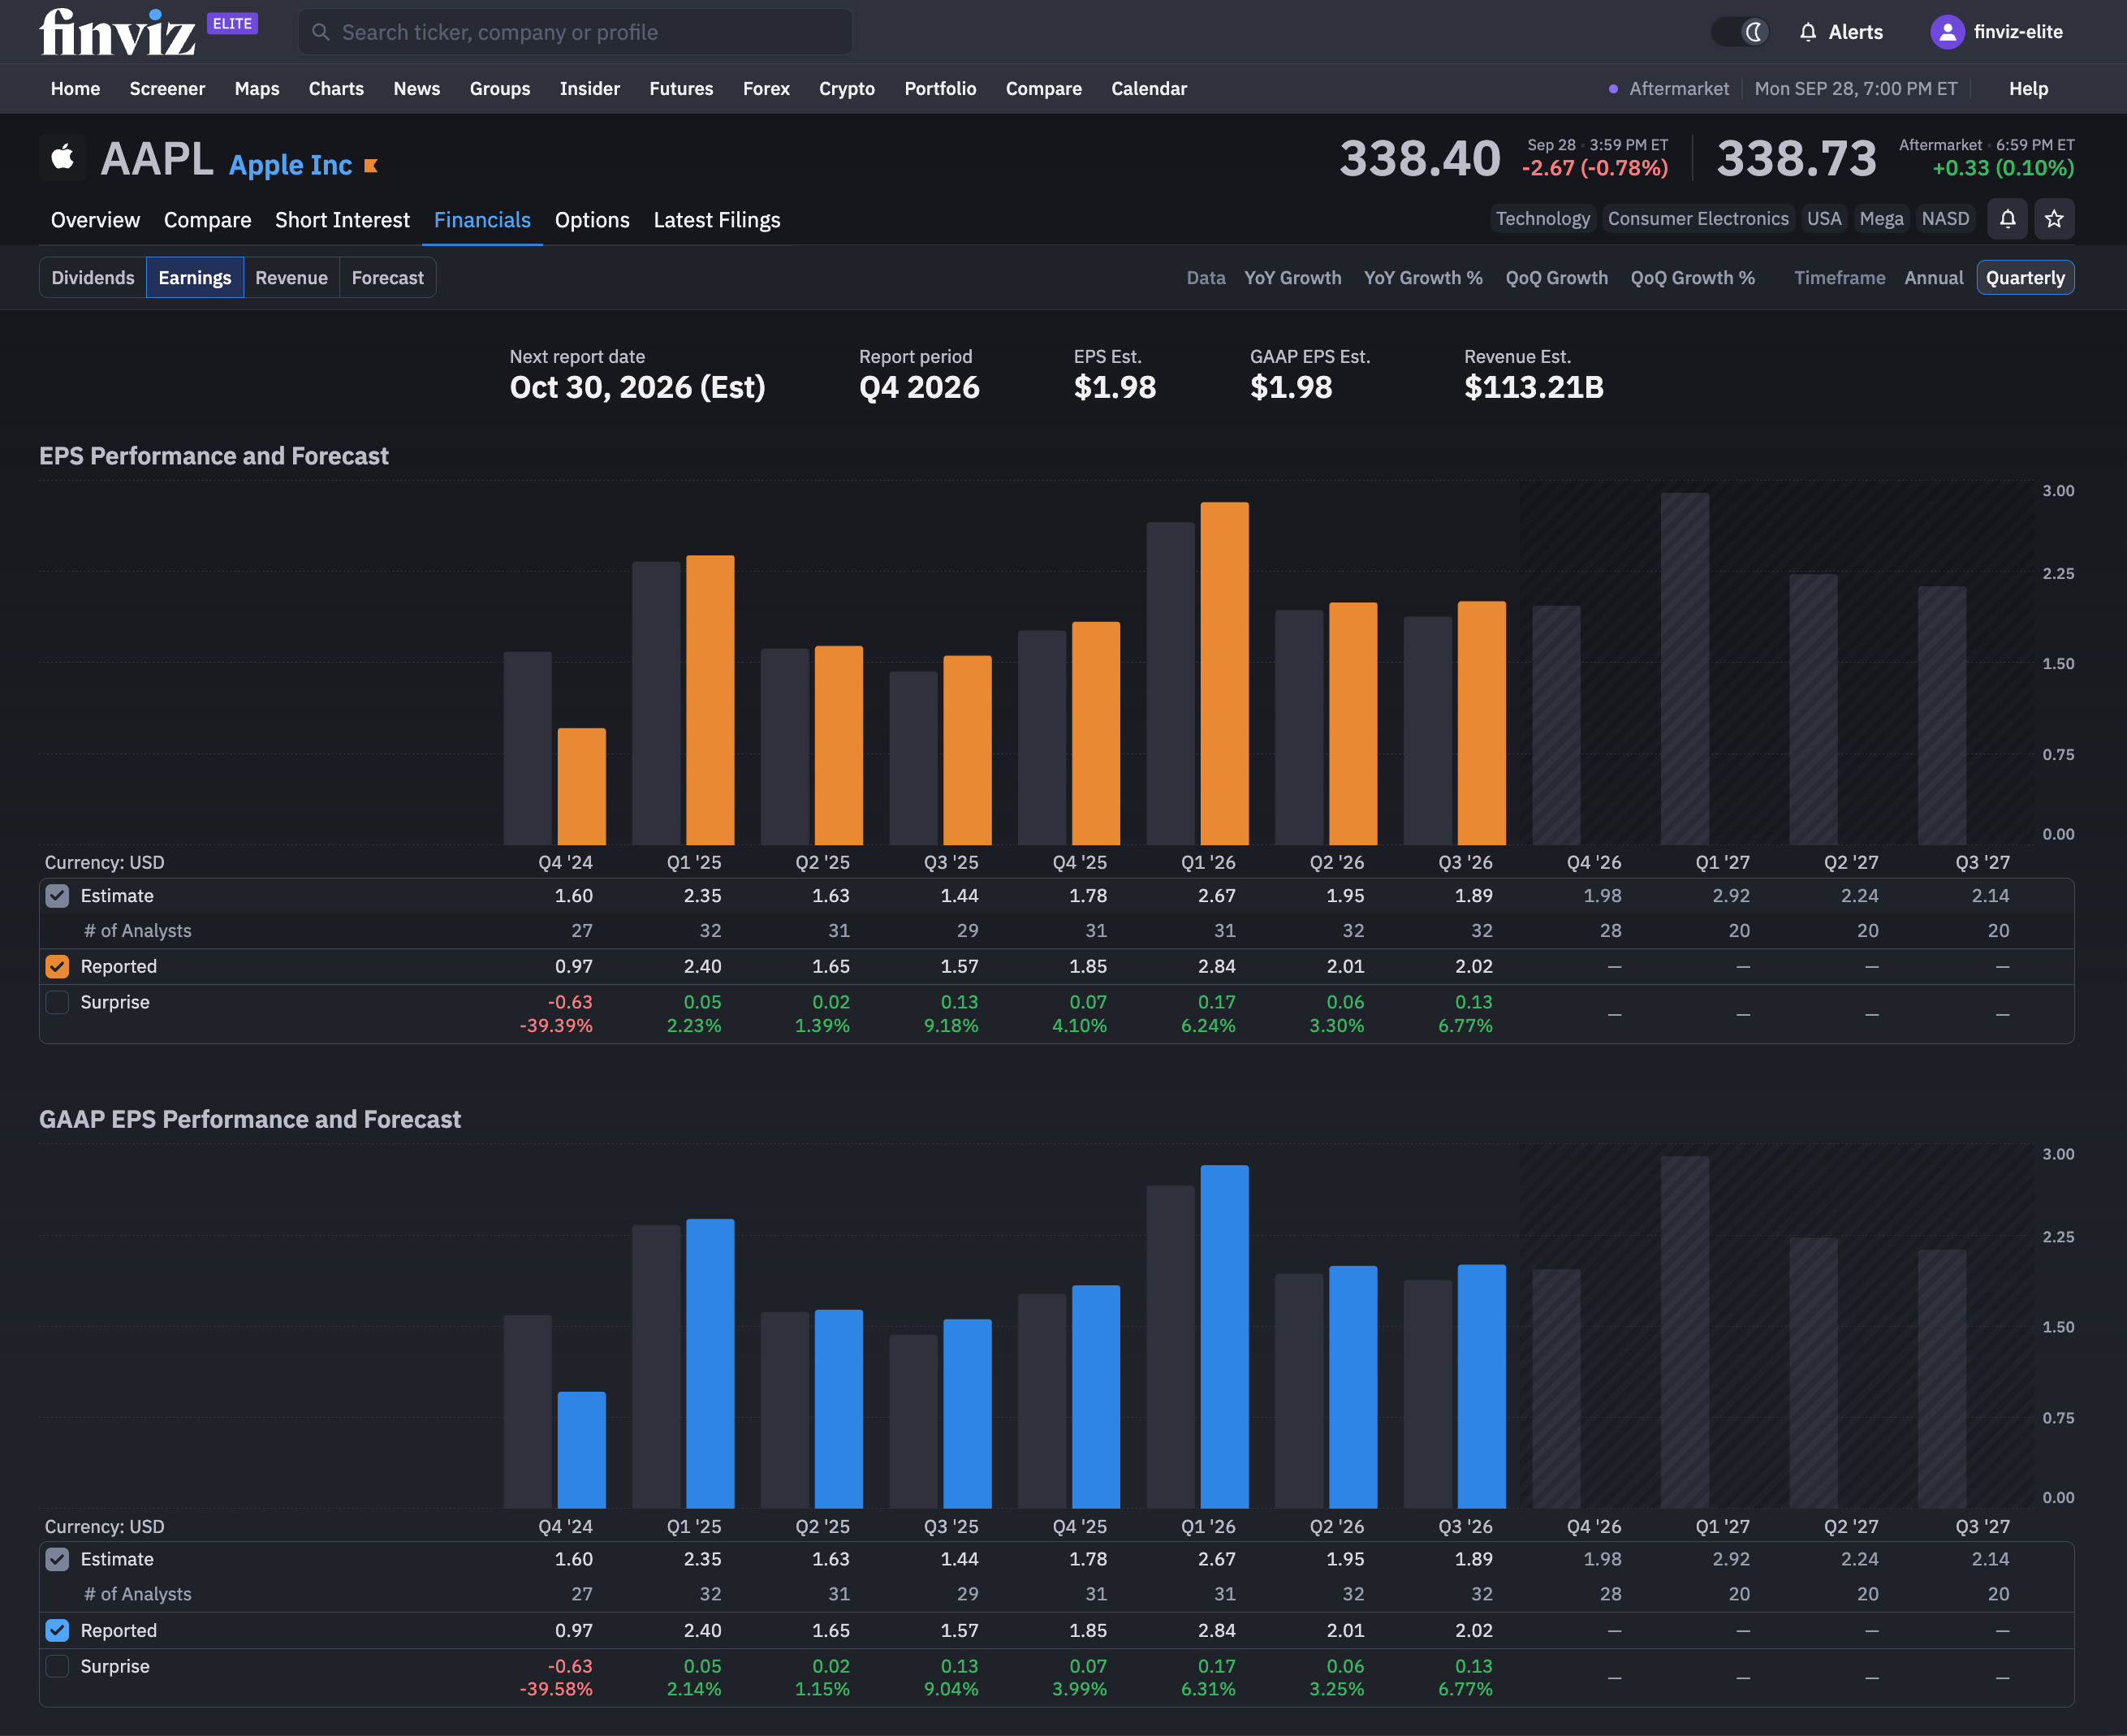
Compare reported earnings per share (EPS) with expectations, see how much the company beat or missed estimates, and review forecasts for upcoming quarters. Switch between annual and quarterly views, or explore year-over-year and quarter-over-quarter growth to understand how the latest results fit into the company’s longer-term performance.
See Analyst Earnings Estimates and Price Targets
To see what analysts expect next, select Forecast under the Financials tab. Here, you’ll find the consensus analyst rating alongside low, average, and high price targets. The chart tracks those targets over time against the stock’s price, helping you see how analyst expectations have changed.
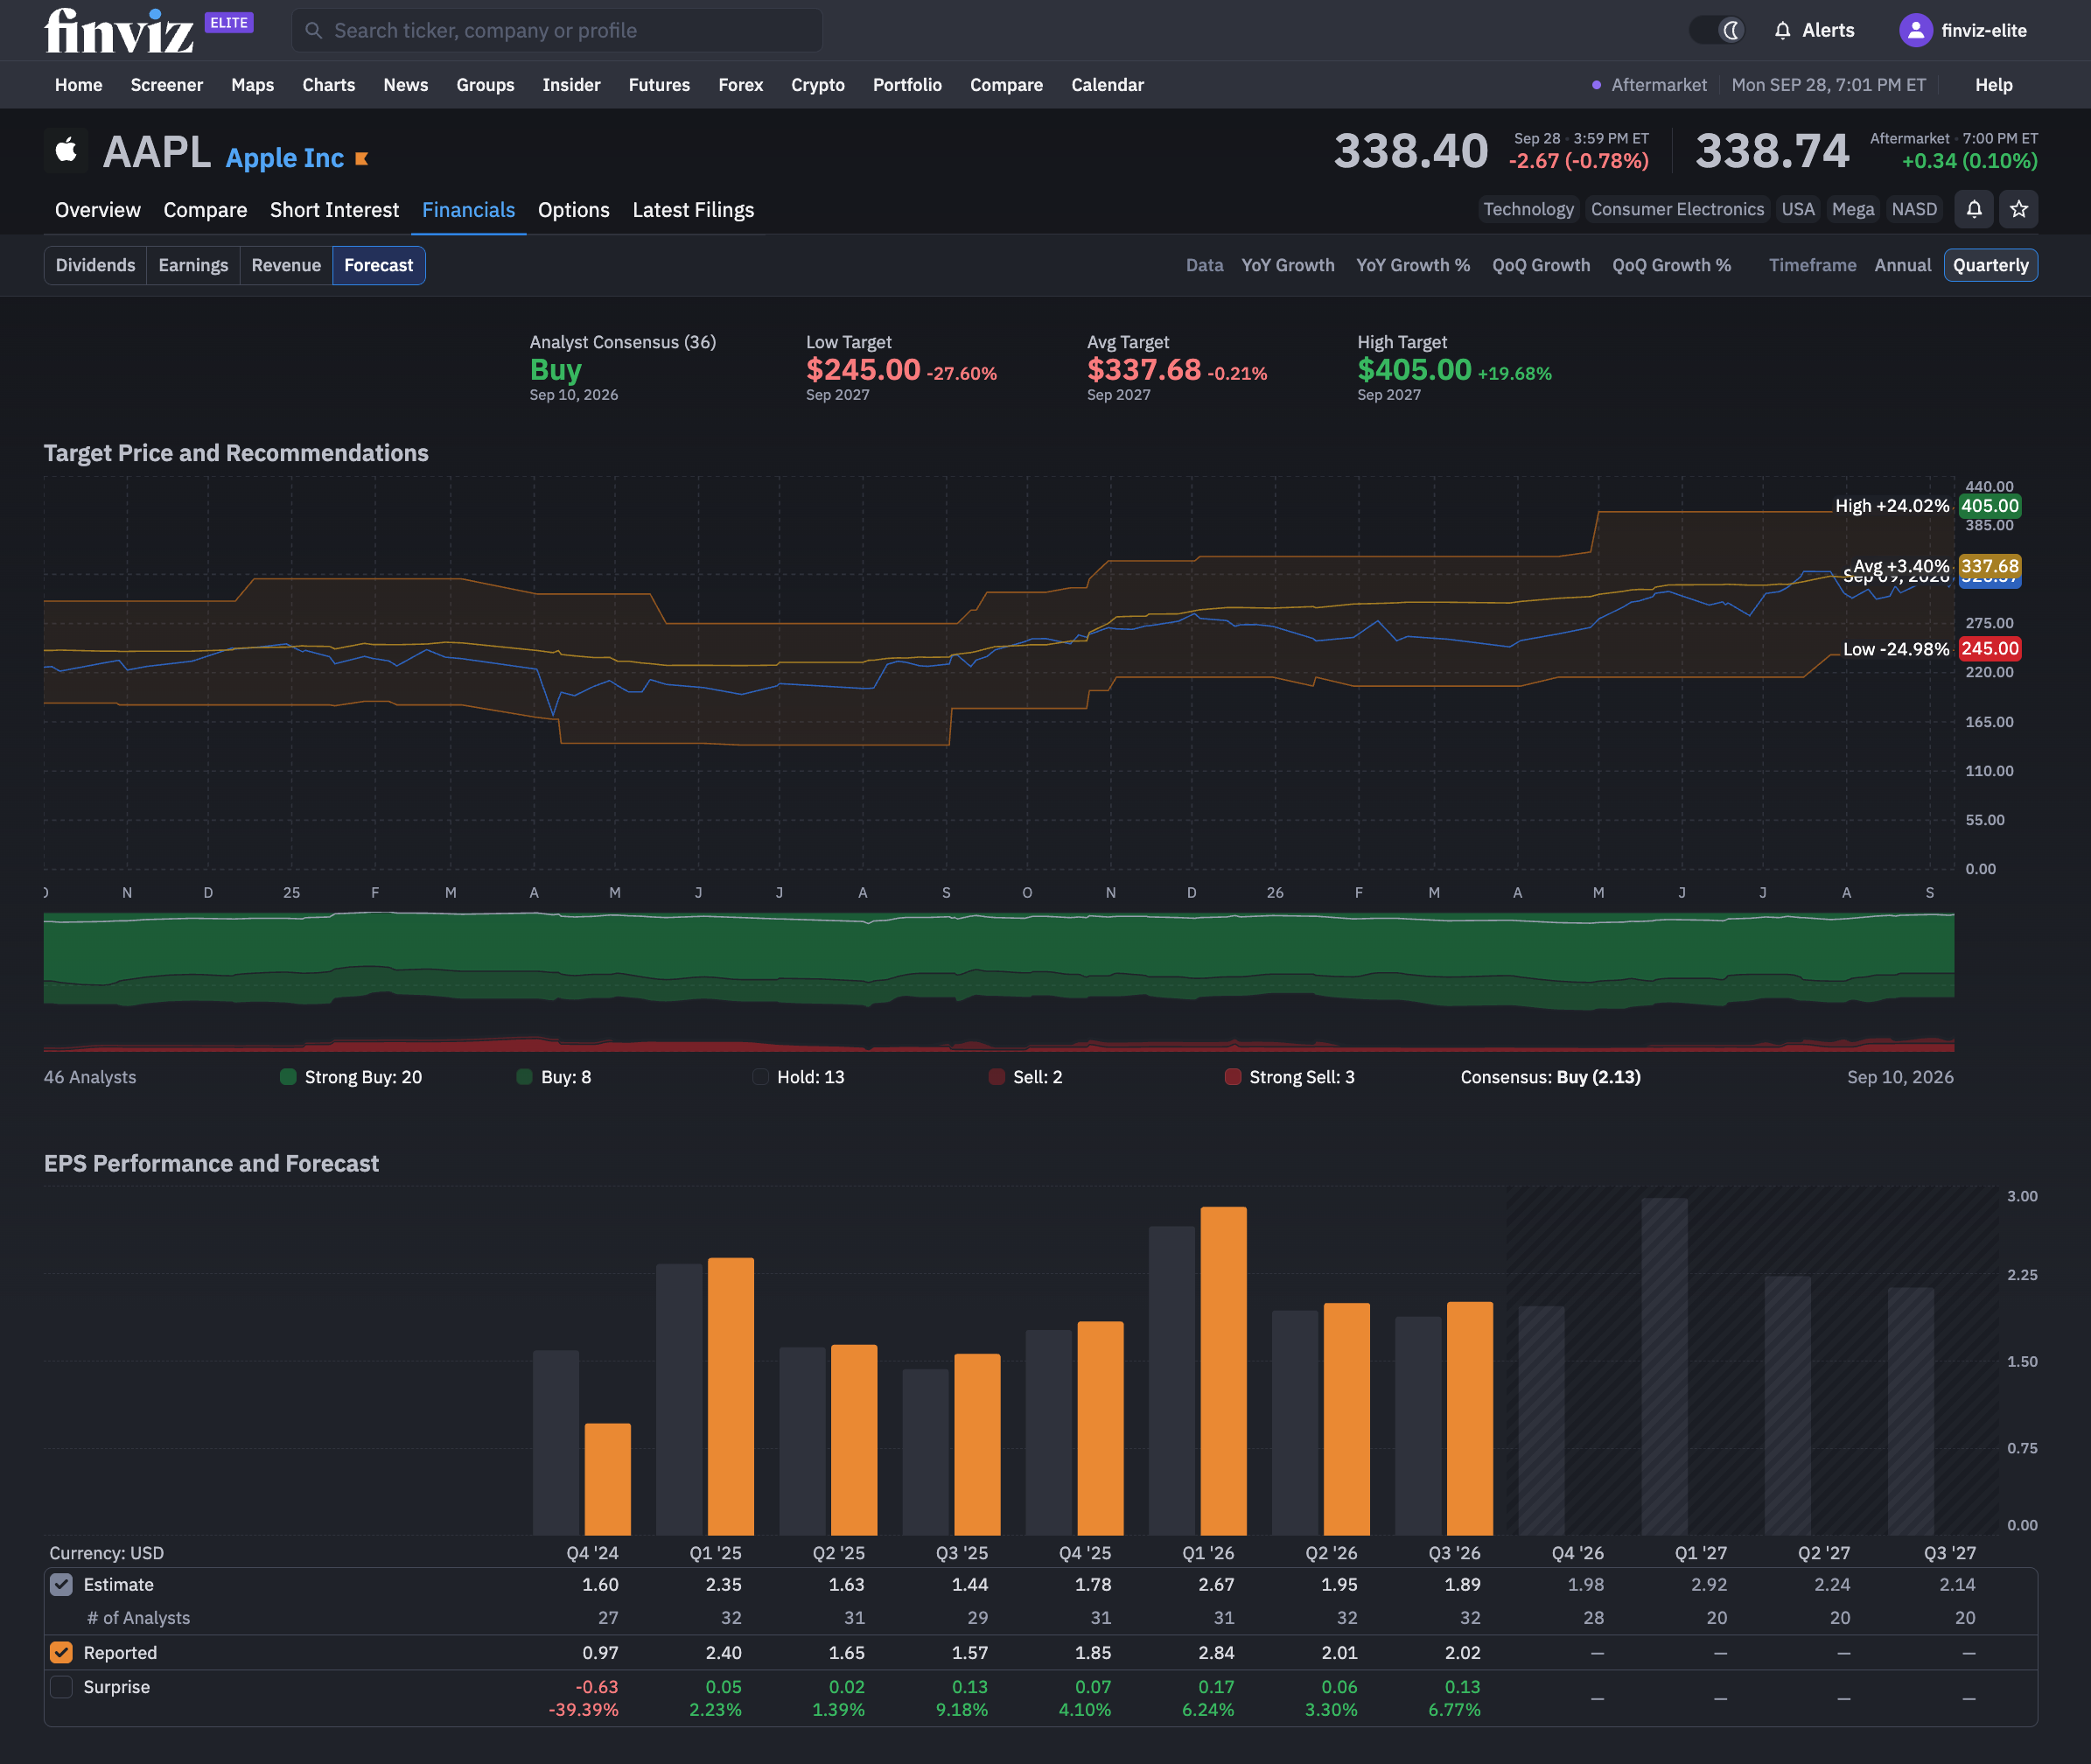
Go deeper by reviewing the breakdown of buy, hold, and sell recommendations, or explore earnings estimates for upcoming quarters. The EPS charts and tables show past results alongside forecasts, including how many analysts contribute to each estimate and whether previous reports beat or missed expectations.
How to Trade Historical Earnings Data
Scroll further down the Earnings tab to find Price Reaction to Earnings Reports, a detailed history of how the stock traded around previous releases.
Review price moves before the announcement, the opening reaction, intraday highs and lows, and performance in the days that followed. Each report also includes SPY comparisons, helping you assess the stock’s reaction alongside the broader market.
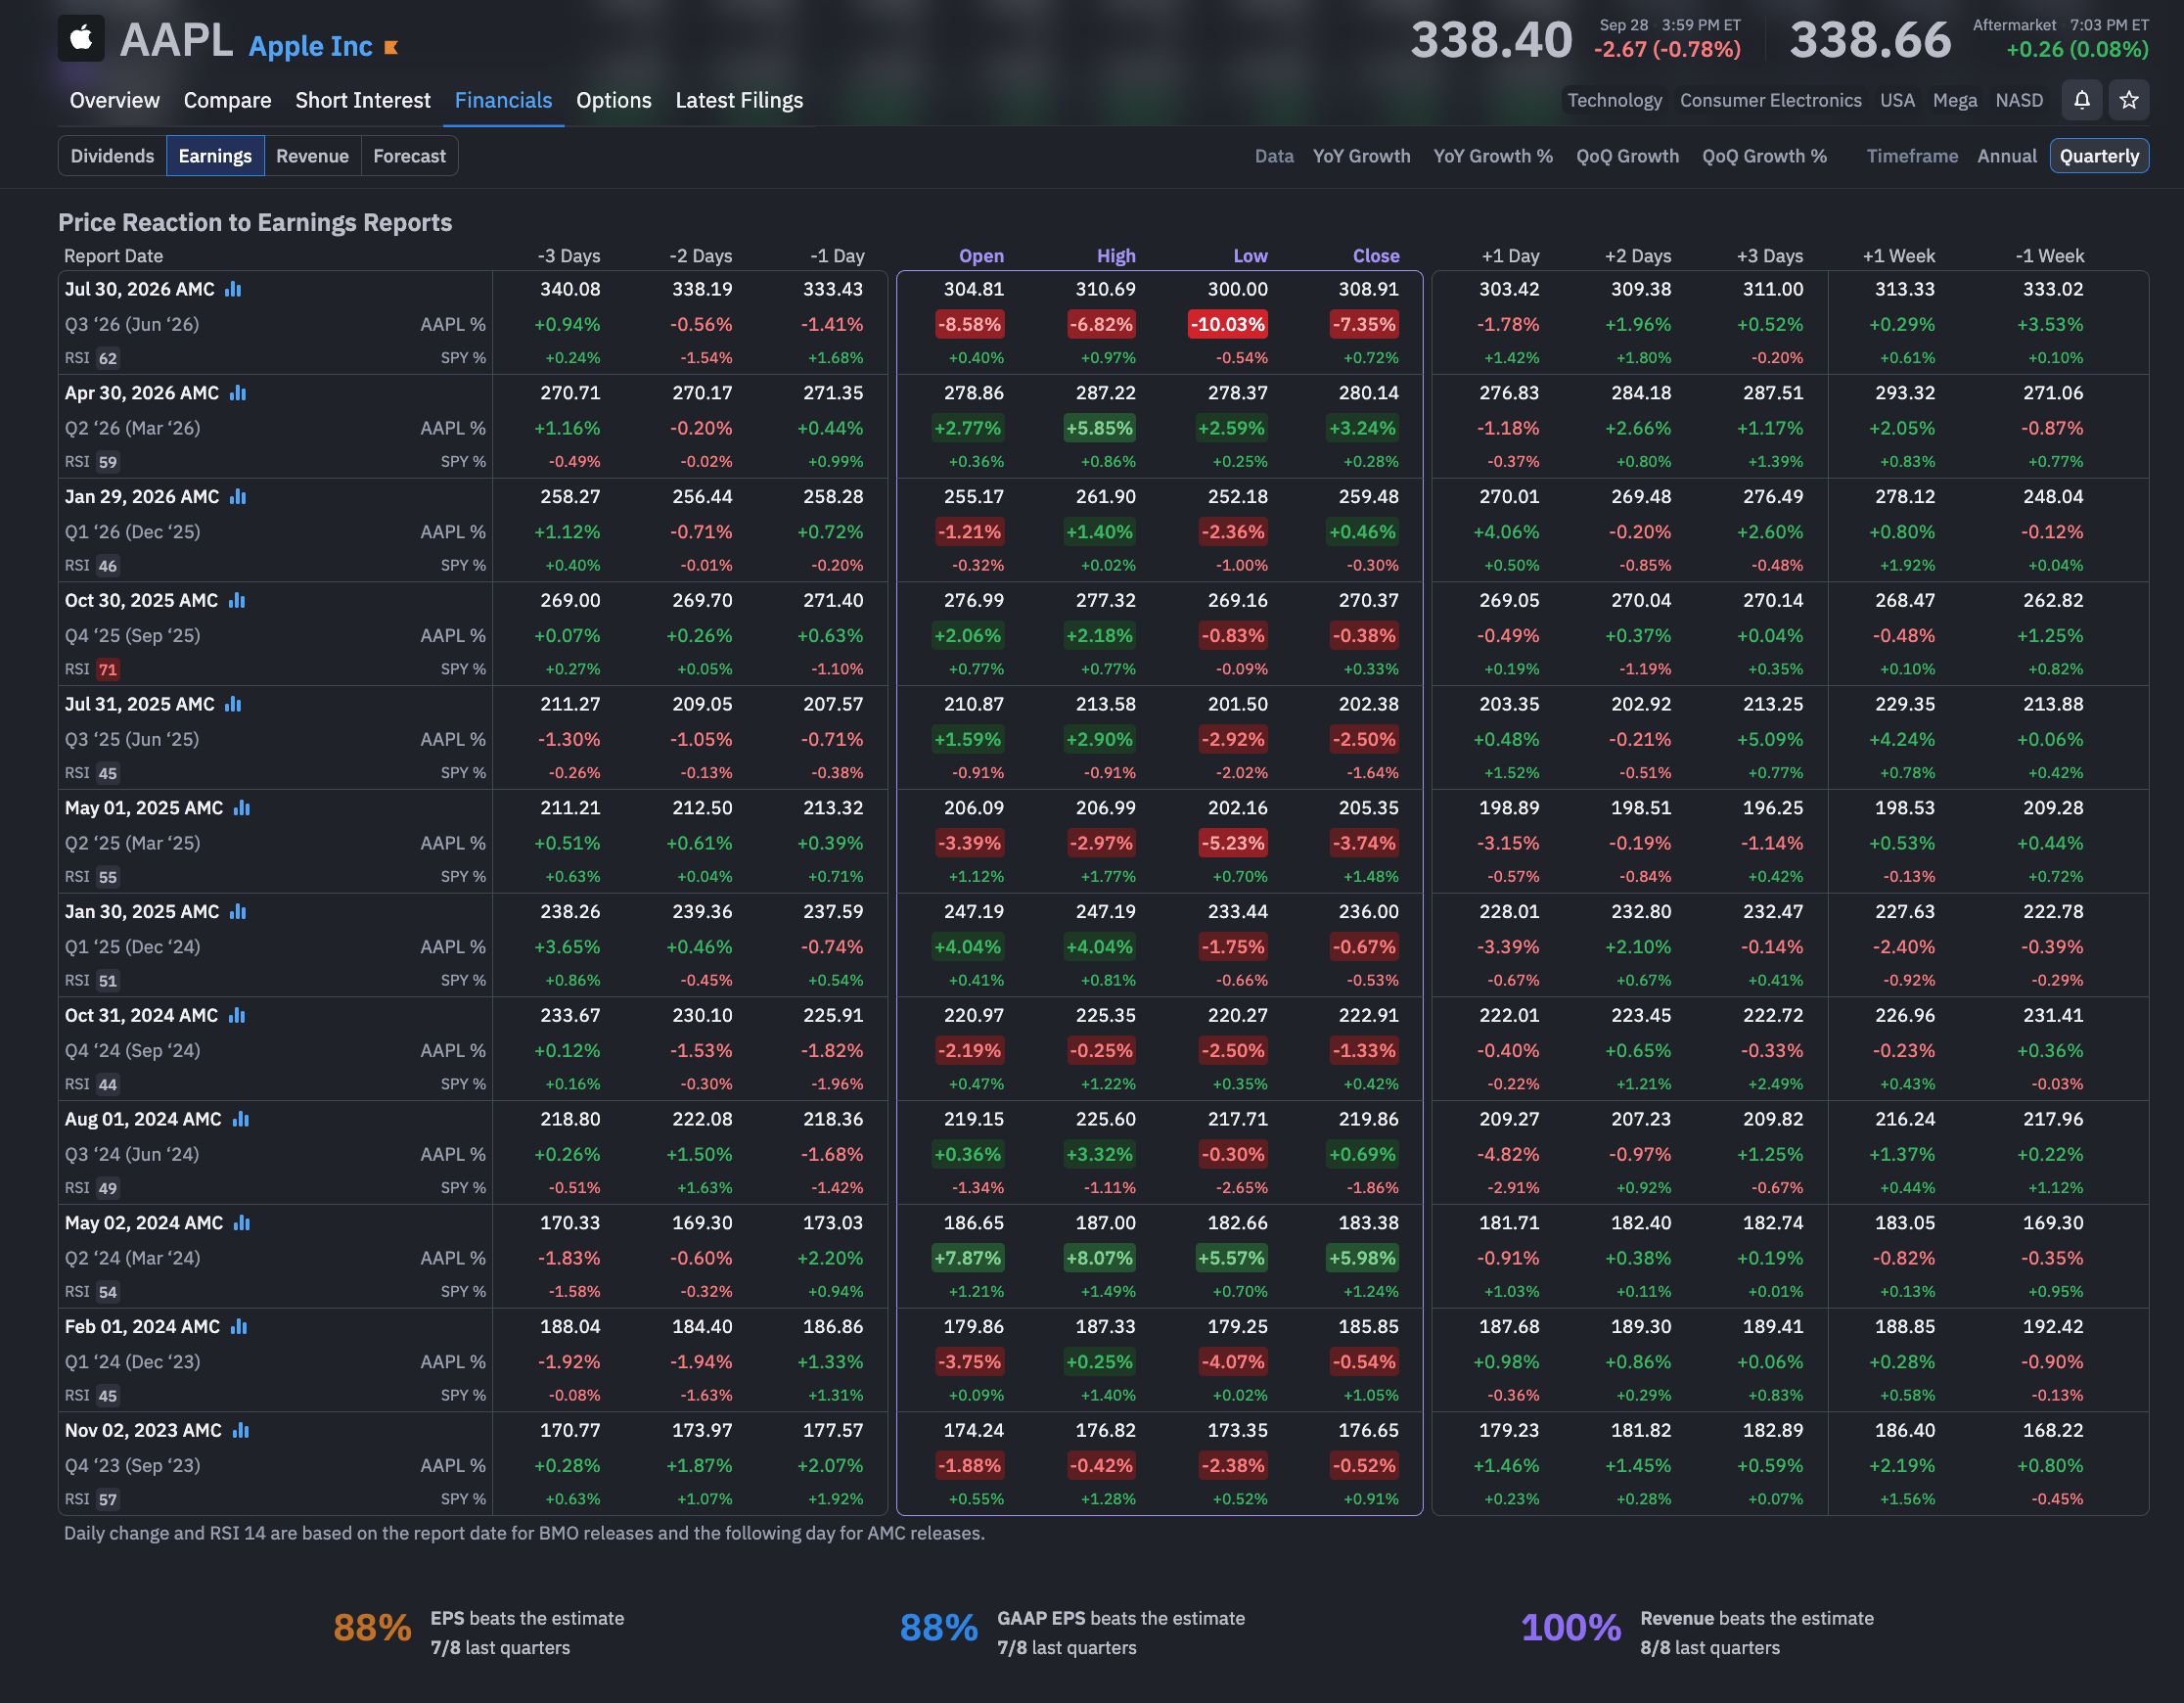
Below the table, you’ll see how often the company beat EPS, GAAP EPS, and revenue estimates over the last eight quarters.
These results add important context: beating expectations doesn’t always lead to a higher stock price. By studying earnings outcomes alongside price reactions, you can see whether previous beats were rewarded, how the stock responded to misses, and whether the initial move continued or reversed.
Earnings by Product, Region, and More
To see where a company’s revenue comes from, select Revenue under the Financials tab. This page breaks down sales by product, service, region, and segment, with historical charts and tables showing how each contributes to the business. For Apple, you can explore revenue from iPhone, Mac, iPad, and Services, then examine sales across its geographic markets.
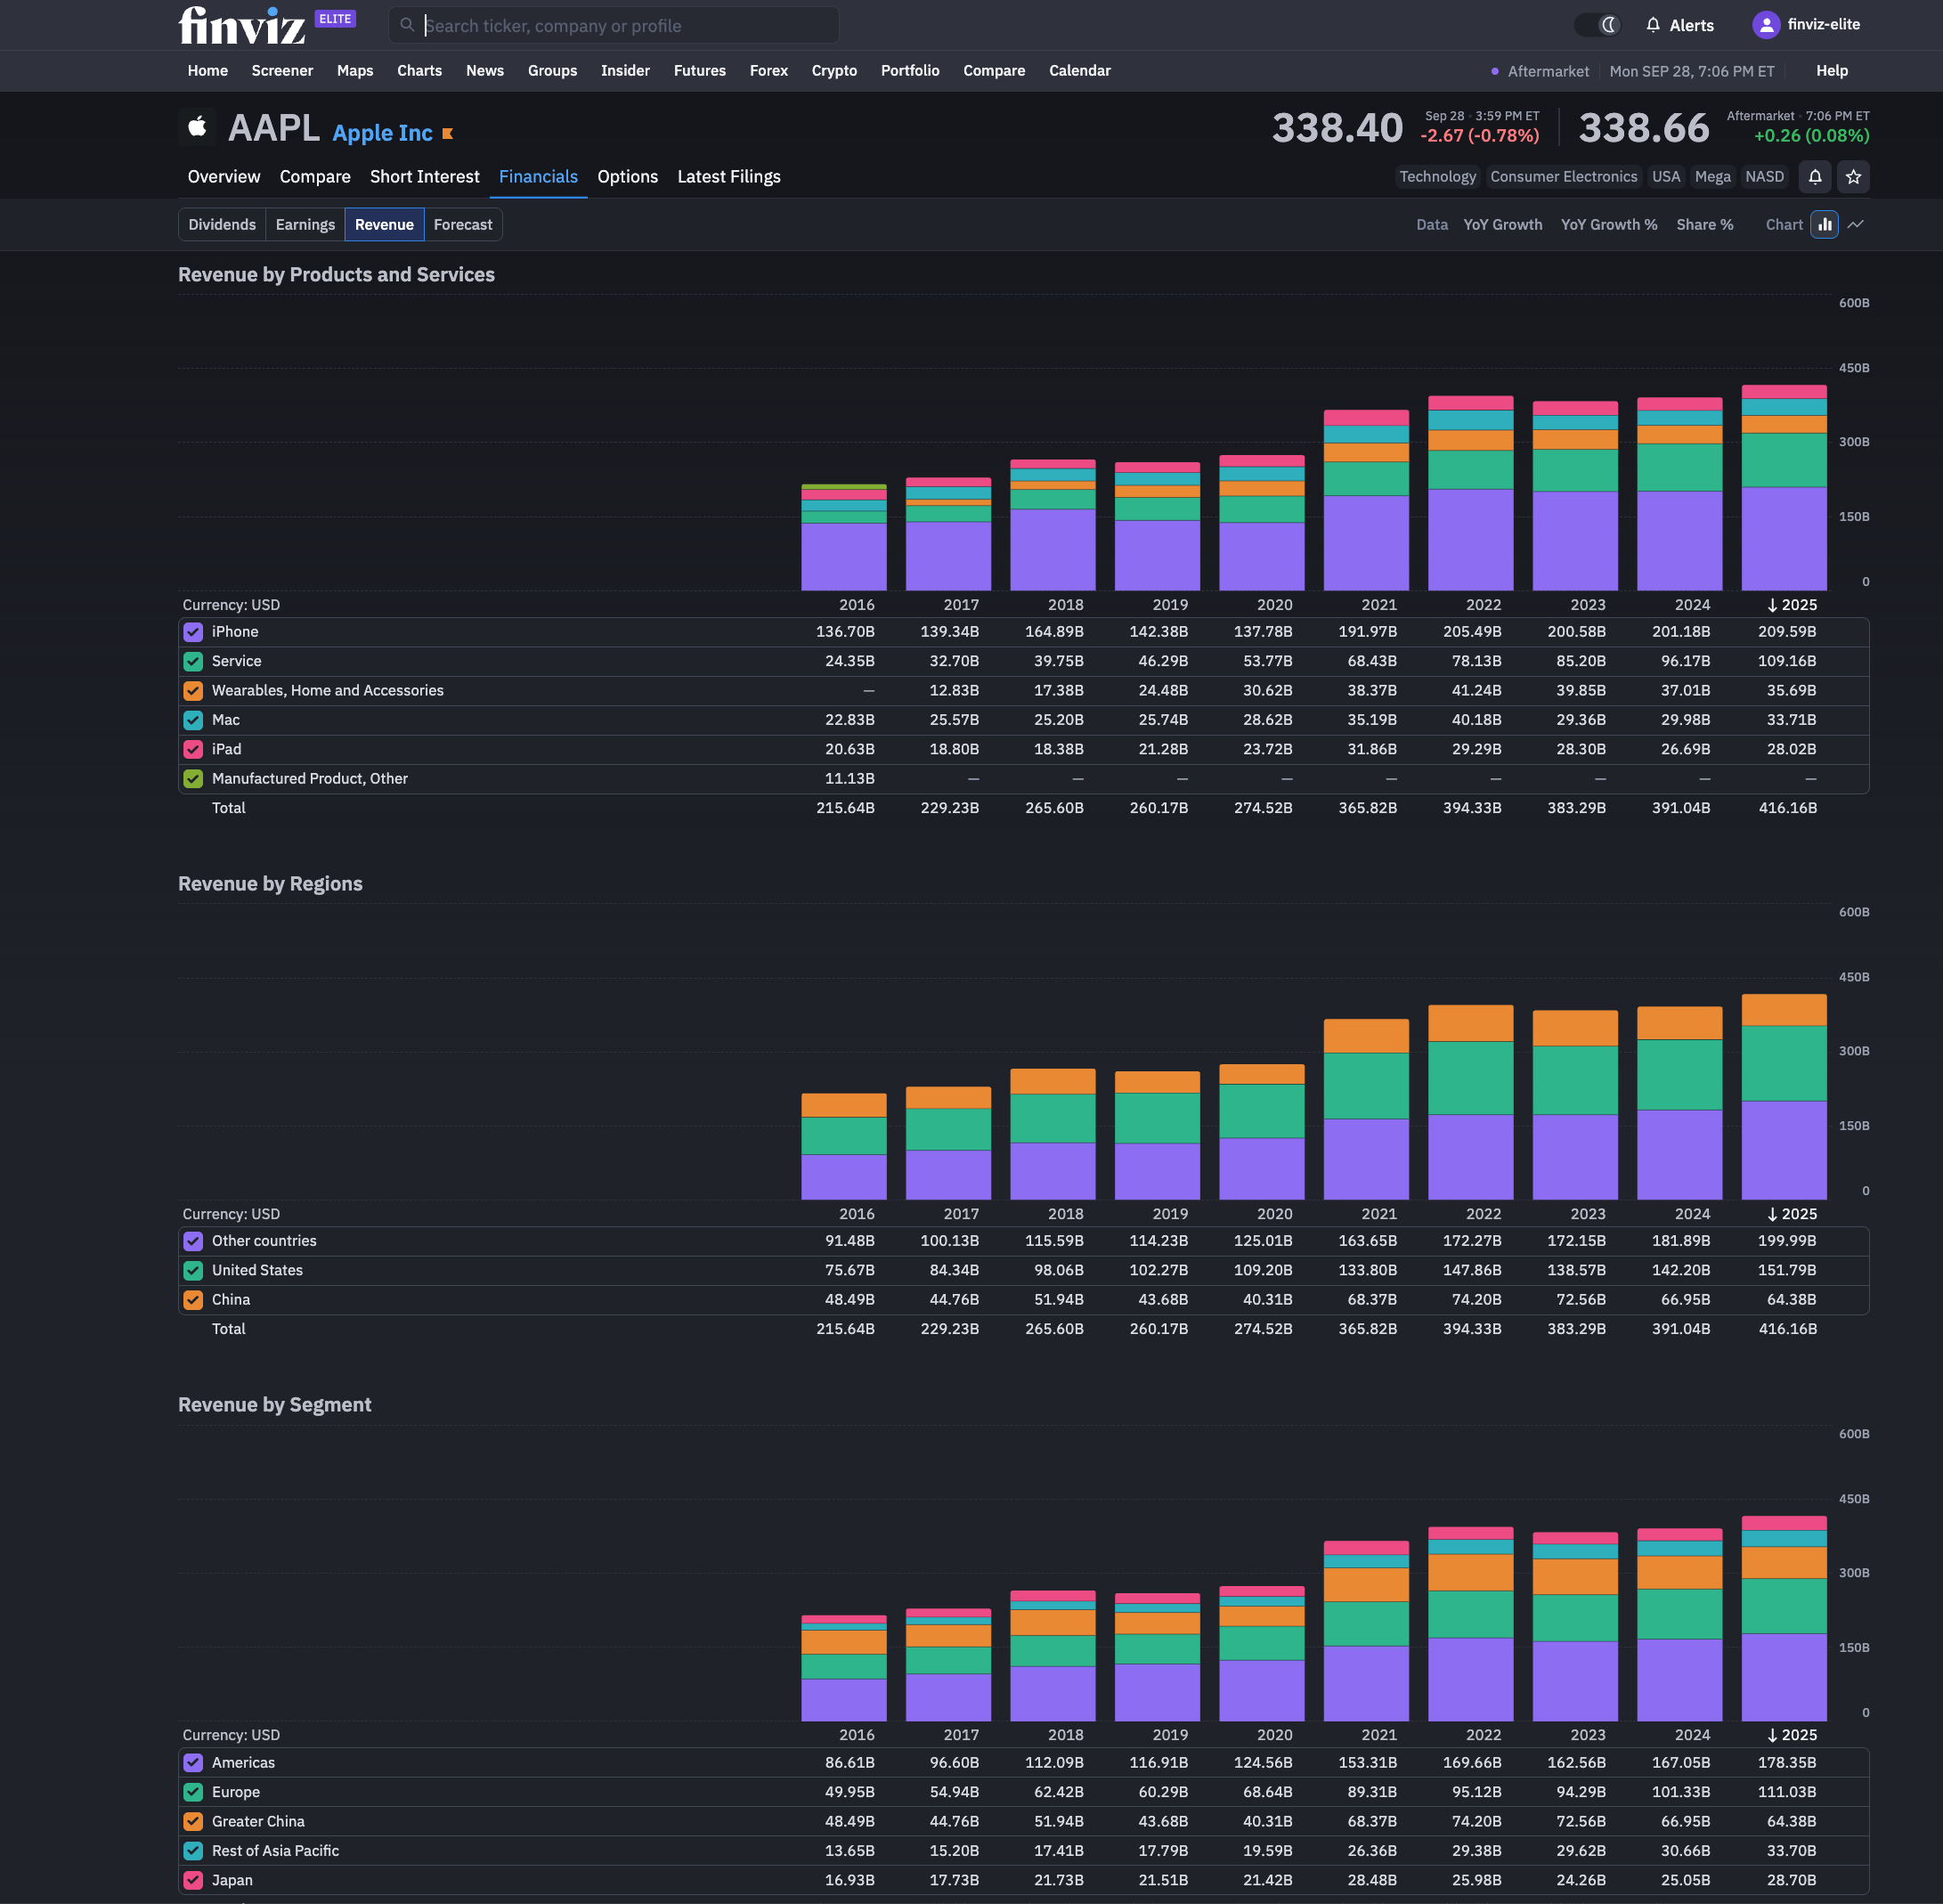
Switch between revenue totals, year-over-year growth, and percentage share to understand what’s driving the company’s performance. You can identify which products are growing, which regions are slowing, and how the revenue mix has changed over time. These details help you look beyond the headline numbers and see how much the business depends on a particular product or market.
The More You Dive in, the Better it Gets
Start with the earnings icon on a stock’s chart, then explore analyst expectations, historical price reactions, and the products and regions driving revenue.
Each view adds context to the latest report, helping you understand what the company delivered and how the market responded.
We're excited to see how you use these Earnings tools!
Finviz Team