


Screening gives you the perfect list of stocks to watch. Screening with Charts gives you the whole picture. Starting today, Finviz members can turn their Screener results into a fully customized collection of charts. Adjust style, look and feel of every chart that appears in your Screener.
How To Turn a Screen Into Customizable Charts
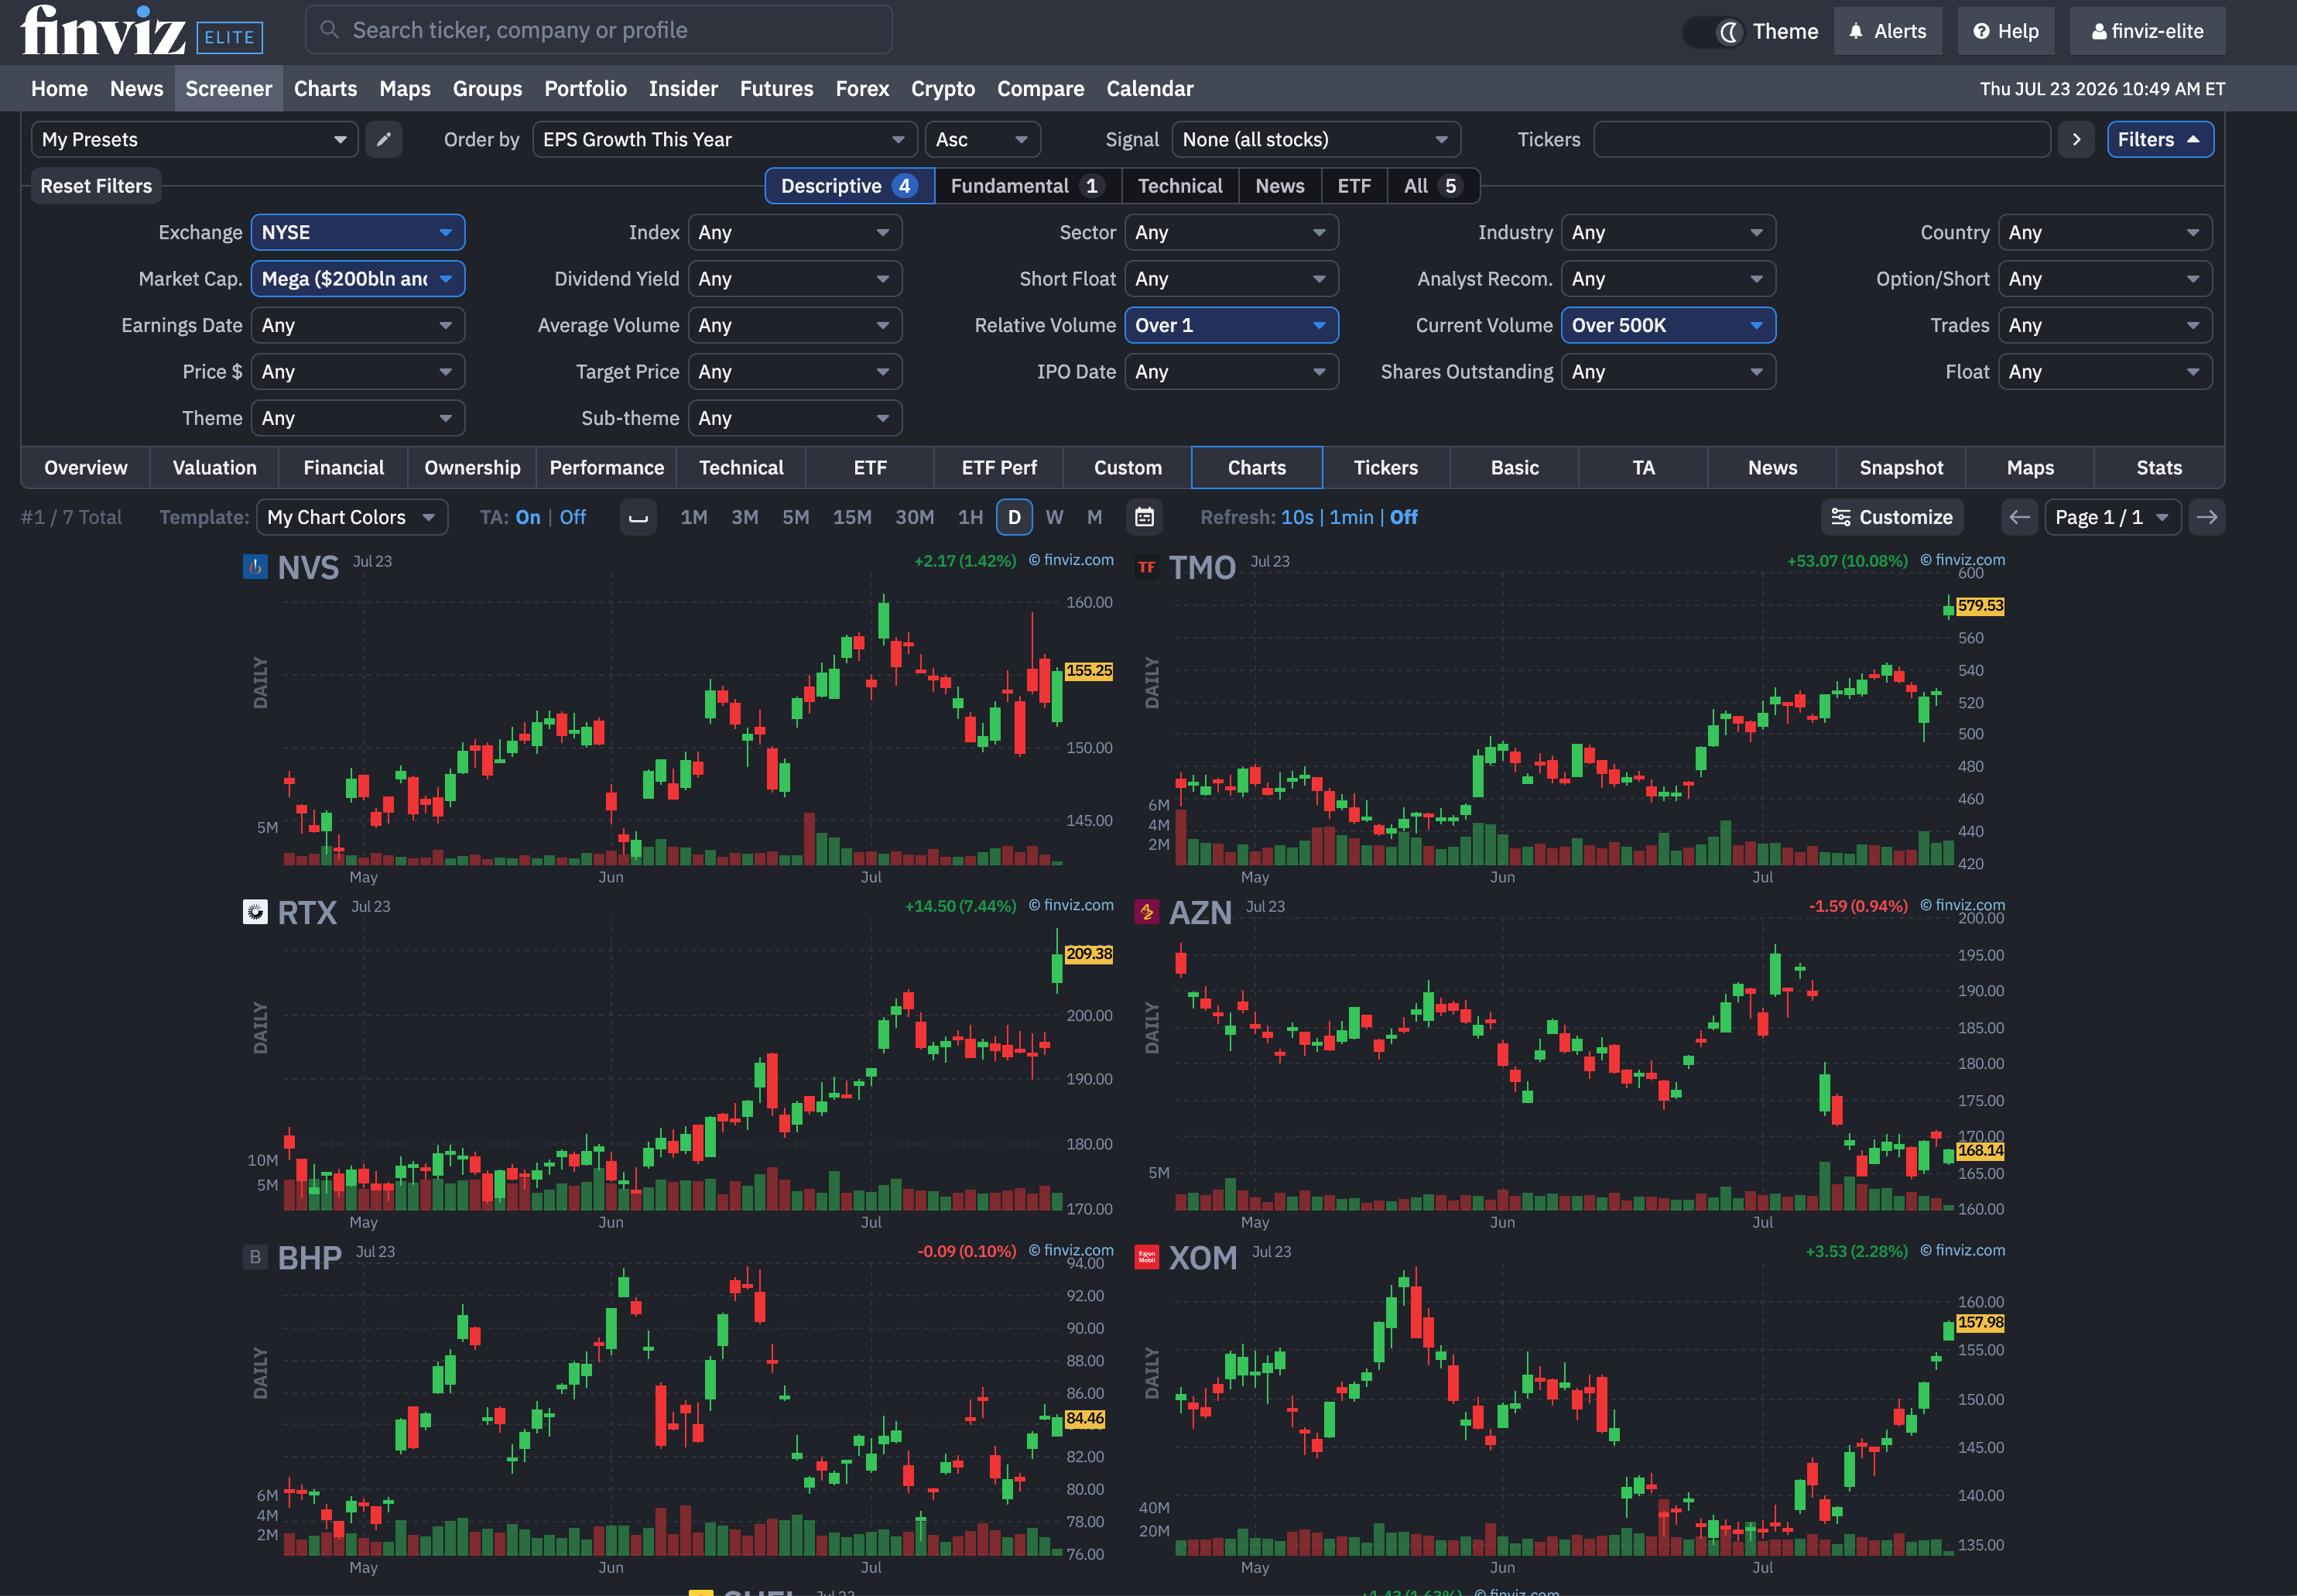
First, build a Stock Screen using the filters you already know, then click the Charts button to view every matching stock as a chart.
For example, run a momentum breakout screen, switch to Charts view, and see 50 stocks as charts in a single view. Instead of reviewing tickers one row at a time, turn your entire screen into a collection of charts. This makes it easier to scan price action, recognize patterns, and identify the stocks that deserve a closer look.
Customize Your Screened Stock Charts
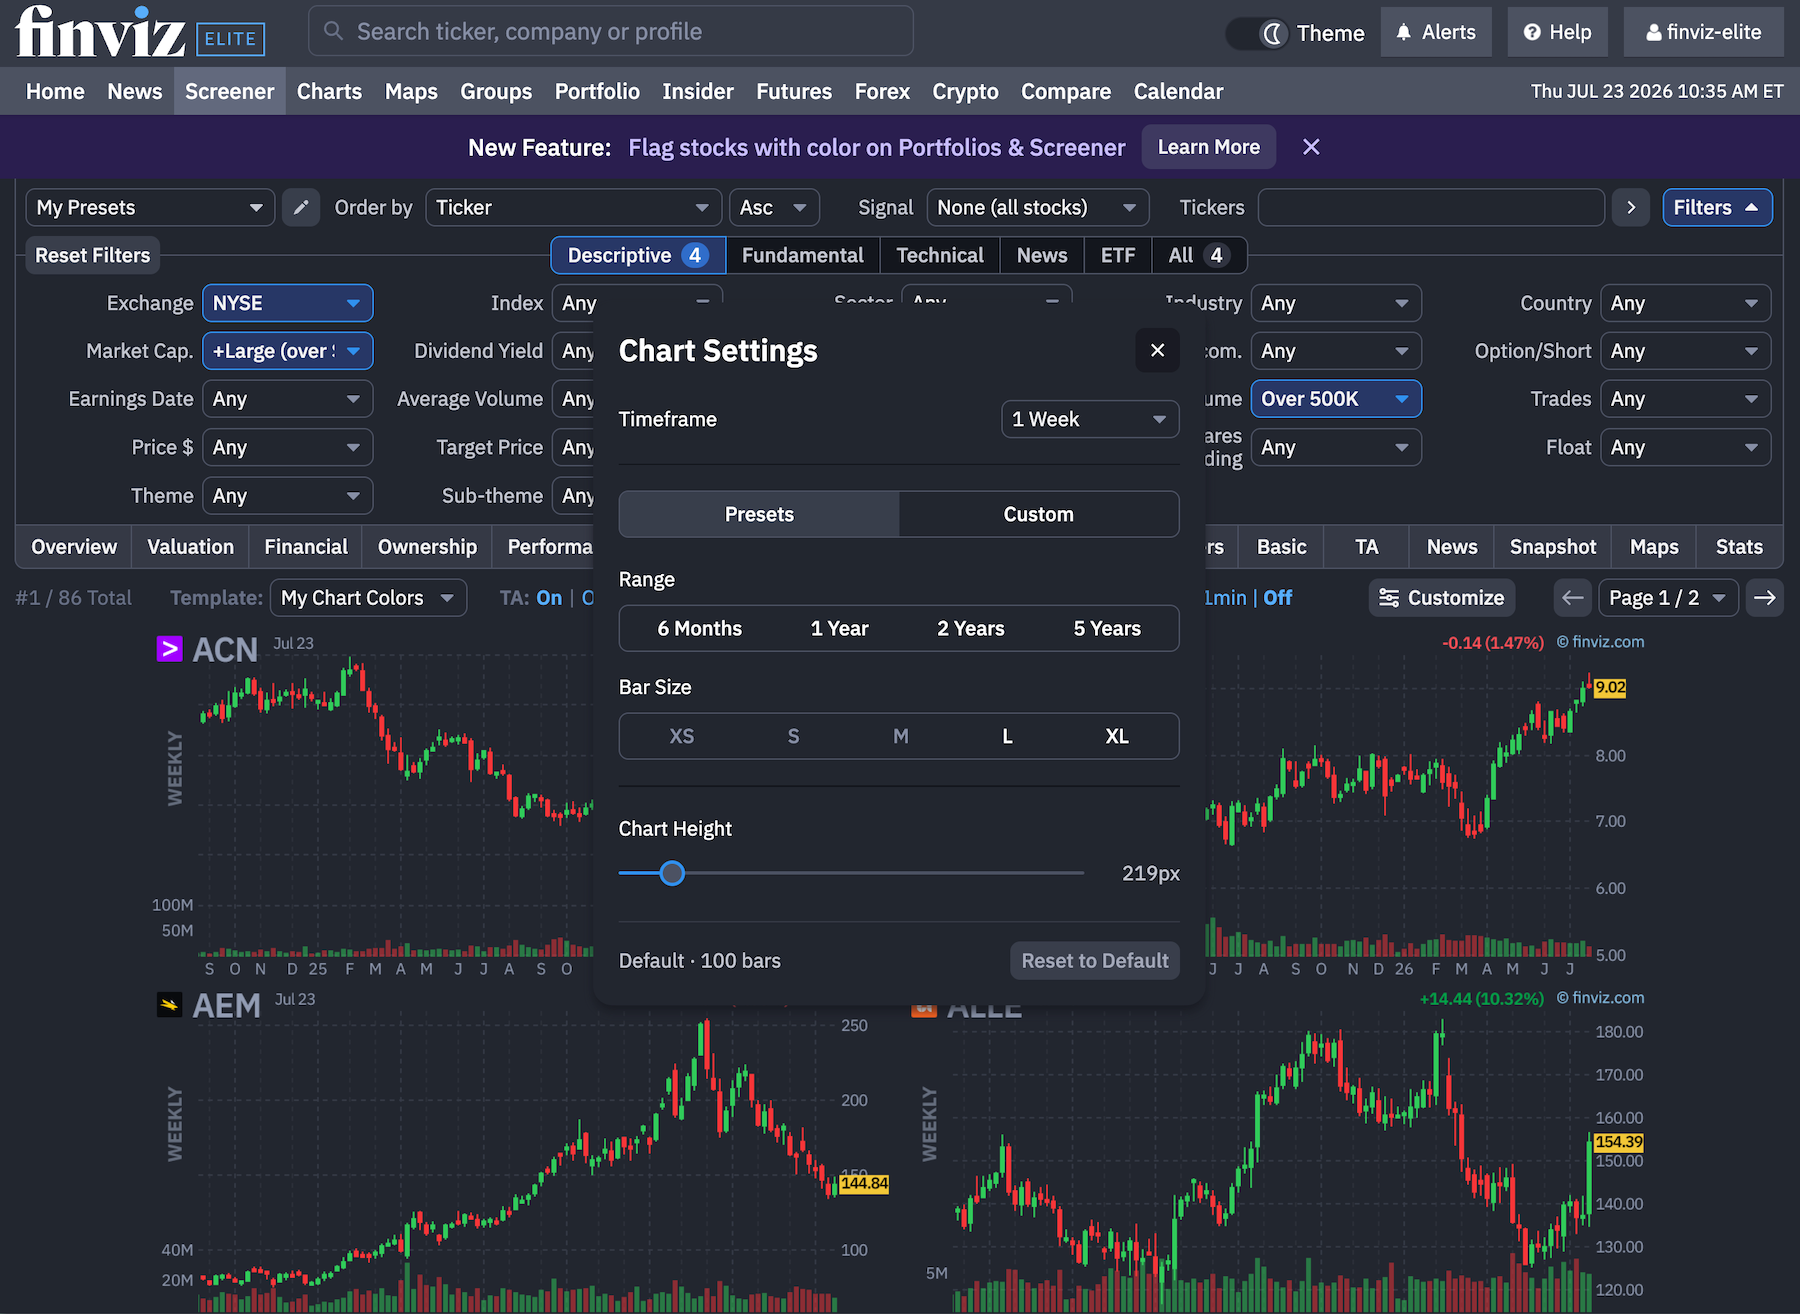
Adjust every chart in your Screen to match your strategy and preferred look. If you trade with multiple screens or a vertical monitor, you now have the controls to design a perfect layout. Click Customize to control:
- Range: Choose from preset ranges including daily, weekly, monthly and beyond.
- Bar Size: Select from extra small through extra large to control how much chart detail appears on screen.
- Chart Height: Resize charts to create a compact overview or a larger, more detailed view.
- Custom: For advanced traders, and those with multiple monitors or large screens, this feature allows you to move beyond the presets and build a chart layout with ultimate detail.
Go Deeper With Custom Built Chart Layouts
For even greater control, click Custom inside Screener Chart Settings to fine-tune more advanced details of each chart.
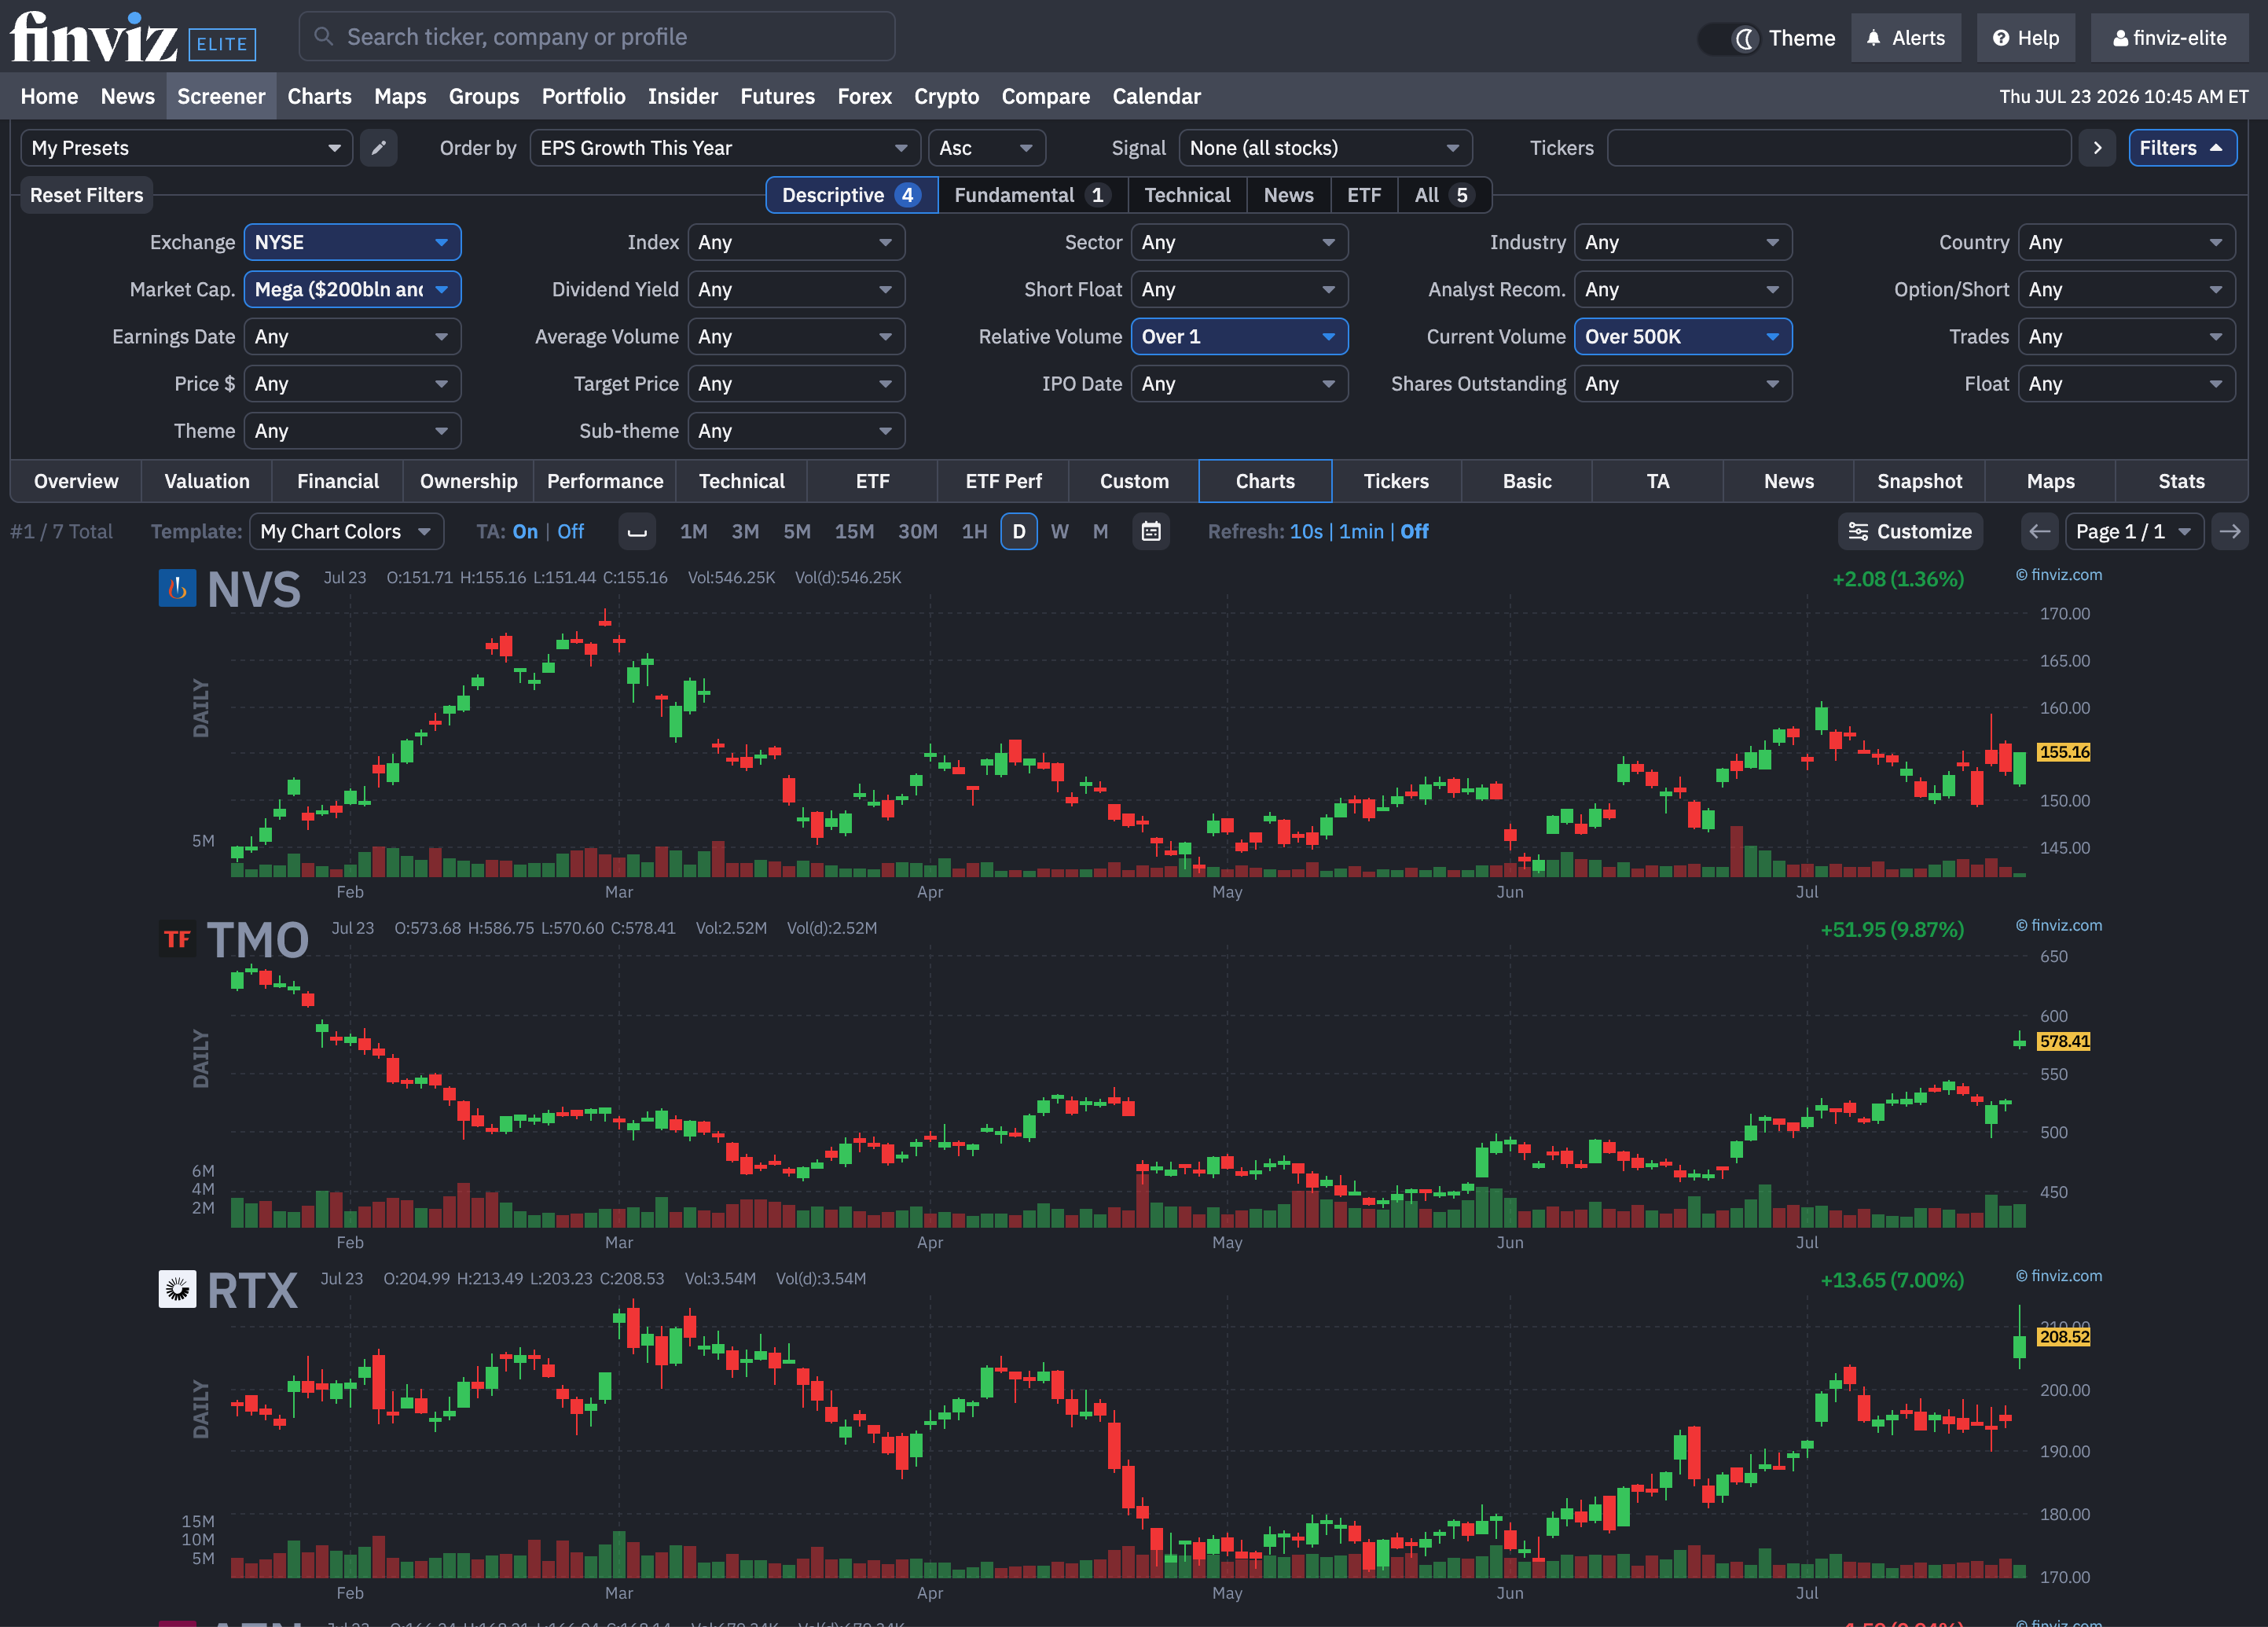
Choose the exact number of bars with a granular slider, adjust bar width and margin, add or remove chart borders, and set a precise chart height. Every change updates in real time, giving you complete control over how your Screener Charts fit across your workstation.
In the screenshot below, you can see we've adjusted the Chart Width, Height, Number of Bars, and Border to make the the charts stack on top of each other and extend across the page. On a vertical monitor, this custom design fits perfect:
Combine Custom Layouts With Chart Designs
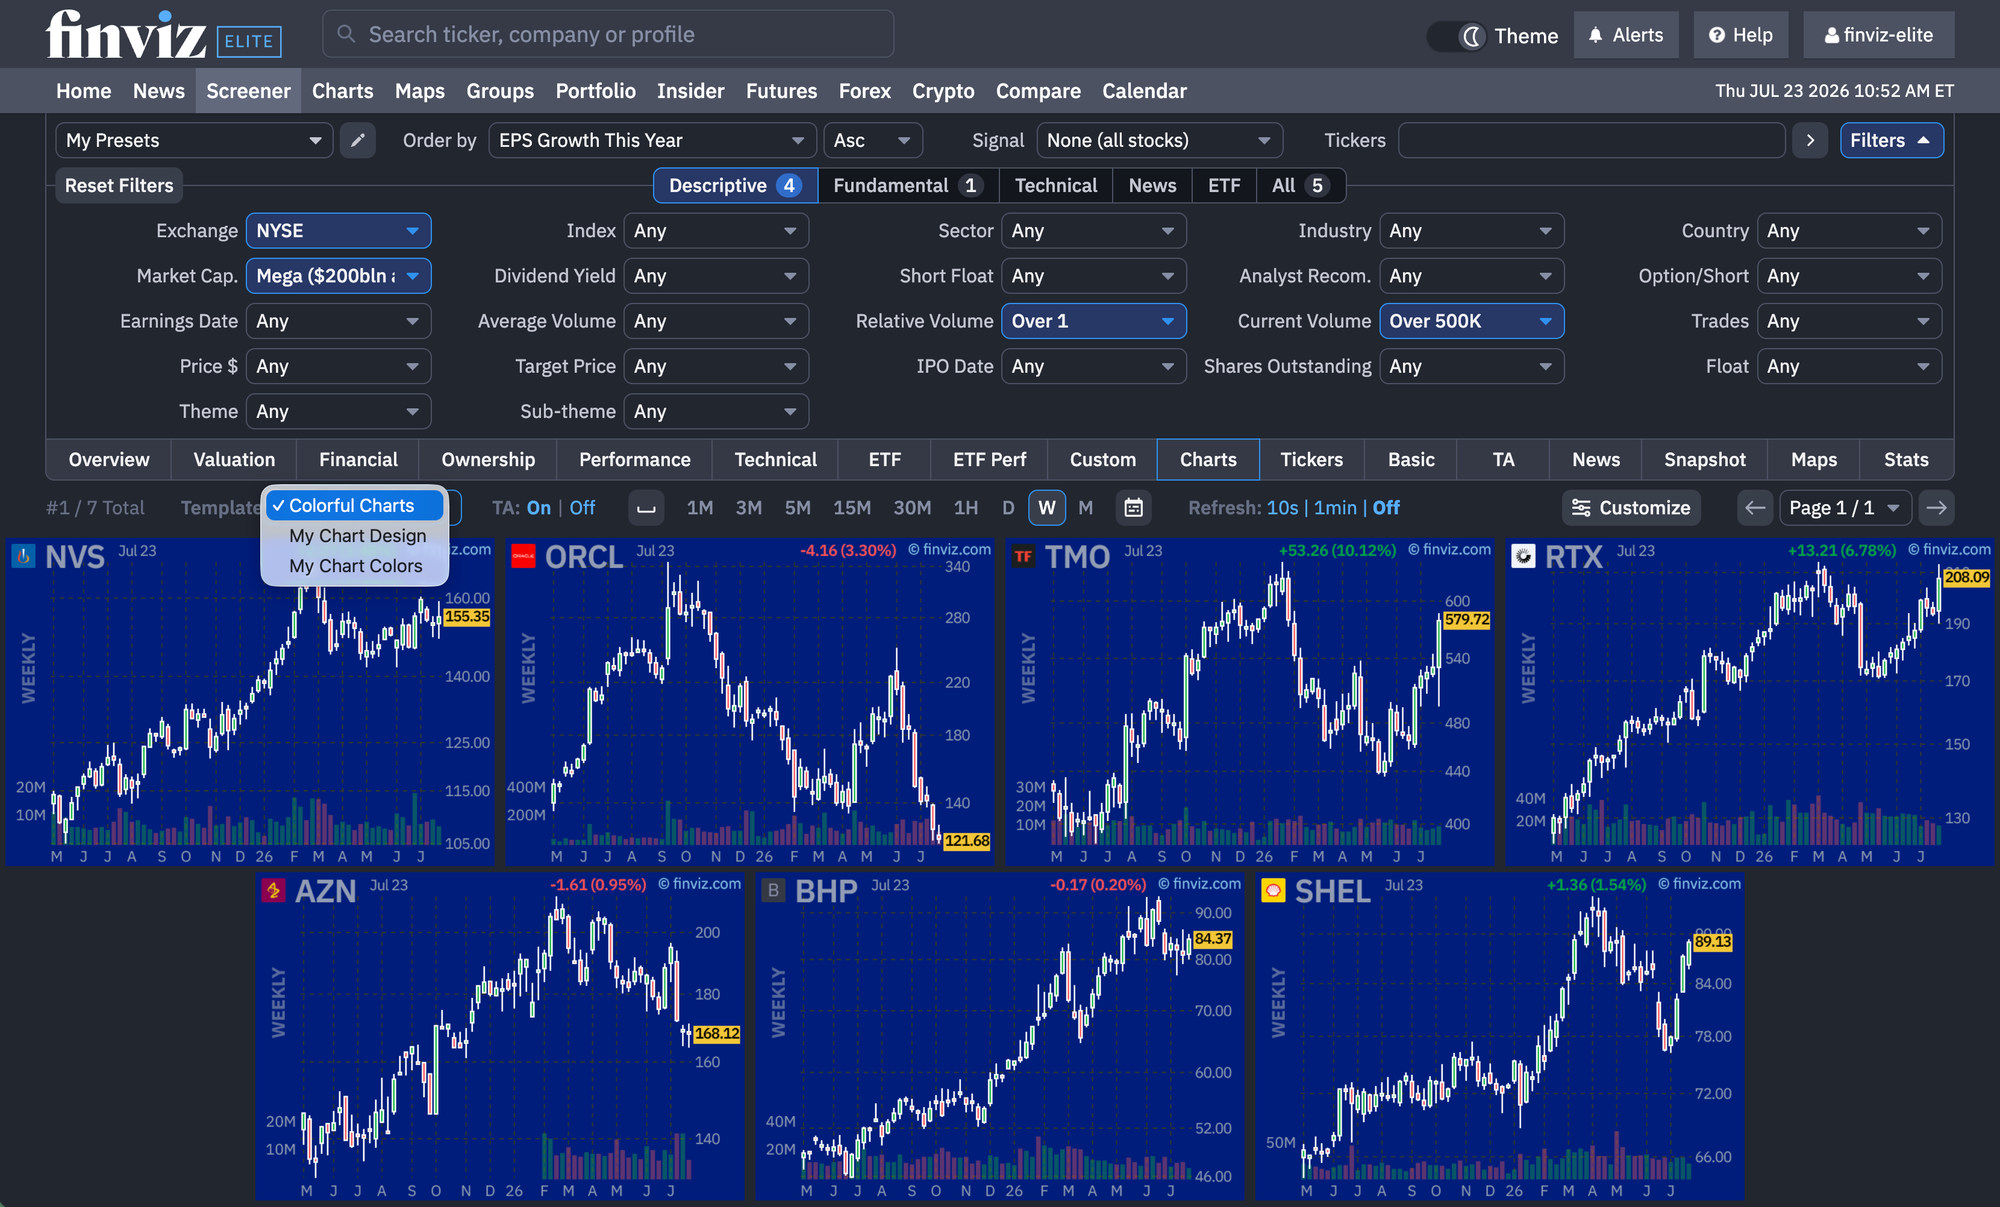
Once you’ve built the perfect layout, combine it with any saved template from our Advanced Charts. Customize everything from colors and candlestick styles to chart types and indicators, then apply the complete design across every chart in your Screen within the layout.
Simply select a saved design from the Template menu and your Screener Charts will match the exact look, layout, and visual system of your entire Finviz workspace. Here are some blue charts we made:
Your Chart Layout, In Every Screen
Our latest updates to our Screener Charts bring filtering, charting, and workspace customization together in one seamless workflow from layout to design and more.
Run a screen, switch to Charts, and customize every detail.
We're excited to see how everyone uses this new tool – Open the Screener to get started.
Finviz Team