CNO Financial Group (NYSE:CNO) Beats Q3 Sales Expectations

Insurance services company CNO Financial Group (NYSE:CNO) reported Q3 CY2025 results exceeding the market’s revenue expectations, with sales up 26.2% year on year to $1.19 billion. Its non-GAAP profit of $1.29 per share was 40.2% above analysts’ consensus estimates.
Is now the time to buy CNO Financial Group? Find out by accessing our full research report, it’s free for active Edge members.
CNO Financial Group (CNO) Q3 CY2025 Highlights:
"Results in the quarter demonstrate the strength of the CNO business model," said Gary C. Bhojwani, chief executive officer.
Company Overview
Rebranded from Conseco in 2010 to signal a fresh start after navigating financial challenges, CNO Financial Group (NYSE:CNO) develops and markets health insurance, annuities, and life insurance products primarily targeting middle-income pre-retirees and retirees.
Revenue Growth
Insurance companies generate revenue three ways. The first is the core insurance business itself, represented in the income statement as premiums earned. The second source is investment income from investing the “float” (premiums collected but not yet paid out as claims) in assets such as fixed-income assets and equities. The third is fees from policy administration, annuities, and other value-added services. Unfortunately, CNO Financial Group’s 2.8% annualized revenue growth over the last five years was sluggish. This fell short of our benchmarks and is a poor baseline for our analysis.
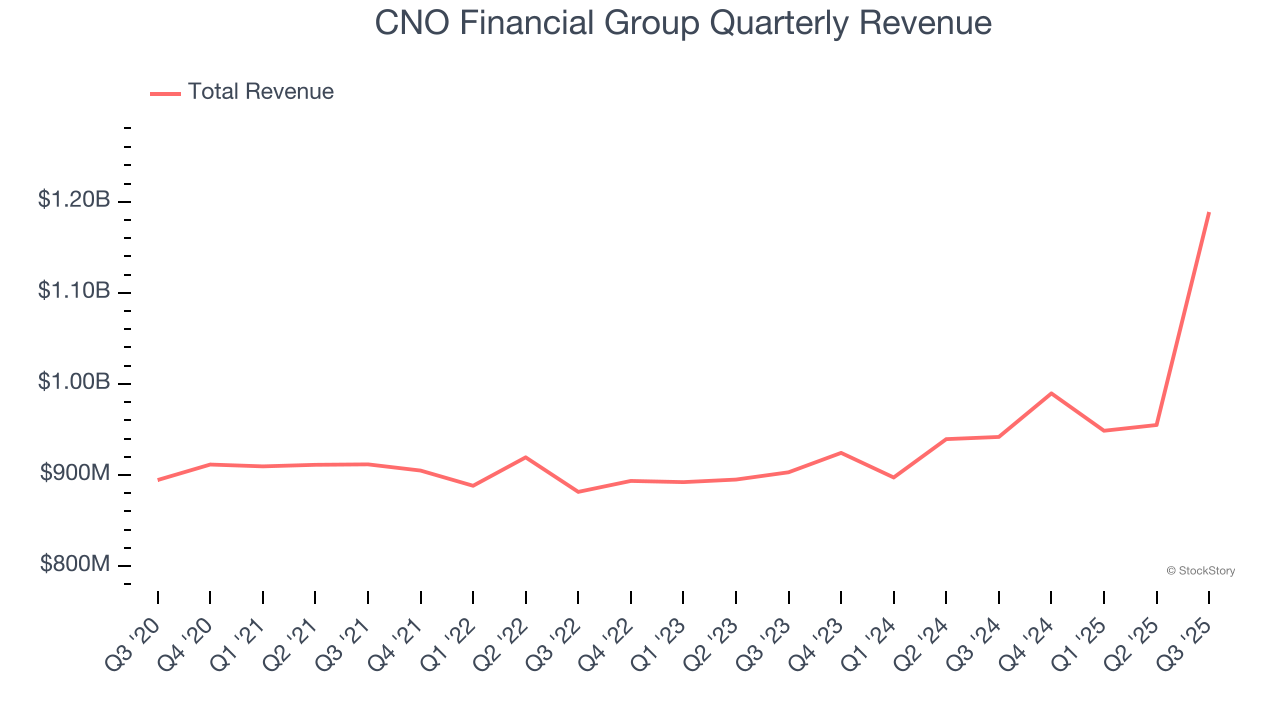
Long-term growth is the most important, but within financials, a half-decade historical view may miss recent interest rate changes and market returns. CNO Financial Group’s annualized revenue growth of 6.7% over the last two years is above its five-year trend, but we were still disappointed by the results.
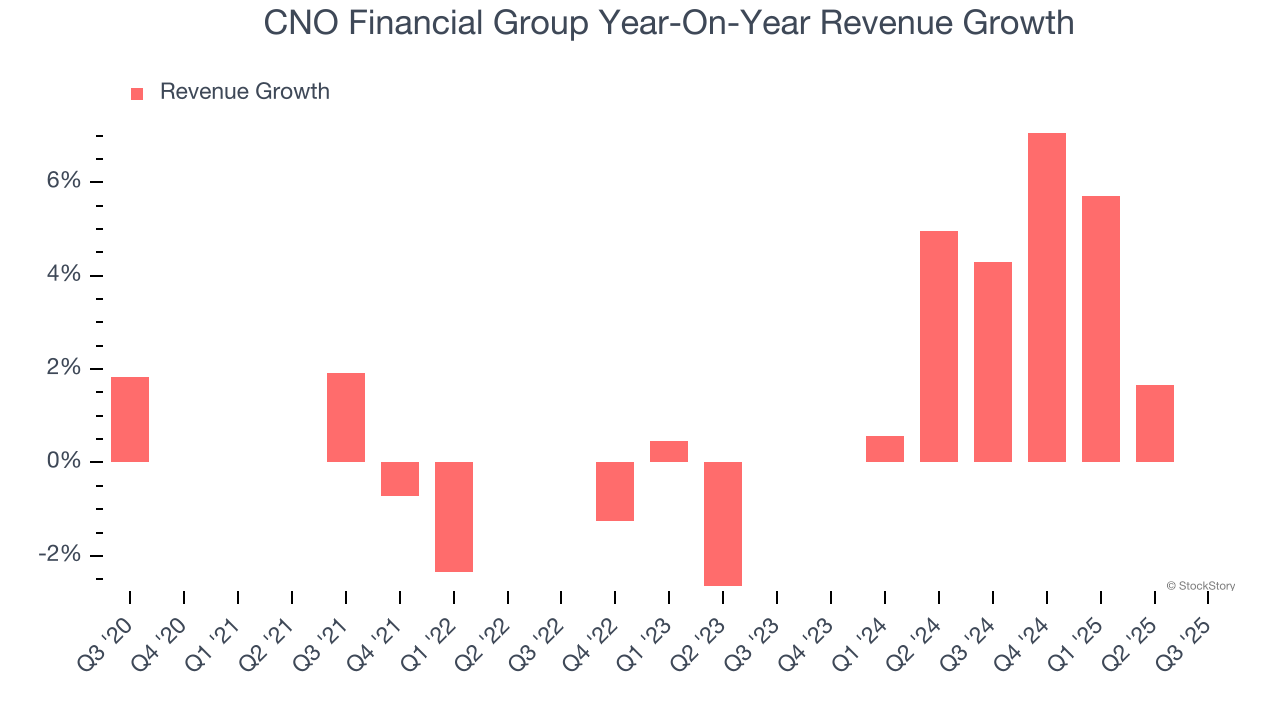
This quarter, CNO Financial Group reported robust year-on-year revenue growth of 26.2%, and its $1.19 billion of revenue topped Wall Street estimates by 22.7%.
Net premiums earned made up 68.1% of the company’s total revenue during the last five years, meaning insurance operations are CNO Financial Group’s largest source of revenue.
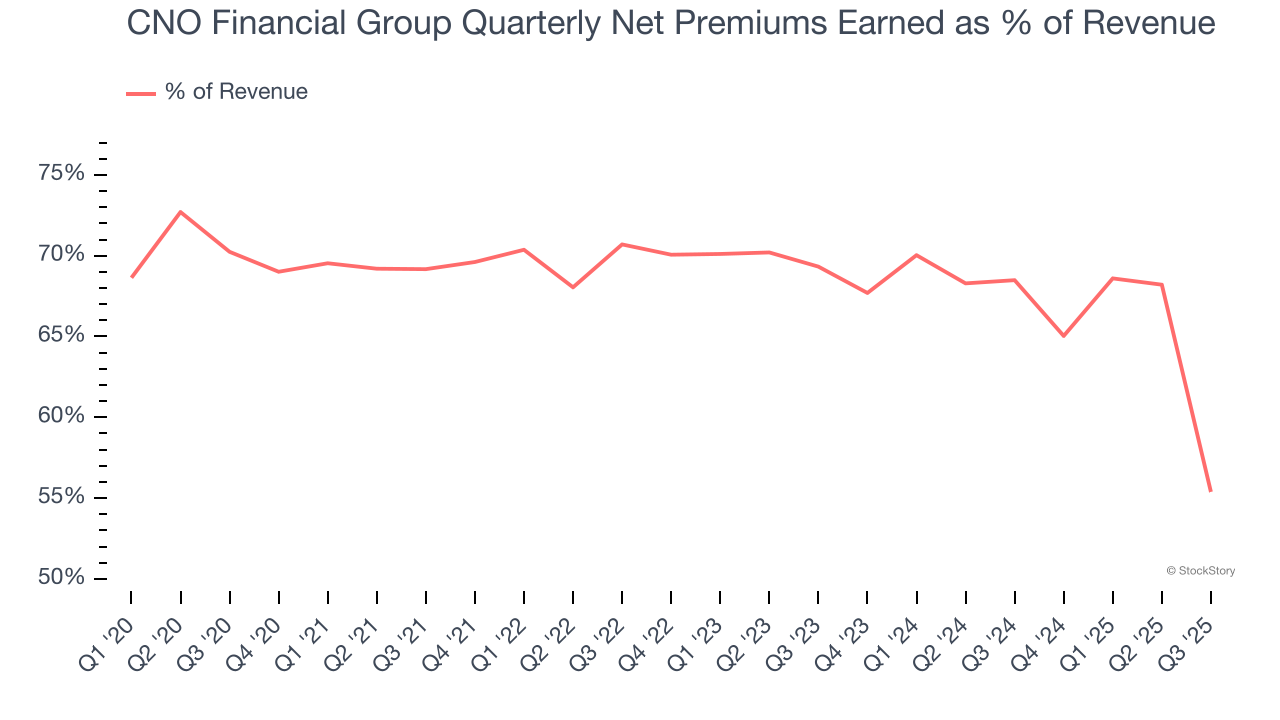
While insurers generate revenue from multiple sources, investors view net premiums earned as the cornerstone - its direct link to core operations stands in sharp contrast to the unpredictability of investment returns and fees.
While Wall Street chases Nvidia at all-time highs, an under-the-radar semiconductor supplier is dominating a critical AI component these giants can’t build without. Click here to access our free report one of our favorites growth stories.
Book Value Per Share (BVPS)
Insurance companies are balance sheet businesses, collecting premiums upfront and paying out claims over time. The float – premiums collected but not yet paid out – are invested, creating an asset base supported by a liability structure. Book value captures this dynamic by measuring:
- Assets (investment portfolio, cash, reinsurance recoverables) - liabilities (claim reserves, debt, future policy benefits)
BVPS is essentially the residual value for shareholders.
We therefore consider BVPS very important to track for insurers and a metric that sheds light on business quality because it reflects long-term capital growth and is harder to manipulate than more commonly-used metrics like EPS.
CNO Financial Group’s BVPS declined at a 5.7% annual clip over the last five years. However, BVPS growth has accelerated recently, growing by 27.1% annually over the last two years from $16.85 to $27.24 per share.
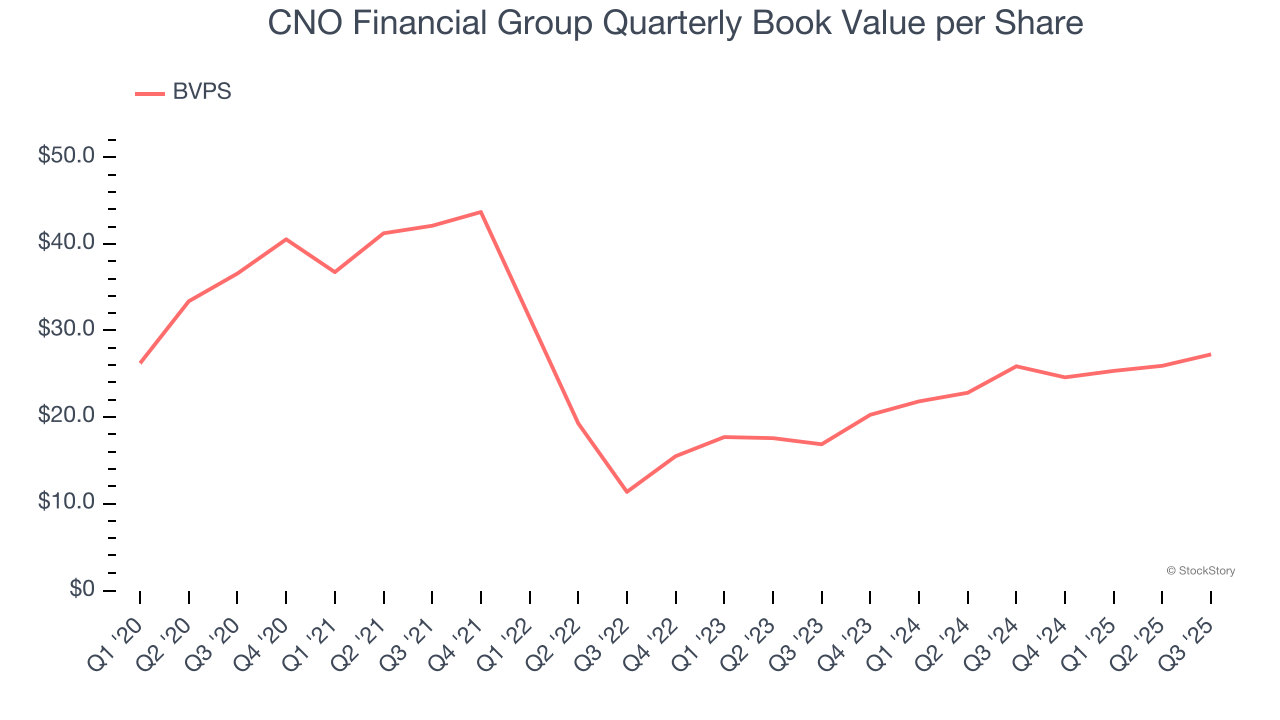
Over the next 12 months, Consensus estimates call for CNO Financial Group’s BVPS to grow by 56.8% to $39.45, elite growth rate.
Key Takeaways from CNO Financial Group’s Q3 Results
It was good to see CNO Financial Group beat analysts’ EPS expectations this quarter. We were also excited its revenue outperformed Wall Street’s estimates by a wide margin. On the other hand, its book value per share missed. Overall, we think this was a decent quarter with some key metrics above expectations. The stock remained flat at $39.59 immediately after reporting.
So do we think CNO Financial Group is an attractive buy at the current price? We think that the latest quarter is only one piece of the longer-term business quality puzzle. Quality, when combined with valuation, can help determine if the stock is a buy. We cover that in our actionable full research report which you can read here, it’s free for active Edge members.
Mentioned In This Article
Latest News
| Sep-11 | |
| Sep-10 | |
| Aug-27 | |
| Aug-07 | |
| Aug-06 | |
| Aug-05 | |
| Jul-31 | |
| Jul-31 | |
| Jul-30 | |
| Jul-30 | |
| Jul-16 | |
| Jun-17 | |
| May-12 | |
| May-06 | |
| May-02 |
