|
|
|

|
|||||
|
|
|
Record 2025 Sets the Stage for Next Phase of Growth
TORONTO, Dec. 02, 2025 (GLOBE NEWSWIRE) -- TRX Gold Corporation (TSX: TRX) (NYSE American: TRX) (the “Company” or “TRX Gold”) reported its results for the fourth quarter (“Q4 2025”) and year end August 31, 2025 (“fiscal 2025”). Financial results are available on the Company’s website at www.TRXgold.com.
Stephen Mullowney, TRX CEO commented: “In Q4 we achieved a record 6,404 ounces of gold poured and 6,977 ounces of gold sold at an average realized price of $3,363 per ounce, recognizing revenue of $23.5 million, gross profit of $12.6 million (54% margin) and Adjusted EBITDA1 of $12.7 million (54% margin). This performance continued into Q1 2026, with another quarterly production record of approximately 6,550 ounces of gold, sold at higher record gold prices. The Company is recapitalizing the business with internally generated cash flow as evidenced by working capital turning positive in Q4 2025. We expect that working capital will continue to improve and anticipate being fully recapitalized from a working capital perspective in Q2 2026. At the same time, the processing plant expansion has commenced and exploration continues, again being funded by cash flow from operations. We are set up well for fiscal 2026.”
Mr. Mullowney continued: “In 2025, our PEA on the Buckreef Gold expansion was a defining milestone, outlining a long-life, scalable asset with an NPV5% of $1.9 billion pre-tax ($1.2 billion after-tax) at US$4,000/oz gold. Additionally, subsequent to year-end we announced that the processing facility will be significantly larger than the 3,000 tonnes per day (“tpd”) plant as outlined in the PEA study. We will also be accelerating exploration plans on high-grade zones such as Stamford Bridge in fiscal 2026, where we have seen our best drill results to date, as well as other areas identified through our exploration program. Finally, over time we believe that the higher processing capacity and prospective new discoveries have the potential to significantly improve the already robust results of the PEA.”
Key highlights for Q4 and Year-End 2025 include:
Additional highlights subsequent to Year-End 2025:
Fiscal 2026 Outlook – Expected increase in annual gold production and planning for more growth:
Figure 1: Buckreef Gold’s Open Pit Mining Operations (Q4 2025)
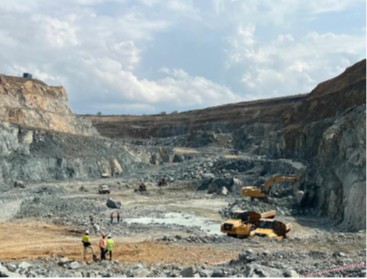
Figure 2: Load and Haul Operations at Buckreef Gold (Q4 2025)
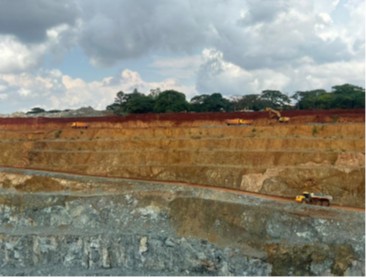
Figure 3: Load and Haul with New 350 Excavator and Haul Truck (Q4 2025)

Figure 4: Revised Process Flowsheet for the Upgraded and Expanded Plant
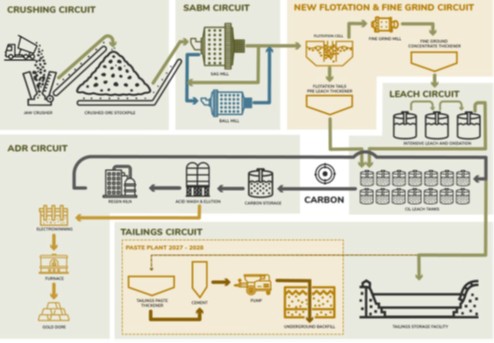
Figure 5: 18 Meter Diameter Pre-Leach Thickener

Figure 6: Pre-Leach Thickener Foundation Civils in progress

Figure 7: Aachen ® Reactor ready for shipment and Vendor Testwork Flotation Cells

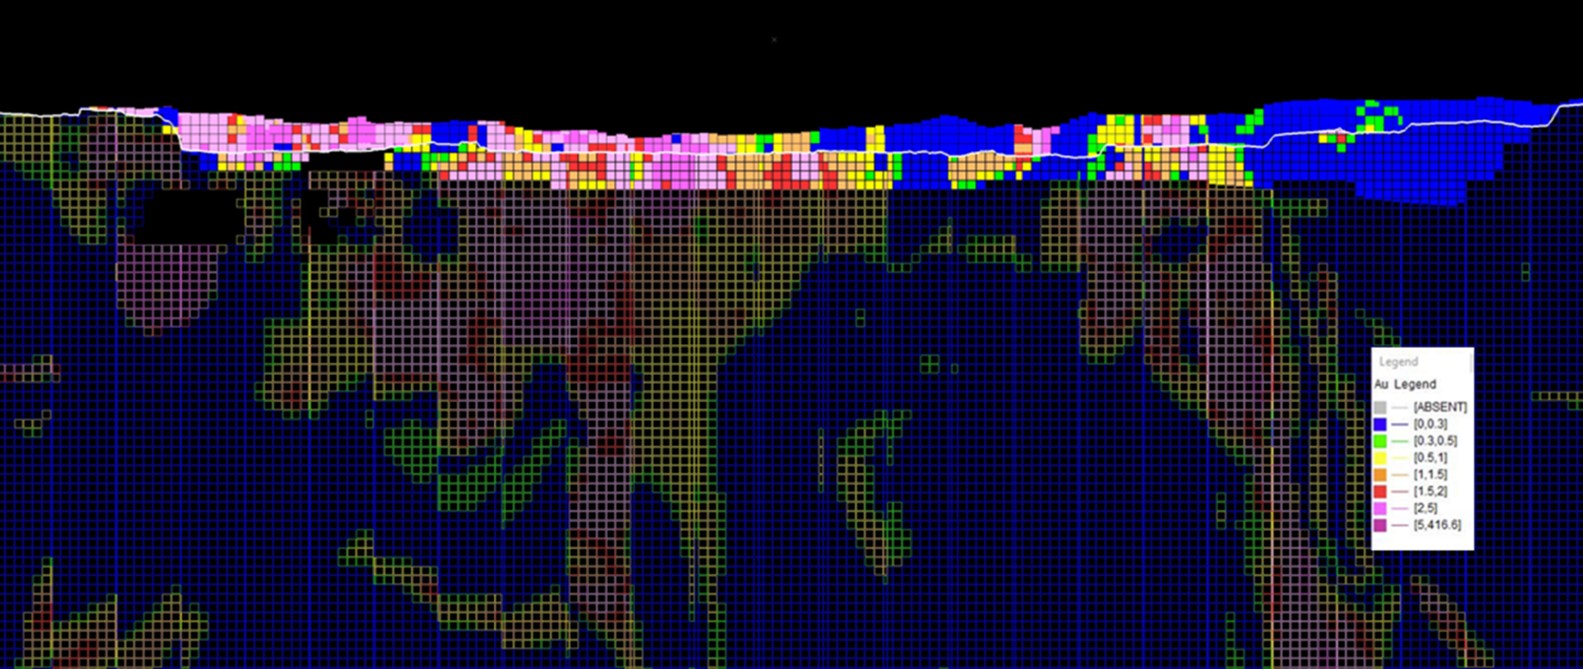
Figure 8: Buckreef Gold fiscal 2026 Mine Plan (including Ore Mined to Date above line)
Q4 2025 and Full Year 2025 Results Conference Call and Webcast Details
When: Wednesday, December 10th at 9:30 AM EST
Webcast link: https://www.c-meeting.com/web3/joinTo/MP9MKT3Z8WQC2Z/TBb9d2RtzOcagkpAL_wb-w
Conference call numbers:
Canada/USA TF: 1-833-752-3900
International Toll: +1-647-849-3080
A replay will be made available for 30 days following the call on the Company’s website.
About TRX Gold Corporation
TRX Gold is a high margin and growing gold company advancing the Buckreef Gold Project in Tanzania. Buckreef Gold includes an established open pit operation and 2,000 tonnes per day process plant with upside potential demonstrated in the May 2025 PEA. The PEA outlines average gold production of 62,000 oz per annum over 17.6 years, and US$1.9 billion pre-tax NPV5% at average life of mine gold price of US$4,000/oz3. The Buckreef Gold Project hosts a Measured and Indicated Mineral Resource of 10.8 million tonnes (“MT”) at 2.57 grams per tonne (“g/t”) gold containing 893,000 ounces (“oz”) of gold and an Inferred Mineral Resource of 9.1 MT at 2.47 g/t gold for 726,000 oz of gold. The leadership team is focused on creating both near-term and long-term shareholder value by increasing gold production to generate positive cash flow to fund the expansion as outlined in the PEA and grow Mineral Resources through exploration. TRX Gold’s actions are informed by the highest environmental, social and corporate governance (“ESG”) standards, as evidenced by the relationships and programs that the Company has developed during its nearly two decades of presence in the Geita Region, Tanzania.
Qualified Person
Mr. Richard Boffey, BE Mining (Hons) F AusIMM, Chief Operating Officer of TRX Gold Corporation, is the Company’s in-house Qualified Person under National Instrument 43-101 “Standards of Disclosure for Mineral Projects” (“NI 43-101”) and has reviewed and assumes responsibility for the scientific and technical content in this press release.
For investor or shareholder inquiries, please contact:
Investors:
Investor Relations
IR@TRXgold.com
+1-437-224-5241
+1 844 GOLD TRX (844-465-3879)
www.TRXgold.com
Non-IFRS Performance Measures
The Company has included certain non-IFRS measures in this news release. The following non-IFRS measures should be read in conjunction with the Company’s audited consolidated financial statements for the year ended August 31, 2025 filed on SEDAR+ and with the Securities and Exchange Commission (“SEC”), and included in the Company's Annual Report on Form 40-F and Annual Information Form for the year ended August 31, 2025. The financial statements and related notes of TRX Gold have been prepared in accordance with International Financial Reporting Standards (“IFRS”). Additional information has been filed electronically on SEDAR+ and with the SEC and is available online under the Company’s profile at www.sedarplus.ca and the Company’s filings with the SEC at www.sec.gov and on our website at www.TRXgold.com.
Adjusted EBITDA
Adjusted EBITDA is a non-IFRS performance measure and does not constitute a measure recognized by IFRS and does not have a standardized meaning defined by IFRS. Adjusted EBITDA may not be comparable to information in other gold producers’ reports and filings. Adjusted EBITDA is presented as a supplemental measure of the Company’s performance and ability to service its obligations. Adjusted EBITDA is frequently used by securities analysts, investors and other interested parties in the evaluation of companies in the industry, many of which present Adjusted EBITDA when reporting their results. Issuers present Adjusted EBITDA because investors, analysts and rating agencies consider it useful in measuring the ability of those issuers to meet their obligations. Adjusted EBITDA represents net income before interest, income taxes, and depreciation and also eliminates the impact of a number of items that are not considered indicative of ongoing operating performance.
The following table provides a reconciliation of net income and comprehensive income to Adjusted EBITDA per the financial statements for the three and twelve months ended August 31, 2025.
| Three Months Ended | Three Months Ended | Twelve Months Ended | Twelve Months Ended | |||||
| August 31, 2025 | August 31, 2024 | August 31, 2025 | August 31, 2024 | |||||
| Net income and comprehensive income per financial statements | 5,265 | 3,284 | 6,566 | 3,510 | ||||
| Add: | ||||||||
| Depreciation | 1,482 | 749 | 3,791 | 2,195 | ||||
| Interest, net and other expense | 429 | 782 | 2,360 | 2,011 | ||||
| Non-recurring severance and legal expenses | 1 | - | 432 | - | ||||
| Income tax expense | 4,946 | 3,040 | 7,891 | 6,826 | ||||
| Change in fair value of derivative financial instruments | 199 | (1,948 | ) | (1,262 | ) | (1,023 | ) | |
| Share-based payment expense | 365 | 250 | 2,247 | 1,743 | ||||
| Adjusted EBITDA | 12,687 | 6,157 | 22,025 | 15,262 | ||||
Average realized price per ounce gold sold
Average realized price per ounce of gold sold is a non-IFRS measure and does not constitute a measure recognized by IFRS and does not have a standardized meaning defined by IFRS. Average realized price per ounce of gold sold is calculated by dividing revenue by ounces of gold sold. It may not be comparable to information in other gold producers’ reports and filings.
| Three Months Ended | Three Months Ended | Twelve Months Ended | Twelve Months Ended | |||||||||
| August 31, 2025 | August 31, 2024 | August 31, 2025 | August 31, 2024 | |||||||||
| Revenue per financial statements | $ | 23,504 | $ | 13,622 | $ | 57,613 | $ | 41,158 | ||||
| Interest recognized from Auramet prepaid gold purchase agreement | (42 | ) | - | (115 | ) | - | ||||||
| Revenue recognized from OCIM prepaid gold purchase agreement | - | (958 | ) | (2,319 | ) | (3,048 | ) | |||||
| Revenue from gold sales | 23,462 | 12,664 | 55,179 | 38,110 | ||||||||
| Ounces of gold sold | 6,977 | 5,715 | 19,213 | 19,075 | ||||||||
| Ounces of gold sold from OCIM prepaid gold purchase agreement | - | (465 | ) | (1,023 | ) | (1,587 | ) | |||||
| Ounces from gold sales (net of OCIM prepaid gold purchase agreement) | 6,977 | 5,250 | 18,190 | 17,489 | ||||||||
| Average realized price (gross) | $ | 3,369 | $ | 2,384 | $ | 2,999 | $ | 2,158 | ||||
| Average realized price (net) | $ | 3,363 | $ | 2,412 | $ | 3,033 | $ | 2,179 | ||||
The Company has included “average realized price per ounce of gold sold” and “Adjusted EBITDA” as non-IFRS performance measures throughout this news release as TRX Gold believes that these generally accepted industry performance measures provide a useful indication of the Company’s operational performance. The Company believes that certain investors use this information to evaluate the Company’s performance and ability to generate cash flow. Accordingly, they are intended to provide additional information and should not be considered in isolation or as a substitute for measures of performance prepared in accordance with IFRS.
Forward-Looking and Cautionary Statements
This press release contains certain forward-looking statements as defined in the applicable securities laws. All statements, other than statements of historical facts, are forward-looking statements. Forward-looking statements are frequently, but not always, identified by words such as “expects”, “anticipates”, “believes”, “hopes”, “intends”, “estimated”, “potential”, “possible” and similar expressions, or statements that events, conditions or results “will”, “may”, “could” or “should” occur or be achieved. Forward-looking statements relate to future events or future performance and reflect TRX Gold management’s expectations or beliefs regarding future events and include, but are not limited to, statements with respect to anticipated gold production, anticipated capital and exploration expenditures, continued operating cash flow, expansion of its process plant, estimation of mineral resources, ability to develop value creating activities, recoveries, subsequent project testing, success, scope and viability of mining operations, and the timing and amount of estimated future production.
Although TRX Gold believes the expectations expressed in such forward-looking statements are based on reasonable assumptions, such statements are not guarantees of future performance. The actual achievements of TRX Gold or other future events or conditions may differ materially from those reflected in the forward-looking statements due to a variety of risks, uncertainties and other factors. These risks, uncertainties and factors include general business, legal, economic, competitive, political, regulatory and social uncertainties; actual results of exploration activities and economic evaluations; fluctuations in currency exchange rates; changes in costs; future prices of gold and other minerals; mining method, production profile and mine plan; delays in exploration, development and construction activities; changes in government legislation and regulation; the ability to obtain financing on acceptable terms and in a timely manner or at all; contests over title to properties; employee relations and shortages of skilled personnel and contractors; the speculative nature of, and the risks involved in, the exploration, development and mining business. These risks are set forth in reports that TRX Gold files with the SEC and the various Canadian securities authorities. You can review and obtain copies of these filings from the SEC's website at http://www.sec.gov/edgar.shtml and the Company’s profile on the System for Electronic Document Analysis and Retrieval (“SEDAR+”) at www.sedarplus.ca.
The disclosure contained in this press release of a scientific or technical nature relating to the Company’s Buckreef Project has been summarized or extracted from the technical report prepared in accordance with NI 43-101 – Standards of Disclosure for Mineral Projects on the Buckreef Gold Project (“Buckreef Gold”) titled Preliminary Economic Assessment and Updated Mineral Resource Estimate of the Buckreef Gold Mine Project, Tanzania (“PEA”) with an effective date of April 15, 2025. The PEA was prepared in accordance with NI 43-101 guidelines by P&E Mining Consultants Inc. (“P&E”). Input to this PEA was also provided by D.E.N.M. Engineering Ltd. (“D.E.N.M.”). The information contained herein is subject to all of the assumptions, qualifications and procedures set out in, and is qualified in its entirety by reference to the full text of, the PEA and reference should be made to the full details of the PEA which has been filed with the applicable regulatory authorities and is available on the Company’s profile at www.sedarplus.ca.
The information contained in this press release is as of the date of the press release and TRX Gold assumes no duty to update such information.
1 Refer to “Non-IFRS Performance Measures” section.
2 Base case NPV5% of US$701.0 million pre-tax, or US$442.2 million after tax at consensus forecast case gold prices (US$2,707/oz year 1, US$2,646/oz year 2, US$2,495/oz year 3, US$2,400/oz year 4, US$2,245/oz thereafter).
3 Base case NPV5% of US$701.0 million pre-tax, or US$442.2 million after tax at consensus forecast case gold prices (US$2,707/oz year 1, US$2,646/oz year 2, US$2,495/oz year 3, US$2,400/oz year 4, US$2,245/oz thereafter).
Photos accompanying this announcement are available at:
https://www.globenewswire.com/NewsRoom/AttachmentNg/0548376f-b732-4e8d-9261-8e6a6d11e73d
https://www.globenewswire.com/NewsRoom/AttachmentNg/914e8032-cad6-49a0-ba3f-2bdb79ac6665
https://www.globenewswire.com/NewsRoom/AttachmentNg/386c0025-0828-4f72-abcb-293c7bb33131
https://www.globenewswire.com/NewsRoom/AttachmentNg/833647dd-aa8d-47bd-b725-54436bf10e0d
https://www.globenewswire.com/NewsRoom/AttachmentNg/60cbc31b-2b7e-4f6f-9b77-ae5ac0b7d399
https://www.globenewswire.com/NewsRoom/AttachmentNg/b1389efa-cf43-48a2-a7eb-458f787a171a
https://www.globenewswire.com/NewsRoom/AttachmentNg/834d6547-5b4c-400c-a94f-152d632276c9
https://www.globenewswire.com/NewsRoom/AttachmentNg/bae01cbe-d846-42f7-8176-1556ccbc91cd
| Jul-15 | |
| Jul-15 | |
| Jul-15 | |
| Jun-17 | |
| Jun-05 | |
| Apr-23 | |
| Apr-22 | |
| Apr-16 | |
| Apr-16 | |
| Apr-15 | |
| Apr-14 | |
| Apr-14 | |
| Apr-10 | |
| Apr-08 | |
| Mar-09 |
Join thousands of traders who make more informed decisions with our premium features. Real-time quotes, advanced visualizations, alerts, and much more.
Learn more about Finviz Elite