|
|
|

|
|||||
|
|
|
Zumiez Inc. ZUMZ reported impressive third-quarter fiscal 2025 results, wherein the top and bottom lines surpassed the Zacks Consensus Estimate and improved year over year. Also, comparable sales (comps) improved year over year.
The fiscal third-quarter results reflect continued resilience in its North America business and strong momentum from private label expansion. The company also increased its fiscal 2025 sales outlook. As a result, shares of this leading global lifestyle retailer increased 14.1% in the after-market trading session yesterday.

Zumiez Inc. price-consensus-eps-surprise-chart | Zumiez Inc. Quote
ZUMZ posted quarterly earnings of 55 cents per share, which beat the Zacks Consensus Estimate of 27 cents. Also, the bottom line increased from 6 cents in the year-earlier quarter.
Total net sales of $239.1 million surpassed the Zacks Consensus Estimate of $234 million and increased 7.5% from $222.5 million in the prior-year quarter. This growth was largely driven by the strong performance in the North America business, which remained robust despite growing macroeconomic uncertainty, influenced by global trade policy developments.
Comps rose 7.6% year over year, marking the sixth consecutive quarter of growth. The Zacks Consensus Estimate for comps growth was pegged at 4% for the quarter under review. The rise in comps was driven by higher dollars per transaction and an increase in the number of transactions. Dollars per transaction rose due to higher average unit retail, while units per transaction were approximately flat year over year.
From a regional perspective, North America’s net sales were $202.8 million, up 8.6% year over year. Other international sales, comprising Europe and Australia, were $36.3 million, up 1.7% year over year. Excluding the foreign currency translation impacts, North America net sales rose 8.7%, and other international net sales increased 3.1% over the prior-year quarter.
Comps in North America rose 10%, marking the seventh consecutive quarter of growth, while international comps declined 3.9% in the quarter under review.
By category, women’s merchandise delivered the strongest comps rise, followed by hard goods, men’s and accessories. Footwear was the only category with negative comps.
Gross profit jumped 14.7% year over year to $89.8 million, whereas the gross margin expanded 240 bps to 37.6%. This rise was mainly due to a 110-basis-point leverage in store occupancy costs due to higher sales and the closure of underperforming stores, 100 basis points of product margin improvement, and 30 basis points of benefit from reduced inventory shrinkage.
Selling, general and administrative (SG&A) costs of $78 million increased 2.7% from $75.9 million in the prior-year quarter. As a percentage of sales, SG&A was 34.1%, up 140 basis points from the year-ago quarter.
This increase was driven by a 110-basis-point reduction in non-wage store operating costs and 80 basis points of wage leverage related to higher sales and the closure of underperforming stores. These benefits were partially offset by a 40-basis-point increase associated with annual incentive compensation.
Zumiez reported an operating income of $11.8 million compared with $2.4 million in the year-ago quarter.
As of Nov. 1, 2025, the company held $104.5 million in cash and current marketable securities compared with $99.3 million as of Nov. 2, 2024. The increase was primarily driven by $50.5 million in cash flow from operations and the release of $3 million in restricted cash, partially offset by $38.3 million used for share repurchases and $12.5 million in capital expenditure. As of Nov. 1, 2025, the company had no debt.
Total shareholders’ equity was $298.5 million. In the fiscal third quarter, the company repurchased 0.3 million shares at an average cost of $18.61 per share, including commissions, for a total expenditure of $5.4 million. As of Nov. 1, 2025, $1.7 million remained under the $15-million share repurchase authorization approved by the board on Jun. 4, 2025.
This Zacks Rank #4 (Sell) company ended the quarter with $180.7 million in inventory, a 3.5% decrease from $187.2 million in the prior-year period. On a constant-currency basis, inventory levels were down 5.1% year over year.
As of Nov. 29, 2025, Zumiez operated 728 stores, including 569 in the United States, 46 in Canada, 85 in Europe and 28 in Australia. Management continues to expect six store openings in fiscal 2025, comprising five in North America and one in Australia. They also plan to close 21 stores in fiscal 2025, including up to 18 in the United States, one in Canada and two in Europe.
Net sales for 31 days ended Dec. 2, 2025, increased 7.5% from 31 days ended Dec. 3, 2024. Comps for the period rose 6.6% year over year, with foreign exchange positively benefiting total sales growth by 1.7%.
From a regional standpoint, net sales for the North America business increased 6.7% for the 31-day period, while net sales in other international markets increased 10.6%. Excluding the impacts of foreign currency translation, North America net sales increased 6.7%, and international net sales increased 2.5% from the prior-year period.
Comps in North America rose 7.8% for the 31-day period ended Dec. 2, 2025, while comps in other international markets increased 2.6%. By category, hard goods delivered the strongest comps performance, followed by women’s, accessories and men’s. Footwear was the only category with negative comps.
Total sales are expected between $291 million and $296 million for the fourth quarter of fiscal 2025, indicating growth of 4-6%.
Total comps are planned to increase 2.5-4%. Expectations reflect continued strength in North America, where comps are projected to grow between 4.5% and 6.5%. Comps in the international business are expected to be more challenging due to the anniversary of promotional activity from the fourth quarter of fiscal 2024. International comps are projected to decline in the low-single digits, though overall product margin dollars are expected to increase year over year, supported by ongoing efforts to drive full-price selling.
For the fiscal fourth quarter, the product margin is expected to increase modestly from the prior year. The operating margin is anticipated between 8% and 8.5% of sales, and earnings per share are projected between 97 cents and $1.07, whereas it reported 78 cents in the prior-year period.
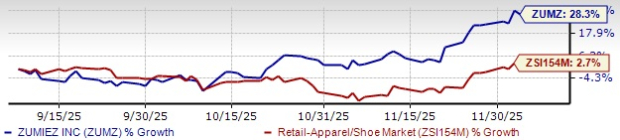
ZUMZ Stock Past 3-Month Performance
For fiscal 2025, Zumiez anticipates 4.5-5% year-over-year sales growth, compared with the prior mentioned rise of 3-4% despite the closure of 33 stores in fiscal 2024 and 21 store closures planned in fiscal 2025, which combined are estimated to have a negative impact of $15 million on sales for fiscal 2025.
Product margin expansion of 40-50 basis points is anticipated in 2025, whereas it achieved 70 basis points of improvement in fiscal 2024. Additional gross margin leverage is expected across expense categories, such as occupancy, distribution, and logistics.
Selling, general and administrative expense rates are expected to remain relatively flat as a percentage of sales compared with fiscal 2024, driven by ongoing expense discipline while continuing to invest in key long-term initiatives. These expectations include the previously disclosed $3.6 million settlement of a wage and hour lawsuit in California, as well as increased incentive compensation tied to stronger performance.
Collectively, these factors are expected to drive year-over-year improvement in operating margins and net income for fiscal 2025. Anticipated earnings per share range between 57 cents and 67 cents, whereas the company incurred a loss of 9 cents in fiscal 2024.
Capital expenditure for fiscal 2025 is expected between $10 million and $12 million, whereas it reported $15 million in fiscal 2024 and $20.4 million in fiscal 2023. Shares of the company have jumped 28.3% in the past three months compared with the industry’s growth of 2.7%.
We have highlighted three better-ranked stocks, namely, FIGS Inc. FIGS, Boot Barn Holdings, Inc. BOOT and Allbirds Inc. BIRD.
FIGS is a direct-to-consumer healthcare apparel and lifestyle brand. It sports a Zacks Rank #1 (Strong Buy) at present. You can see the complete list of today’s Zacks #1 Rank stocks here.
The Zacks Consensus Estimate for FIGS’ current financial-year earnings and sales indicates growth of 450% and 7%, respectively, from the year-ago actuals. FIGS delivered a trailing four-quarter average earnings surprise of 87.5%.
Boot Barn operates as a lifestyle retail chain devoted to western and work-related footwear, apparel and accessories. It currently carries a Zacks Rank of 2 (Buy).
The Zacks Consensus Estimate for Boot Barn’s fiscal 2026 earnings and sales implies growth of 20.5% and 16.2%, respectively, from the year-ago actuals. Boot Barn delivered a trailing four-quarter average earnings surprise of 5.4%.
Allbirds is a lifestyle brand with naturally derived materials to make footwear and apparel products. It carries a Zacks Rank of 2 at present.
The Zacks Consensus Estimate for Allbirds’ current financial-year sales and earnings indicates a decline of 15.1% and growth of 19.9%, respectively, from the year-ago actuals. BIRD delivered a trailing four-quarter average earnings surprise of 18.5%.
Want the latest recommendations from Zacks Investment Research? Today, you can download 7 Best Stocks for the Next 30 Days. Click to get this free report
This article originally published on Zacks Investment Research (zacks.com).
| Jul-22 | |
| Jul-16 | |
| Jul-06 | |
| Jun-25 | |
| Jun-24 | |
| Jun-22 | |
| Jun-19 | |
| Jun-19 | |
| Jun-19 | |
| Jun-18 | |
| Jun-18 | |
| Jun-18 | |
| Jun-18 | |
| Jun-18 | |
| Jun-18 |
Allbirds sells IP, rebrands as Smartbird in AI infrastructure shift
BIRD +8.94%
Retail Insight Network
|
Join thousands of traders who make more informed decisions with our premium features. Real-time quotes, advanced visualizations, alerts, and much more.
Learn more about Finviz Elite