|
|
|

|
|||||
|
|
|
The Russell 2000 has soared to start the year, up 7.5% through Jan. 23, while the S&P 500 has been flat.
Investors have been anticipating a rotation away from the S&P 500 due to its high valuation.
After the Russell 2000 beat the S&P 500 for 14 days in a row, the streak came to an end on Jan. 23.
Coming into 2026, the S&P 500 (SNPINDEX: ^GSPC) has been on one of its strongest multi-year streaks in history. From 2023-2025, the index jumped a whopping 78%.
However, that three-year period on the market has also stood out for another reason. The gap in performance between the S&P 500, which holds large-cap stocks, and the small-cap Russell 2000, was one of the biggest as you can see from the chart below.
Where to invest $1,000 right now? Our analyst team just revealed what they believe are the 10 best stocks to buy right now. Continue »
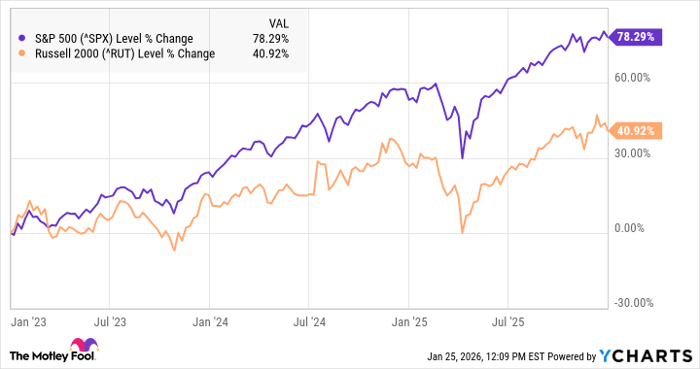
The S&P 500 has essentially doubled the return of the Russell 2000 during that period. That gap owes to the emergence of AI, which has been led by the "Magnificent Seven" stocks, which now represent roughly a third of the S&P 500's market cap, as well as other megacap tech stocks that have surged in the AI boom.
The chart above is also notable because small caps typically outperform large caps during bull markets, as they are more volatile, riskier, and more exposed to the macro economy.
The trend over the last three years now seems to be reversing. Through Jan. 23, the Russell 2000 has easily outpaced the S&P 500.
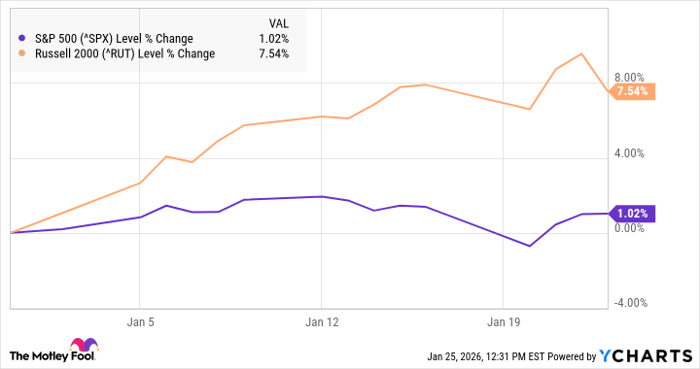
Not only is the Russell 2000 handsomely beating its large-cap peer, but it has also put together its longest streak of daily outperformance since 1996. To start off the year, the Russell 2000 beat the S&P 500 for 14 straight sessions before falling 1.8% on Jan. 23 to end the streak.
That rotation suggests investors expect the bull market to broaden, given the S&P 500's historically high valuation and the relative discount of the Russell 2000. Let's take a look back in history at another time during a tech-driven bull market when the Russell 2000 beat the S&P 500 over 16 straight sessions.
Image source: Getty Images.
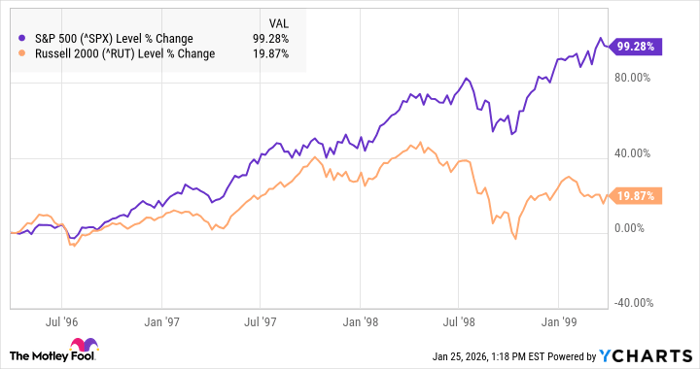
Investors didn't know it at the time, but 1996 ended up being the second year of a five-year dot-com boom that peaked in March 2000.
The streak April and May of that year saw the Russell 2000 open gain 3% while the S&P 500 fell 1%. However, it turned out to not be predictive of the coming years as the S&P 500 would outperform the Russell 2000 through the dot-com era. In fact, in the three years from March 31, 1996 to March 31, 1999, The S&P 500 jumped 99% compared to just a 20% gain for the Russell 2000.
A lot of factors played into the S&P 500's surge during the dot-com era, and a streak even as long as 14 or 16 days isn't necessarily predictive of future returns.
However, there are a number of reasons to believe that the Russell 2000 will beat the S&P 500 this year as small caps are still much cheaper, and investors are looking to diversify away from the "Magnificent Seven."
For example, the SPDR S&P 500 ETF now trades at a price-to-earnings ratio of 27.9, compared to the iShares Russell 2000 ETF (NYSEMKT: IWM) at just 19.4.
Additionally, the S&P 500 has now beaten the Russell 2000 for five years in a row, coming into 2026, so a reversal in that trend seems overdue.
For investors, holding the S&P 500 at this point doesn't seem like a mistake, but if a majority of your portfolio is in S&P 500 index funds or stocks like the "Magnificent Seven" that make up a significant portion of the S&P 500, you may want to consider diversifying into a small-cap ETF like the IWM or a growth alternative like the Vanguard Russell 2000 Growth Index Fund ETF (NASDAQ: VTWG).
One streak might not be predictive, but there are other reasons to bet on small caps as the bull market matures.
Before you buy stock in iShares Trust - iShares Russell 2000 ETF, consider this:
The Motley Fool Stock Advisor analyst team just identified what they believe are the 10 best stocks for investors to buy now… and iShares Trust - iShares Russell 2000 ETF wasn’t one of them. The 10 stocks that made the cut could produce monster returns in the coming years.
Consider when Netflix made this list on December 17, 2004... if you invested $1,000 at the time of our recommendation, you’d have $464,439!* Or when Nvidia made this list on April 15, 2005... if you invested $1,000 at the time of our recommendation, you’d have $1,150,455!*
Now, it’s worth noting Stock Advisor’s total average return is 949% — a market-crushing outperformance compared to 195% for the S&P 500. Don't miss the latest top 10 list, available with Stock Advisor, and join an investing community built by individual investors for individual investors.
*Stock Advisor returns as of January 25, 2026.
Jeremy Bowman has no position in any of the stocks mentioned. The Motley Fool has no position in any of the stocks mentioned. The Motley Fool has a disclosure policy.
| Jul-20 | |
| Jul-20 | |
| Jul-20 | |
| Jul-20 | |
| Jul-20 | |
| Jul-20 | |
| Jul-20 | |
| Jul-18 | |
| Jul-18 | |
| Jul-18 | |
| Jul-17 | |
| Jul-17 | |
| Jul-17 | |
| Jul-17 | |
| Jul-16 |
Join thousands of traders who make more informed decisions with our premium features. Real-time quotes, advanced visualizations, alerts, and much more.
Learn more about Finviz Elite