|
|
|

|
|||||
|
|
|
Las Vegas Sands Corp. LVS closed 2025 with clear evidence of strong operating leverage at Marina Bay Sands, reinforcing Singapore’s role as the company’s primary earnings engine. LVS reported a record $806 million of EBITDA from the property in the fourth quarter of 2025, with full-year EBITDA coming at approximately $2.9 billion. The results underscore Marina Bay Sands’ ability to convert revenue growth into profitability, even as operating conditions across global gaming markets remain uneven.
This performance reflects the underlying economics of the Singapore operation, where the cost structure scales efficiently as volumes increase. As gaming volumes, hotel occupancy and non-gaming activity strengthened through 2025, incremental revenues were absorbed across a largely stable operating framework. This dynamic likely supported earnings growth, with EBITDA remaining resilient despite inflationary pressures and the impact of the higher mass gaming tax rate.
LVS also pointed to disciplined cost management and the high-quality mix of Singapore revenues as supporting factors. Premium mass gaming, strong room rates and resilient non-gaming demand continued to drive revenue growth without requiring proportionate increases in operating spend. Unlike Macao, where promotional intensity and mix shifts toward premium and rolling play have pressured margins, Singapore’s operating environment has supported more efficient EBITDA flow-through.
Looking ahead, the efficient conversion of revenues into earnings supports a more balanced consolidated earnings profile for LVS. While regional performance remains mixed, Marina Bay Sands’ ability to generate structurally high-margin EBITDA highlights the efficiency embedded within the Singapore operating model. As revenues continue to build on a cost base that remains well-contained relative to growth, EBITDA contribution from Singapore is becoming an increasingly visible and durable component of LVS’ overall financial framework.
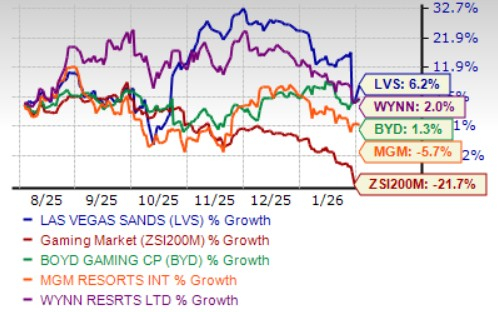
Shares of Las Vegas Sands have gained 6.2% in the past six months against the industry’s 21.7% decline. In the same time frame, other industry players like Wynn Resorts, Limited WYNN and Boyd Gaming Corporation BYD have risen 2% and 1.3%, respectively, while MGM Resorts International MGM has lost 5.7%.
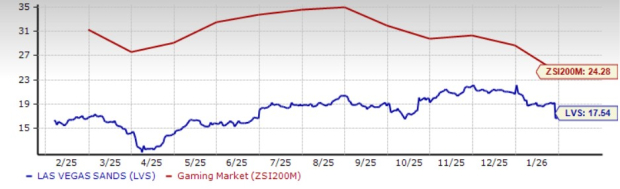
LVS stock is currently trading at a discount. It is currently trading at a forward 12-month price-to-earnings (P/E) multiple of 17.54, below the industry average of 24.28. Conversely, industry players, such as Wynn Resorts, Boyd Gaming and MGM Resorts have P/E ratios of 20.83, 10.79 and 15.65, respectively.
The Zacks Consensus Estimate for Las Vegas Sands’ 2026 earnings per share (EPS) has been revised downward in the past 30 days.
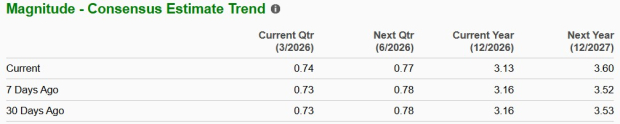
LVS’ 2026 EPS estimates indicate a rise of 4% year over year. Conversely, industry players like Wynn Resorts and Boyd Gaming are likely to witness an increase of 24.8% and 10.7%, respectively. MGM Resorts' 2026 EPS indicates a decline of 11.7% year over year.
LVS stock currently has a Zacks Rank #3 (Hold). You can see the complete list of today’s Zacks #1 Rank (Strong Buy) stocks here.
Want the latest recommendations from Zacks Investment Research? Today, you can download 7 Best Stocks for the Next 30 Days. Click to get this free report
This article originally published on Zacks Investment Research (zacks.com).
| Jul-15 | |
| Jul-14 | |
| Jul-13 | |
| Jul-13 | |
| Jul-13 | |
| Jul-13 | |
| Jul-10 | |
| Jul-10 | |
| Jul-10 | |
| Jul-09 | |
| Jul-07 | |
| Jul-06 | |
| Jul-01 | |
| Jul-01 | |
| Jun-26 |
Join thousands of traders who make more informed decisions with our premium features. Real-time quotes, advanced visualizations, alerts, and much more.
Learn more about Finviz Elite