|
|
|

|
|||||
|
|
|
Multiple academic studies suggest that for retail investors, the road to consistent, profitable trading is riddled with potholes. In fact, numerous wide-ranging academic studies suggest that 80% of retail traders are unprofitable and quit within two years. Worse yet, the success probability drops to just 1% for day traders. That said, despite the daunting success rate data, I have learned that achieving profitability is possible and worth pursuing.
However, the unfortunate fact is that most retail investors focus on things they shouldn’t, such as stale macroeconomic data, complex trading systems, and short-term trading. In today’s commentary, I will draw from my more than two decades of investing experience to come up with eleven simple but effective steps to achieving profitability. I think that you will find these steps straightforward, sensible, and easy to implement on day #1.
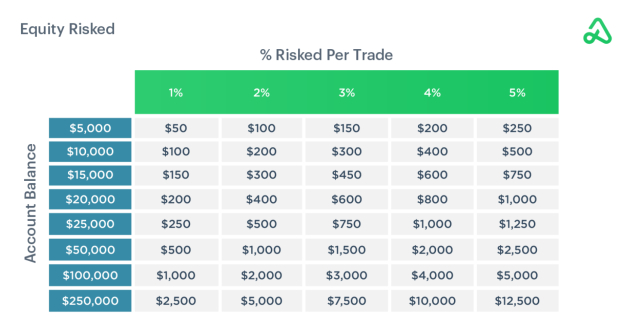
The number one mistake I see amateur investors make is position sizing too large. Imagine that you have an account size of $250,000. If you risk your entire account on a trade and take a 5% stop loss, your loss $12,500. The problem with position sizing too large is that the outcome of any given trade is never certain (regardless of how much conviction you may have). Whether it’s George Soros or Stanley Druckenmiller, the best investors all suffer losing periods. In the hypothetical instance above, if you suffer five consecutive losses (which is almost guaranteed to happen at some point), you have just blown half your account.
In an alternate scenario, if you risk the same 5% per trade but on a $25,000 position size, you will have only lost $6,250. Rule #1 as an investor should always be risk management. If you protect your downside, the upside will take care of itself.
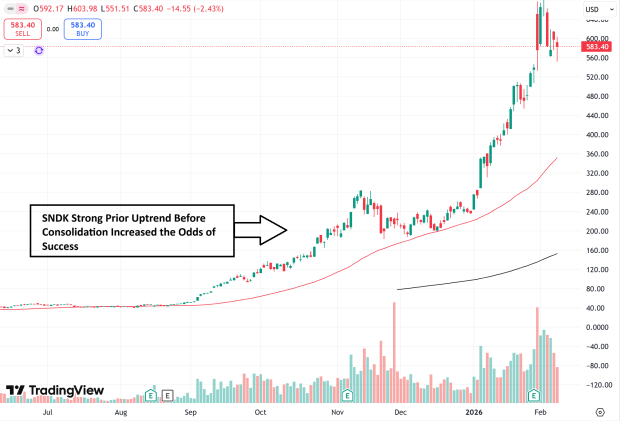
Another common mistake investors make is buying stocks in a downtrend. Amateur investors often want to feel smart, so they try to pick bottoms. That said, often the end of the downside is difficult to predict. Instead, investors should recount Isaac Newton’s first law of motion, that is, “A body in motion stays in motion.”Investors can dramatically increase their odds by buying a stock that is already up trending and above its moving averages. As William O’Neil once said, “It is one of the great paradoxes of the stock market that what seems too high usually goes higher and what seems too low, usually goes lower.”
Data storage stocks like Western Digital (WDC), Seagate Technology (STX), Micron (MU), and Sandisk (SNDK) are fantastic examples of the power of uptrends. SNDK doubled in 2025 and then consolidated. While most investors would think the fun is over, SNDK has already doubled in 2026, underscoring the power of momentum and price trends.
A common pitfall for new investors is obsessing over short-term price action. Unfortunately, short and intraday time frames often lead to investor losses. Short-term time frames are unpredictable and noisy. Stick to the daily, weekly, and monthly timeframes to block out the noise and observe the underlying trend.
Most new traders focus on finding the next hot stock pick while ignoring sound trading mechanics. The following quote from Paul Tudor Jones changed the way I looked at risk management forever and took my trading to the next level:
“5:1 (risk/reward. Five to one means I’m risking one dollar to make five. What five-to-one does is allow you to have a hit ratio of 20%. I can actually be a complete imbecile. I can be wrong 80% of the time, and I’m still not going to lose.”
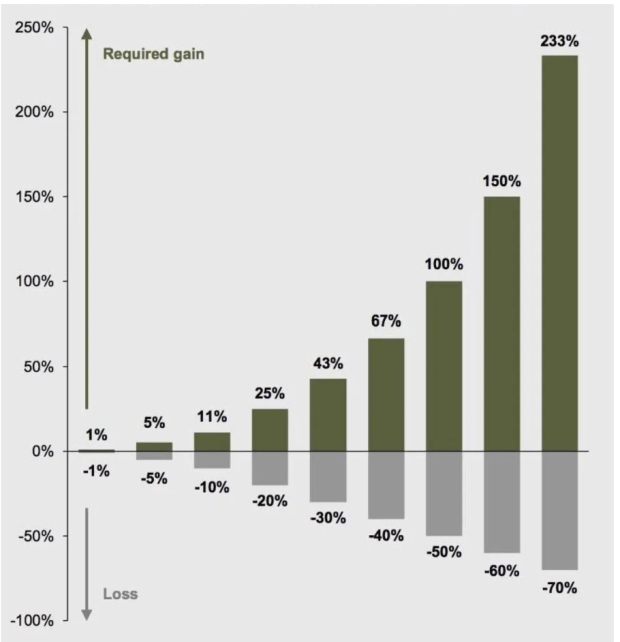
Riding winners and cutting losers is counterintuitive for new investors. These amateurs often try to breakeven on losers and lock in winners far too soon. Instead, they should embrace the simple math behind successful and profitable investing. Remember, a 50% drawdown requires a 100% gain to break even.
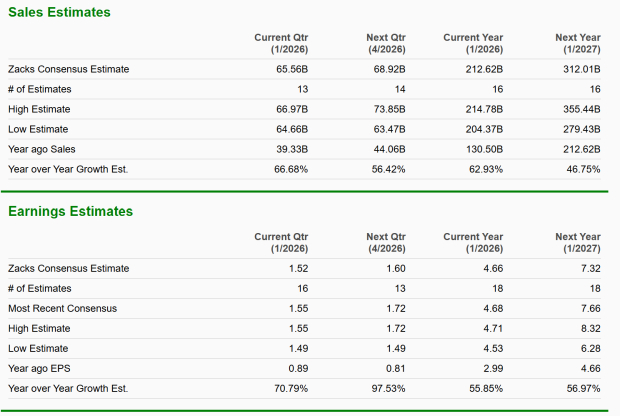
Investors should focus their energy on trafficking only in the best merchandise. Leading stocks should be liquid and strong across industry, technical, and fundamental perspectives. The combination of liquidity and growth is the closest thing to a “holy grail” that exists in investing. Institutional investors, the most deep-pocketed investors, are attracted to these stocks and often accumulate them, pushing their prices higher for multiple years. NVIDIA (NVDA) is a fantastic example of such a stock. NVDA is extremely liquid, is trending upwards, has robust double-digit top-and-bottom growth, and is a member of the hottest industry (AI).
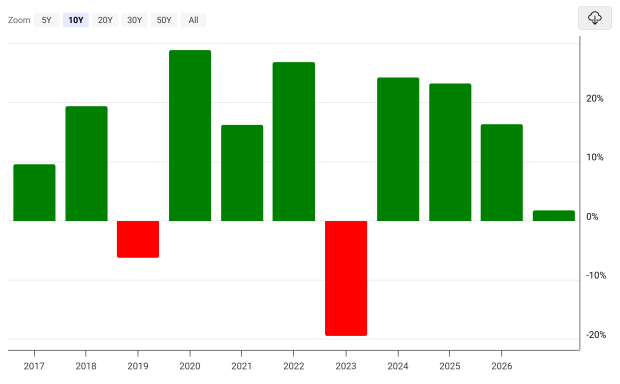
For some reason, fear and the urge to call tops are obsessions among new investors. However, long-term data suggests that investors should lean bullish more often than not. Over the past ten years, the S&P 500 Index has delivered positive annual returns 80% of the time. Meanwhile, the S&P 500 has historically gained 10% annually.
Overall, stocks tend to climb the proverbial Wall of Worry. Investing legend Peter Lynch described it best: “Far more money has been lost by investors preparing for corrections than has been lost in corrections themselves.”
Nevertheless, bear markets are inevitable and can be avoided by using a 200-day moving average. As Paul Tudor Jones once taught:
“My metric for everything I look at is the 200-day moving average of closing prices. I’ve seen too many things go to zero, stocks and commodities. The whole trick in investing is: How do I keep from losing everything? If you use the 200-day moving average rule, then you get out. You play defense, and you get out.”
This simple rule would have kept investors out of the worst parts of the Black Monday Crash of 1987, the COVID Panic of 2020, and the Liberation Day Plunge of 2025.

Relative Strength (RS) is a price-based analysis used by market technicians and traders to evaluate a stock’s price performance versus the performance of a benchmark such as the S&P 500 Index, an industry group, or an underlying commodity. RS is most powerful in bear markets because the strongest stocks stick out like a sore thumb.
I have discovered that often, the best way to understand and simplify investing concepts is through metaphors. Think of a stock as a beach ball and a poor (down) market as someone holding the beach ball underwater. In a down market, a stock that continues to bounce surface or resist the market weakness is worth watching further. Another way to think about RS is to compare a tennis ball to an egg. When an egg hits the ground, it breaks (weak stock), and when a tennis ball hits the ground, it bounces (strong).
Historically, roughly 75% of a stock’s move is correlated with the S&P 500 Index. In other words, most stocks move up in bull markets and fall in bear markets. When a stock refuses to move lower in a down market, it’s sending a big clue. What will happen when the market steadies if you can’t bring the stock down in a bearish market? In an overwhelming majority of instances, the stock that held up best during the market’s downtrend dramatically outperforms.
Oklo’s (OKLO) 2025 advance is a perfect case study. While the major indices and most stocks collapsed below the 200-day in reaction to ‘Liberation Day’, OKLO shares held the moving average – a subtle sign of relative strength. Once the market pressure was relieved, OKLO would advance from $20 to $200!

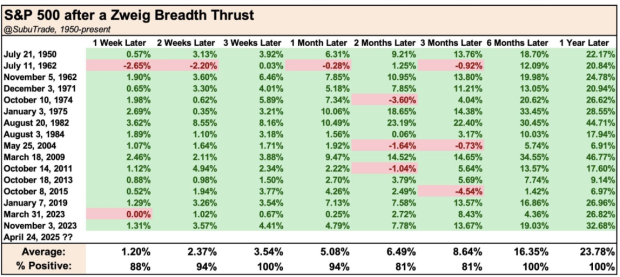
After a brutal bear market, waiting for the price to cross back above the 200-day could mean getting into the bull market late. One of the best ways to identify a return of demand is to look for a Zweig Breadth Thrust. A ZBT occurs when the 10-day exponential moving average (EMA) of NYSE advances/ (NYSE advances + declines) moves from below 0.4 to above 0.615 within 10 trading days or less. Since World War 2, stocks have a perfect one-year post-ZBT track record and have produced outsized returns.
Another solid market indicator is Federal Reserve policy. A dovish Fed (one that cuts interest rates) means more liquidity, and more liquidity means higher prices. As Stanley Druckenmiller teaches:
“Earnings don’t move the overall market; it’s the Federal Reserve Board. Focus on the central banks and focus on the movement of liquidity.”
New investors often fall into the trap of wanting to get rich quickly. Investors must observe and manage their emotions. If you feel like you won or lost the Super Bowl after a trade, chances are you’re trading too much size. That said, if your equity curve is increasing and you’re trading well, you should press (assuming that high probability trades exist). As George Soros teaches:
“It’s not whether you’re right or wrong, but how much money you make when you’re right and how much you lose when you’re wrong.”
By methodically pyramiding in and out of the market, investors can let the market and their performance, not emotions, dictate their trading decisions.

Tom Brady is considered the greatest quarterback of all time. Over Tom Brady’s illustrious career, he appeared in a mind-blowing 10 Super Bowls and won seven of them. Was Brady the most physically talented quarterback? Not even close. What set Tom Brady apart was his relentless study of the playbook and game tape.
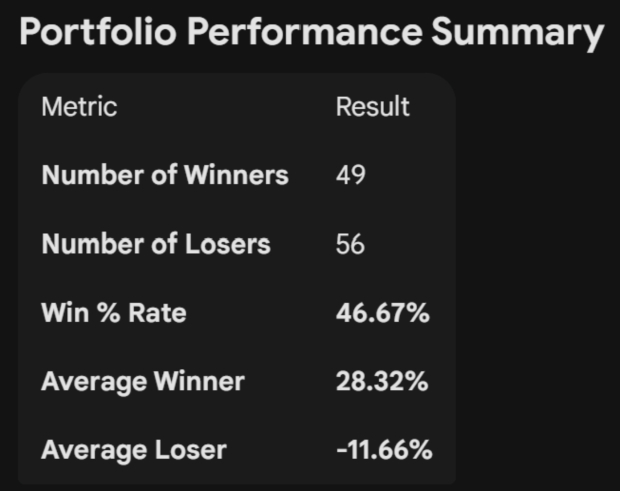
Most investors spend the bulk of their time looking for stocks when they should instead be studying themselves and their own process. With the advent of AI chatbots, studying your performance has never been easier. Simply plug your trades into ChatGPT or Gemini and have the AI produce your win rate, average winner/loser, and profit expectancy.
Chances are that you will learn just as much studying your own process as you do from studying the market.
Bottom Line
The journey to becoming a profitable trader is less about discovering a “holy grail” indicator and more about the relentless discipline of self-study and risk control. By treating your trading like a professional athlete treats their game tape, you move away from the emotional noise of short-term price action and toward a structured, rules-based system.
Want the latest recommendations from Zacks Investment Research? Today, you can download 7 Best Stocks for the Next 30 Days. Click to get this free report
This article originally published on Zacks Investment Research (zacks.com).
| 13 min | |
| 23 min | |
| 28 min | |
| 1 hour | |
| 1 hour | |
| 1 hour | |
| 1 hour | |
| 1 hour | |
| 1 hour | |
| 2 hours | |
| 2 hours | |
| 2 hours | |
| 2 hours | |
| 2 hours | |
| 2 hours |
Join thousands of traders who make more informed decisions with our premium features. Real-time quotes, advanced visualizations, alerts, and much more.
Learn more about Finviz Elite