|
|
|

|
|||||
|
|
|
Nu Skin Enterprises, Inc. NUS posted fourth-quarter 2025 results, with the top and bottom lines missing the Zacks Consensus Estimate. Earnings and net sales declined year over year.
In the fourth quarter, Nu Skin posted adjusted earnings of 29 cents per share. The metric declined from adjusted earnings of 38 cents per share in the year-ago quarter. The bottom line missed the Zacks Consensus Estimate of 30 cents.

Nu Skin Enterprises, Inc. price-consensus-eps-surprise-chart | Nu Skin Enterprises, Inc. Quote
Quarterly revenues of $370.3 million tumbled 16.9% year over year. Revenues included a negative impact of 0.2% from foreign currency fluctuations. On a constant-currency basis, revenues fell 16.7%. Rhyz revenues fell 41.6% year over year to $48.5 million. NUS’s top line missed the Zacks Consensus Estimate of $383 million.
Sales leaders were down 19% year over year to 30,045. Nu Skin’s customer base dropped 10% to 748,796. The company’s paid affiliates were down 11% to 129,311.
Adjusted gross profit of $262 million decreased 17.6% from $317.9 million in the year-ago quarter. The company’s adjusted gross margin came in at 70.7%, down 70 basis points from 71.4% in the year-ago quarter. The adjusted gross margin at the Nu Skin Business was 77.6%, up 100 basis points year over year.
Selling expenses declined 20.6% to $131.3 million from the $165.4 million reported in the prior-year quarter. As a percentage of revenues, the metric was 35.5%, down 160 basis points from 37.1% in the year-ago quarter. Nu Skin business’ selling expenses were 40.8%, up 50 basis points from 40.3% in the prior-year quarter.
General and administrative expenses of $107.4 million declined 11.2% from $120.9 million in the year-ago quarter. As a percentage of revenues, general and administrative expenses were 29%, up 190 basis points from 27.1% in the year-ago period.
Adjusted operating income decreased 32.6% year over year to $23.2 million. The company’s adjusted operating margin decreased 140 basis points to 6.3% from 7.7% in the year-ago quarter.
Region-wise, revenues declined 9.8%, 22.7%, 7.8%, 10.5%, 1.9%, 14.9% and 9% in the Americas, Southeast Asia/Pacific, Mainland China, Japan, Europe and Africa, South Korea and Hong Kong/Taiwan, respectively. Meanwhile, the company’s other revenues surged 167.5% year over year.
This Zacks Rank #3 (Hold) company ended the quarter with cash and cash equivalents of $238.6 million, long-term debt of $204.2 million and total stockholders' equity of $805.2 million. In the reported quarter, the company paid out dividends of $2.9 million and $10 million in share repurchases. The company has $142.3 million remaining under the current share repurchase authorization.
Nu Skin announced a cash dividend of 6 cents per share, payable March 11, 2026, to its shareholders’ record as of Feb. 27.
NUS anticipates revenues of $1.35 billion to $1.50 billion for 2026, which indicates a negative 9% to 1% growth from the year-ago period’s reported figure. The company envisions unfavorable foreign currency impacts of 1% on 2026 revenues.
Earnings per share (EPS) for 2026 are anticipated to be 80 cents to $1.20.
For the first quarter of 2026, revenues are expected to be between $320 million and $340 million, representing a decline of 7-12%, including an approximate 1% negative impact from foreign exchange. EPS for the quarter is projected to be 10 cents to 20 cents.
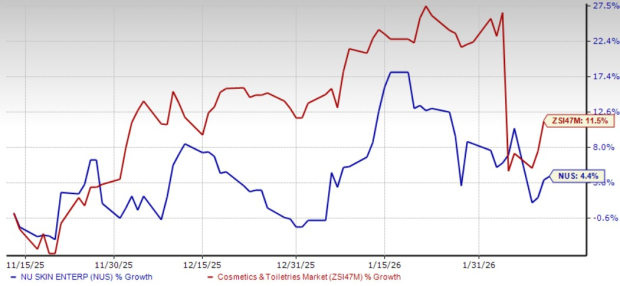
NUS stock has gained 4.4% in the past three months compared with the industry’s growth of 11.5%.
European Wax Center, Inc. EWCZ operates as the franchisor and operator of out-of-home waxing services in the United States. At present, European Wax Center carries a Zacks Rank of 2 (Buy). You can see the complete list of today’s Zacks #1 Rank (Strong Buy) stocks here.
The consensus estimate for European Wax Center’s current fiscal-year earnings implies growth of 46.7% from the year-ago figures. EWCZ delivered a trailing four-quarter earnings surprise of 170.2%, on average.
BJ's Wholesale Club Holdings, Inc. BJ operates membership warehouse clubs in the eastern half of the United States. It presently has a Zacks Rank #2. BJ delivered a trailing four-quarter earnings surprise of 10.3%, on average.
The Zacks Consensus Estimate for BJ's Wholesale’s fiscal-current year sales and earnings indicates growth of 4.3% and 7.7%, respectively, from the prior-year reported level.
Ollie's Bargain Outlet Holdings, Inc. OLLI operates as a retailer of closeout merchandise and excess inventory in the United States. OLLI currently has a Zacks Rank #2. OLLI delivered a trailing four-quarter earnings surprise of 5.2%, on average.
The Zacks Consensus Estimate for Ollie's Bargain’s fiscal 2025 sales and earnings implies growth of 16.7% and 17.7%, respectively, from the previous year’s reported numbers.
Want the latest recommendations from Zacks Investment Research? Today, you can download 7 Best Stocks for the Next 30 Days. Click to get this free report
This article originally published on Zacks Investment Research (zacks.com).
| Jul-10 | |
| Jul-08 | |
| Jul-08 | |
| Jun-04 | |
| Jun-03 | |
| Jun-03 | |
| Jun-03 | |
| Jun-03 | |
| Jun-03 | |
| Jun-03 | |
| Jun-03 | |
| Jun-03 | |
| Jun-01 | |
| May-29 | |
| May-28 |
Join thousands of traders who make more informed decisions with our premium features. Real-time quotes, advanced visualizations, alerts, and much more.
Learn more about Finviz Elite