|
|
|

|
|||||
|
|
|
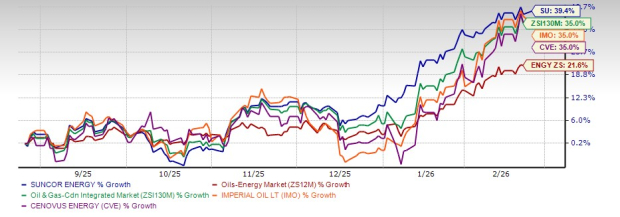
Suncor Energy Inc. SU has posted an impressive performance over the past six months, with its shares rising 39.4%. This gain outperformed the Oil & Gas Drilling sub-industry’s 35% growth and the broader energy sector’s 21.6% gain. When compared with peers like Imperial Oil Limited IMO and Cenovus Energy Inc. CVE — both up 35% during the same period — Suncor’s stronger upward momentum reflects greater investor confidence and more consistent resilience.
Suncor is a leading Canadian integrated energy company with operations spanning oil sands development, offshore and international production, refining and retail marketing. It is one of the world’s largest oil sands owners, with core mining and in-situ assets in northern Alberta, including stakes in Fort Hills and Syncrude. Its Exploration and Production segment includes offshore Canada, the North Sea and select international fields. The Refining and Marketing division operates refineries across Canada and the United States, distributing fuels through Petro-Canada and Sunoco retail networks.
Currently, Suncor has a fundamentally stronger, more resilient business than in prior cycles, with improved cost structure and disciplined capital returns. However, it remains exposed to commodity cycles and capital intensity risks inherent in oil sands operations. With rising performance indicators, it’s worth delving deeper into Suncor’s recent strength and what it means for its near-term outlook.
Record-Breaking Operational Performance Across Segments: Suncor delivered its strongest operational year in company history, achieving record upstream production, refining throughput and product sales. Production increased materially over two years without acquisitions or large capital projects, highlighting genuine organic improvement. Refining utilization exceeded nameplate capacity, and all refineries operated at or above full rates. This consistency across upstream and downstream demonstrates structural performance gains rather than one-off improvements, reinforcing management’s operational credibility.
Structural Cost Improvements and Lower Breakeven: Management reduced WTI breakeven by more than $10 per barrel within two years, transitioning from a historically high-cost producer to a low-cost operator. Capital spending declined while volumes increased, and operating expenses remained stable despite higher production. This signals durable efficiency gains rather than temporary cost deflation. A structurally lower breakeven enhances resilience in volatile commodity cycles and improves free cash flow visibility across pricing environments.
Shareholder-Friendly Capital Allocation: Management has committed to returning at or near 100% of excess funds to shareholders, primarily through dividends and share buybacks. Over the past decade, more than 70% of the average market capitalization has been returned via cumulative cash distributions. The dividend targets steady annual growth, while buybacks provide flexibility. This capital return model enhances per-share metrics and demonstrates confidence in the durability of the company’s asset base. Peer comparison further highlights strength as Suncor provides a robust dividend yield of 3.08%, higher than the peer companies like Imperial Oil (1.71%) and Cenovus Energy (2.54%).
Strong Balance Sheet and Credit Profile: Suncor maintains investment-grade credit ratings and achieved its net debt target of approximately $8 billion. Net debt to AFFO stands at a conservative level, providing financial flexibility in volatile commodity markets. The debt maturity profile is well staggered, reducing refinancing risk. With a focus on maintaining leverage resilience even under lower oil price assumptions, the company is positioned to sustain dividends and operations during cyclical downturns.
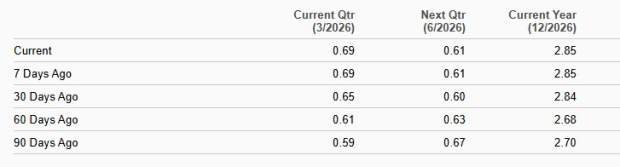
Estimate Revision Trend: For the current quarter of 2026,the Zacks Consensus Estimate for SU’s earnings has been revised 6.2% upward in the past 30 days, indicating a positive trajectory for the company. However, the same has been revised downward for Suncor’s peer companies — Cenovus Energy and Imperial Oil — highlighting its strength over peers.
Estimate Revision
Commodity Price Sensitivity: Despite integration benefits, earnings remain highly sensitive to crude prices, refining margins and foreign exchange rates. Corporate guidance highlights material swings in AFFO with changes in WTI and crack spreads. In lower oil price environments, free funds flow could compress significantly, reducing buybacks and dividend growth potential. The company’s profitability remains fundamentally tied to global macroeconomic and geopolitical conditions beyond management control. Additionally, heavy crude pricing differentials, such as WCS versus WTI, can pressure realized pricing.
Heavy Oil Sands Exposure and Carbon Intensity: A significant portion of Suncor’s production comes from oil sands mining and upgrading, which are carbon-intensive compared to conventional crude. Increasing environmental regulations, carbon pricing mechanisms and ESG-driven capital constraints could raise operating costs or limit expansion opportunities. Long-life reserves may become a strategic disadvantage if global decarbonization accelerates and long-term oil demand weakens, potentially leading to stranded asset risk.
Limited Near-Term Production Growth Visibility: Management highlighted organic growth from optimization rather than new large-scale projects. While this reflects efficiency, it also suggests limited step-change production growth unless new developments are sanctioned. Future growth appears incremental rather than transformative, which could constrain valuation multiple expansion.
Capital Intensity of Oil Sands Operations: Oil sands mining and upgrading remain capital-intensive and operationally complex. Sustaining high utilization requires ongoing maintenance, pit sequencing and infrastructure management. While efficiency has improved, these assets inherently require significant long-term investment, limiting flexibility compared to lighter, shorter-cycle shale producers.
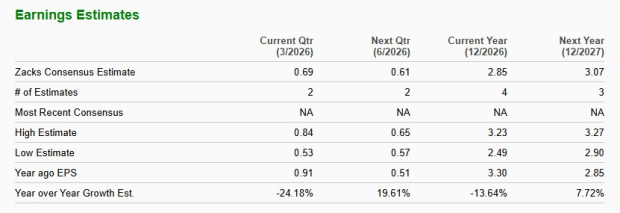
2026 Earnings Estimates: The Zacks Consensus Estimate implies a 13.6% year-over-year decline in SU’s 2026 earnings per share, signaling a shift to negative earnings growth. This anticipated decline contrasts with the optimism embedded in the stock’s current price. In other words, investors are paying up for Suncor at a point when fundamentals are expected to cool rather than accelerate. The Zacks Consensus Estimate for 2026 earnings per share of peer companies — Cenovus Energy and Imperial Oil — also implies a negative year-over-year earnings growth of 22.1% and 14.8%, respectively.
SU’s Earnings Estimate
This Zacks Rank #3 (Hold) company has strengthened its operational foundation with record production, structurally lower breakeven costs, disciplined capital returns and a solid investment-grade balance sheet. Organic efficiencies and steady shareholder payouts enhance resilience across cycles. However, earnings remain highly sensitive to crude prices and heavy oil differentials, while oil sands’ carbon intensity, capital intensity and limited near-term production growth visibility pose structural risks. With consensus estimates signaling softer earnings ahead, upside appears balanced by macro and regulatory headwinds.
In this context, investors should consider adopting a hold strategy for now to monitor Suncor’s operational performance, carbon-intensive operations and capital return policy while avoiding a premature exit before these initiatives potentially translate into shareholder value.
You can see the complete list of today’s Zacks #1 Rank (Strong Buy) stocks here.
Want the latest recommendations from Zacks Investment Research? Today, you can download 7 Best Stocks for the Next 30 Days. Click to get this free report
This article originally published on Zacks Investment Research (zacks.com).
| Jul-14 | |
| Jun-26 | |
| Jun-05 | |
| Jun-05 | |
| May-28 | |
| May-06 | |
| May-06 | |
| May-05 | |
| May-05 | |
| May-05 | |
| May-05 | |
| May-05 | |
| May-04 | |
| May-02 | |
| May-01 |
Join thousands of traders who make more informed decisions with our premium features. Real-time quotes, advanced visualizations, alerts, and much more.
Learn more about Finviz Elite