|
|
|

|
|||||
|
|
|

Online fashion resale marketplace ThredUp (NASDAQ:TDUP) reported revenue ahead of Wall Street’s expectations in Q4 CY2025, with sales up 18.5% year on year to $79.7 million. The company expects next quarter’s revenue to be around $80 million, close to analysts’ estimates. Its GAAP loss of $0.04 per share was in line with analysts’ consensus estimates.
Is now the time to buy ThredUp? Find out by accessing our full research report, it’s free.
“For the full year 2025, our performance was a testament to the scalability of our infrastructure and the fundamental strength of our marketplace model,” said ThredUp CEO and co-founder James Reinhart.
Founded to revolutionize thrifting, ThredUp (NASDAQ:TDUP) is a leading online fashion resale marketplace offering a wide selection of gently-used clothing and accessories.
A company’s long-term sales performance can indicate its overall quality. Even a bad business can shine for one or two quarters, but a top-tier one grows for years. Over the last five years, ThredUp grew its sales at a weak 7.6% compounded annual growth rate. This fell short of our benchmark for the consumer discretionary sector and is a poor baseline for our analysis.
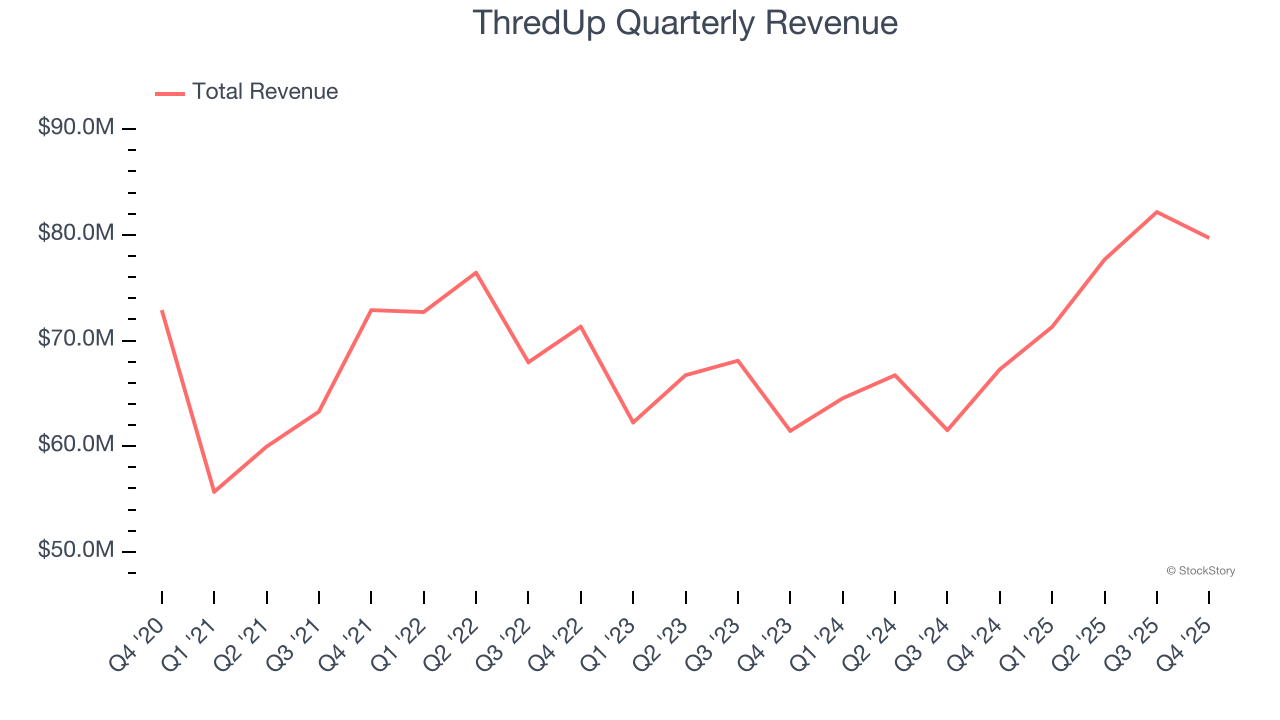
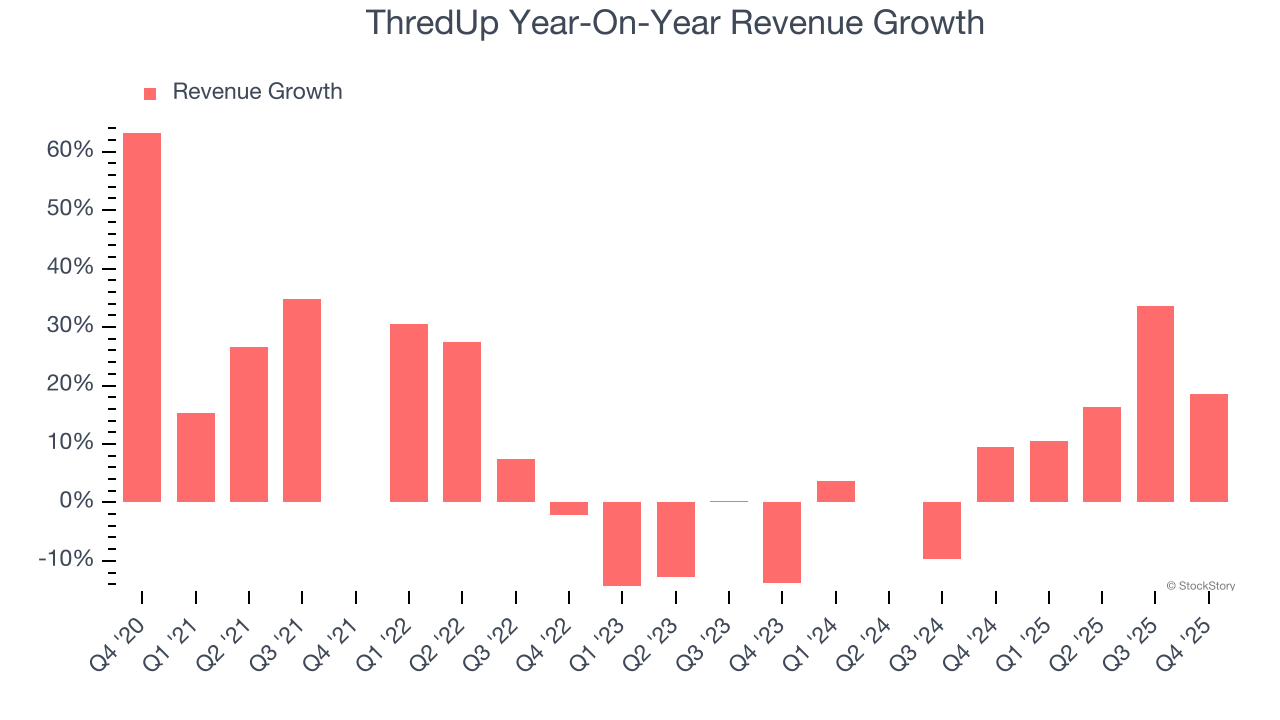
Long-term growth is the most important, but within consumer discretionary, product cycles are short and revenue can be hit-driven due to rapidly changing trends and consumer preferences. ThredUp’s annualized revenue growth of 9.7% over the last two years is above its five-year trend, which is encouraging.
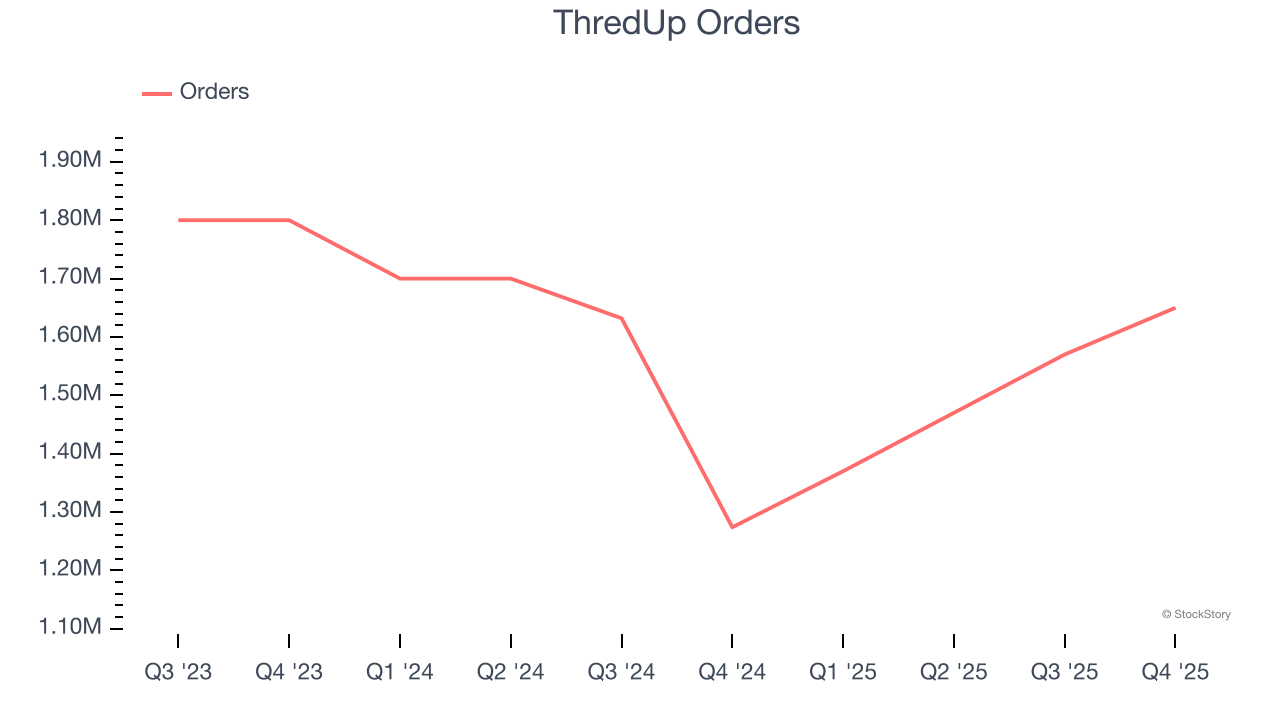
We can dig further into the company’s revenue dynamics by analyzing its number of orders, which reached 1.65 million in the latest quarter. Over the last two years, ThredUp’s orders averaged 7.6% year-on-year declines. Because this number is lower than its revenue growth during the same period, we can see the company’s monetization has risen.
This quarter, ThredUp reported year-on-year revenue growth of 18.5%, and its $79.7 million of revenue exceeded Wall Street’s estimates by 3.3%. Company management is currently guiding for a 12.2% year-on-year increase in sales next quarter.
Looking further ahead, sell-side analysts expect revenue to grow 11% over the next 12 months, similar to its two-year rate. Although this projection suggests its newer products and services will fuel better top-line performance, it is still below average for the sector.
ALSO WORTH WATCHING: Nvidia’s Quiet Partner. Nvidia’s chips cost a hundred grand. The connectors that make them work cost even more. One company makes them all.
Every AI server needs specialized infrastructure the chip companies don’t make. High-speed cables. Power connectors. Thermal sensors. This 90-year-old company built a monopoly on it. The AI boom just started. This stock is still flying under the radar. Claim The Stock Ticker Here for FREE.
Operating margin is an important measure of profitability as it shows the portion of revenue left after accounting for all core expenses – everything from the cost of goods sold to advertising and wages. It’s also useful for comparing profitability across companies with different levels of debt and tax rates because it excludes interest and taxes.
ThredUp’s operating margin has been trending up over the last 12 months, but it still averaged negative 10.9% over the last two years. This is due to its large expense base and inefficient cost structure.
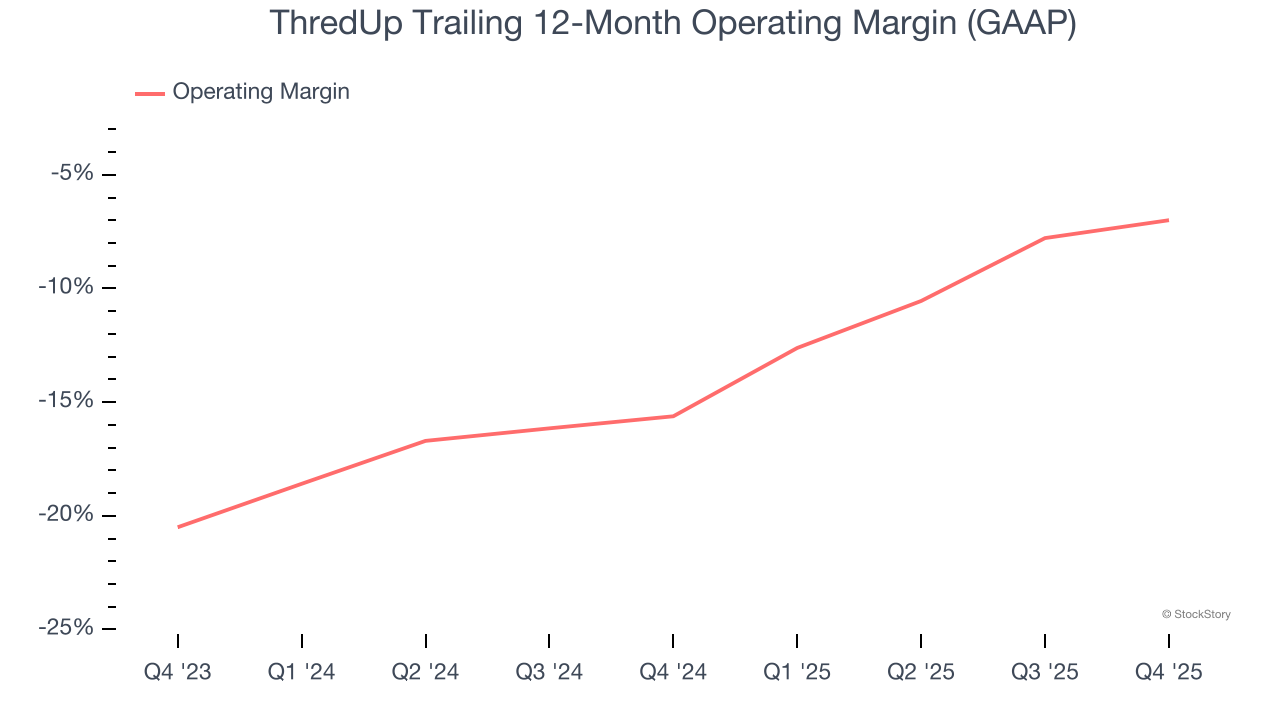
ThredUp’s operating margin was negative 8.4% this quarter. The company's consistent lack of profits raise a flag.
Revenue trends explain a company’s historical growth, but the long-term change in earnings per share (EPS) points to the profitability of that growth – for example, a company could inflate its sales through excessive spending on advertising and promotions.
Although ThredUp’s full-year earnings are still negative, it reduced its losses and improved its EPS by 47.9% annually over the last five years. The next few quarters will be critical for assessing its long-term profitability.
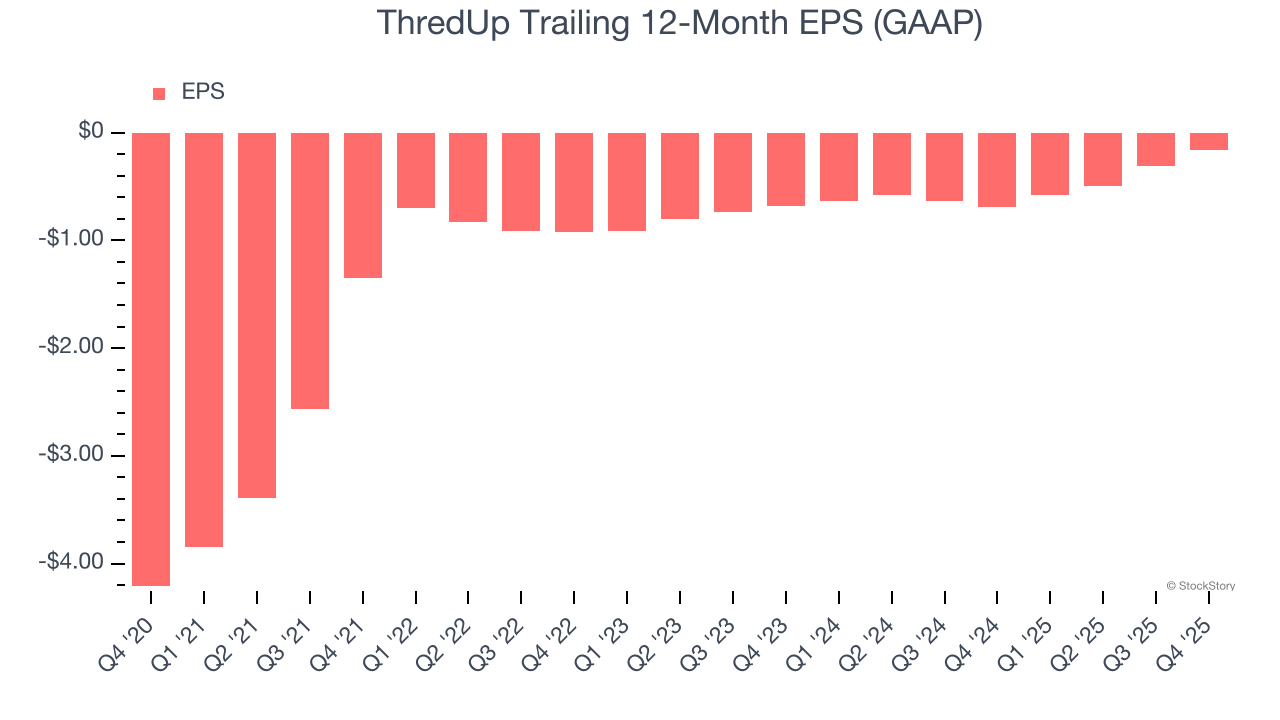
In Q4, ThredUp reported EPS of negative $0.04, up from negative $0.19 in the same quarter last year. This print was close to analysts’ estimates. Over the next 12 months, Wall Street expects ThredUp to improve its earnings losses. Analysts forecast its full-year EPS of negative $0.16 will advance to negative $0.09.
We were impressed by how significantly ThredUp blew past analysts’ EBITDA expectations this quarter. We were also glad its full-year revenue guidance exceeded Wall Street’s estimates. Overall, we think this was still a solid quarter with some key areas of upside. Investors were likely hoping for more, and shares traded down 1.2% to $4.95 immediately after reporting.
Should you buy the stock or not? What happened in the latest quarter matters, but not as much as longer-term business quality and valuation, when deciding whether to invest in this stock. We cover that in our actionable full research report which you can read here (it’s free).
| Jul-08 | |
| Jun-09 | |
| Jun-09 | |
| Jun-01 | |
| May-26 | |
| May-22 | |
| May-21 | |
| May-20 | |
| May-15 | |
| May-08 | |
| May-06 | |
| May-04 | |
| May-04 | |
| Apr-06 | |
| Apr-06 |
Join thousands of traders who make more informed decisions with our premium features. Real-time quotes, advanced visualizations, alerts, and much more.
Learn more about Finviz Elite