|
|
|

|
|||||
|
|
|
Best Buy Co., Inc. BBY reported fourth-quarter fiscal 2026 results, wherein revenues lagged the Zacks Consensus Estimate and earnings surpassed the same. Also, the top line declined and the bottom line rose year over year.
In the fourth quarter, Best Buy navigated a dynamic and highly promotional holiday environment while continuing to advance its strategic priorities. Consumer demand patterns during the holiday season were uneven, with softer sales early in the quarter followed by stronger momentum later in the period. The company responded by adjusting its marketing, promotional cadence and labor deployment in real time to remain competitive and aligned with customer expectations.
From a category standpoint, computing and mobile phones remained key areas of focus, supported by replacement cycles, carrier partnerships and ongoing innovation. Growth was also seen in emerging and lifestyle-oriented technology segments, such as AI-enabled devices, gaming accessories and other newer categories. These gains were partially offset by continued softness in more discretionary big-ticket areas like home theater and appliances, reflecting cautious consumer spending behaviors.

Best Buy Co., Inc. price-consensus-eps-surprise-chart | Best Buy Co., Inc. Quote
Beyond core retail performance, the company continued to scale newer profit streams, particularly its digital Marketplace and retail media network initiatives. Both Marketplace and advertising offerings gained traction in the quarter, expanding vendor participation and customer adoption. Operationally, the company emphasized efficiency improvements across fulfillment, customer care and supply-chain functions, while also leveraging technology to enhance personalization and delivery speed.
Customer experience remained central to the company’s strategy. Improvements were noted across key satisfaction metrics, including store experience, product availability and fulfillment speed for online orders. Investments in vendor partnerships, in-store merchandising enhancements and employee engagement supported these outcomes. Reflecting investor response to the company’s quarterly update and forward outlook, BBY shares gained 7.1% yesterday, signaling positive market sentiment around its execution and strategic direction.
Adjusted earnings of $2.61 per share surpassed the Zacks Consensus Estimate of $2.48. Also, the bottom line increased 1.2% from $2.58 per share in the year-ago period.
Enterprise revenues came in at $13,814 million, lagging the consensus mark of $13,907 million and declined 1% from the prior-year quarter's $13,948 million. Enterprise comparable sales declined 0.8% year over year. By month, the enterprise comparable sales declined approximately 3% in November, improved to 0.2% growth in December and increased 0.4% in January.
Gross profit edged down 1.2% to $2.88 billion, while the gross margin remained flat year over year at 20.9%.
Adjusted SG&A expenses were $2.19 million, down 1.8% year over year. Adjusted SG&A, as a percentage of revenues, was down 20 bps to 15.8%.
Adjusted operating income was $695 million, up 0.7% from the year-ago quarter. The adjusted operating margin of 5% rose 10 bps from the prior-year period.
Domestic revenues totaled $12.58 billion, which lagged the Zacks consensus estimate of $12.62 billion and represented a 1.1% year-over-year decline, driven by a 0.8% decrease in comparable sales. From a merchandising standpoint, the most significant weighted contributors to the comparable sales decline were home theater and appliances. These declines were partially offset by growth in computing and mobile phones. Domestic online revenues were $4.91 billion, reflecting a 2.3% decrease on a comparable basis. Online sales accounted for 39% of the total Domestic revenues compared with 39.5% in the prior year.
The domestic gross margin was 20.9%, approximately flat year over year. Growth in Best Buy Ads and Marketplace contributed positively to the gross margin but was largely offset by lower product margin rates. Domestic adjusted SG&A expenses were $2.00 billion, or 15.9% of revenues compared with $2.03 billion, or 16% of revenues, last year. The decrease in adjusted SG&A was driven by lower compensation expenses, including incentive pay, as well as reduced Best Buy Health expenses. These reductions were partially offset by higher costs associated with the company’s Marketplace and Best Buy Ads initiatives.
International revenues totaled $1.24 billion, which met the consensus estimate and increased 0.5% year over year. The rise was primarily driven by favorable foreign exchange rates, partially offset by a 1.3% decline in comparable sales.
The International gross margin was 20.5%, down 90 basis points year over year. The decline was mainly attributable to lower product margin rates. The segment’s adjusted SG&A expenses were $189 million, or 15.3% of revenues, compared with $194 million, or 15.7% of revenues, in the prior year. The reduction in adjusted SG&A was primarily due to lower compensation expenses, including incentive compensation, partially offset by the unfavorable impacts of foreign exchange rates.
Best Buy ended the quarter with cash and cash equivalents of $1.74 billion, long-term debt of $1.17 billion, and a total equity of $2.96 million.
In the quarter under review, the company returned $272 million to shareholders, consisting of $199 million in dividends and $73 million in share repurchases.
For fiscal 2026, total shareholder returns amounted to $1.07 billion, including $801 million paid out in dividends and $273 million used for share buybacks. For fiscal 2027, the company expects to allocate $300 million toward share repurchases.
Moreover, the board of directors approved a 1% increase in the regular quarterly cash dividend, raising it to 96 cents per common share. The dividend will be paid out on Apr. 14, 2026, to shareholders of record as of the close of business on March 24, 2026.
For fiscal 2027, the company expects revenues from $41.2 billion to $42.1 billion. Comparable sales are projected to fluctuate between a 1% decline and 1% growth. The company expects its gross margin to improve 30 basis points from that reported in the prior year, driven by growth in Best Buy Ads and its U.S. Marketplace platform.
Turning to adjusted SG&A, expenses are projected to increase to support the continued expansion of Ads and Marketplace initiatives, including higher spending on advertising, technology and employee compensation. Incentive compensation is also expected to rise as performance targets are reset for the upcoming year, with the high end of the company’s guidance indicating an increase of $30 million from that reported in fiscal 2026.
Store payroll expenses are anticipated to rise at the high end of the revenue outlook, with minimal impact on the overall rate. These increases are expected to be partially offset by lower expenses within Best Buy Health. The low end of the company’s guidance assumes further reductions in variable expenses, including incentive compensation, to better align costs with sales trends.
The adjusted operating margin is anticipated between 4.3% and 4.4%. Adjusted earnings per share are forecast to be $6.30 to $6.60. Capital expenditure for the year is estimated at $750 million.
For the first quarter, the company expects comparable sales to increase 1%, along with an adjusted operating margin of 3.9%.
BBY Stock Past 3-Month Performance
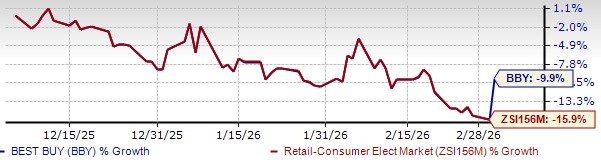
Over the past three months, this Zacks Rank #3 (Hold) company has tumbled 9.9% compared with the industry’s 15.9% decline.
We have highlighted three better-ranked stocks, namely, Deckers Outdoor Corporation DECK, Zumiez Inc. ZUMZ and Boot Barn Holdings, Inc. BOOT.
Deckers is a leading designer, producer and brand manager of innovative, niche footwear and accessories. It flaunts a Zacks Rank #1 (Strong Buy) at present. You can see the complete list of today’s Zacks #1 Rank stocks here.
The Zacks Consensus Estimate for Deckers’ current fiscal-year earnings and sales indicates growth of 8.5% and 8.9%, respectively, from the year-ago actuals. DECK delivered a trailing four-quarter average earnings surprise of 36.9%.
Zumiez is one of the leading global lifestyle retailers. It currently sports a Zacks Rank of 1.
The Zacks Consensus Estimate for Zumiez’s current fiscal-year earnings and sales implies an upsurge of 955.6% and growth of 4.4%, respectively, from the year-ago actuals. ZUMZ delivered a trailing four-quarter average earnings surprise of 28%.
Boot Barn operates as a lifestyle retail chain devoted to western and work-related footwear, apparel and accessories. It currently has a Zacks Rank of 2 (Buy).
The Zacks Consensus Estimate for Boot Barn’s fiscal 2026 earnings and sales implies growth of 26% and 17.6%, respectively, from the year-ago actuals. BOOT delivered a trailing four-quarter average earnings surprise of 4.9%.
Want the latest recommendations from Zacks Investment Research? Today, you can download 7 Best Stocks for the Next 30 Days. Click to get this free report
This article originally published on Zacks Investment Research (zacks.com).
| Jul-16 | |
| Jul-16 | |
| Jul-15 | |
| Jul-15 | |
| Jul-15 | |
| Jul-13 | |
| Jul-13 | |
| Jul-13 | |
| Jul-13 | |
| Jul-13 | |
| Jul-10 | |
| Jul-06 | |
| Jul-03 | |
| Jun-30 | |
| Jun-29 |
Join thousands of traders who make more informed decisions with our premium features. Real-time quotes, advanced visualizations, alerts, and much more.
Learn more about Finviz Elite