|
|
|

|
|||||
|
|
|
ThredUp Inc. TDUP reported fourth-quarter 2025 results, wherein both the top and bottom lines increased year over year. The company’s earnings came in line with the Zacks Consensus Estimate and revenues topped the same.
TDUP delivered a quarterly loss of 4 cents per share, which came in line with the Zacks Consensus Estimate. The quarterly loss per share improved 42.9% year over year compared with the loss of 7 cents per share a year ago.

ThredUp Inc. price-consensus-eps-surprise-chart | ThredUp Inc. Quote
Quarterly revenues came in at $79.7 million, up 18.5% year over year from $67.3 million, and beat the Zacks Consensus Estimate of $79.6 million.
The company ended the quarter with a record 1.65 million active buyers, which is up 29.5% year over year. The figure topped the Zacks Consensus Estimate of 1.5 million, highlighting stronger-than-expected customer engagement.
Fourth-quarter order momentum remained strong, with 1.56 million orders, up 27.3% year over year. This performance also surpassed the Zacks Consensus Estimate of 1.36 million, reflecting robust demand and continued growth in customer engagement.
TDUP’s adjusted gross profit increased 17.3% to $63.4 million from $54.1 million in the prior year. Results exceeded expectations, supported by higher average selling prices driven by growth in the premium supply offering. However, the adjusted gross margin declined by 80 basis points to 79.6% from 80.4%.
Adjusted SG&A expenses totaled $15 million, increasing 8.5% year over year compared to $13.8 million in the same period last year.
Loss from continuing operations improved by 30.8% in the fourth quarter to $5.6 million, compared to $8.1 million in the same quarter of the prior year.
Adjusted EBITDA from continuing operations was $2.9 million, down 42% year over year from $5.0 million in the prior-year quarter. Adjusted EBITDA from continuing operations reached 3.7% of revenues, down 370 basis points from 7.4% of revenues in the prior-year quarter.
The company ended the year with $53.1 million in cash and securities. 2025 marked a significant milestone, as TDUP generated its first full year of annual free cash flow. This achievement underscores improving financial discipline and operating performance.
During the year, the company invested $10.5 million in capital expenditures, balancing growth investments while still generating positive free cash flow.
Management indicated that the first quarter is expected to be the smallest period of the year in terms of both revenues and EBITDA, reflecting a typical post-holiday slowdown and the ramp-up of supply processing and marketing investments early in the year. Revenues are anticipated to peak in the second and third quarters, followed by a seasonal moderation in the fourth quarter.
ThredUp expects first-quarter 2026 revenues between $79.5 million and $80.5 million, representing 12% year-over-year growth at the midpoint. Gross margin is projected between 78.0% and 79.0%, with an adjusted EBITDA margin of approximately 3.0%.
For the full year 2026, the company anticipates revenues ranging from $349.0 million to $355.0 million, reflecting 13% year-over-year growth at the midpoint. Gross margin is expected to remain between 78.0% and 79.0%, with an adjusted EBITDA margin of about 6.0%. Capex for 2026 is expected to remain at a level similar to 2025.
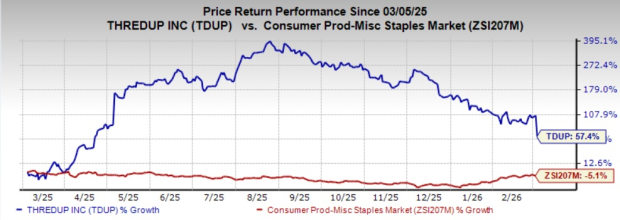
TDUP currently carries a Zacks Rank #3 (Hold). The stock has gained 57.4% in the past year against the industry’s decline of 5.1%.
Some better-ranked stocks have been discussed below:
BJ’s Wholesale Club Holdings, Inc. BJ has emerged as one of the preferred destinations for shoppers when it comes to essentials and other items. BJ currently carries a Zacks Rank #2 (Buy). You can see the complete list of today’s Zacks #1 Rank (Strong Buy) stocks here.
The Zacks Consensus Estimate for BJ's current fiscal-year sales and earnings implies growth of 4.3% and 7.9% from the year-ago reported figures. BJ delivered a trailing four-quarter earnings surprise of 10.3%, on average.
Ollie's Bargain Outlet Holdings, Inc. OLLI operates as a retailer of closeout merchandise and excess inventory in the United States. OLLI currently carries a Zacks Rank #2.
The Zacks Consensus Estimate for OLLI's current fiscal-year sales and earnings implies growth of 16.8% and 17.7%, respectively, from the year-ago actuals. OLLI delivered a trailing four-quarter earnings surprise of 5.2%, on average.
Kenvue Inc. KVUE operates as a consumer health company in the United States, the rest of North America, Europe, the Middle East, Africa, the Asia-Pacific and Latin America. KVUE currently carries a Zacks Rank #2.
The Zacks Consensus Estimate for KVUE's current fiscal-year sales and earnings implies growth of 2.9% and 0.9%, respectively, from the year-ago actuals. KVUE delivered a trailing four-quarter negative earnings surprise of 9.8%, on average.
Want the latest recommendations from Zacks Investment Research? Today, you can download 7 Best Stocks for the Next 30 Days. Click to get this free report
This article originally published on Zacks Investment Research (zacks.com).
| Jul-29 | |
| Jul-24 | |
| Jul-23 | |
| Jul-23 | |
| Jul-20 | |
| Jul-16 | |
| Jul-13 | |
| Jul-13 | |
| Jul-10 | |
| Jul-08 | |
| Jul-08 | |
| Jul-08 | |
| Jun-17 | |
| Jun-09 | |
| Jun-09 |
Join thousands of traders who make more informed decisions with our premium features. Real-time quotes, advanced visualizations, alerts, and much more.
Learn more about Finviz Elite