|
|
|

|
|||||
|
|
|

Medical device company CooperCompanies (NASDAQ:COO) met Wall Street’s revenue expectations in Q4 CY2025, with sales up 6.2% year on year to $1.02 billion. The company’s outlook for the full year was close to analysts’ estimates with revenue guided to $4.33 billion at the midpoint. Its non-GAAP profit of $1.10 per share was 6.9% above analysts’ consensus estimates.
Is now the time to buy CooperCompanies? Find out by accessing our full research report, it’s free.
"We're pleased to report a strong start to the fiscal year, highlighted by product launches, outstanding profitability, and robust cash flow, all of which gives us the confidence to raise both earnings and free cash flow guidance. Revenue growth benefited from continued strength in our premium MyDay portfolio, and momentum is building from product launches including early traction from MyDay MiSight. Operating margins exceeded expectations, reflecting disciplined execution and the meaningful synergies delivered through last year's reorganization. These improvements are strengthening our foundation--enhancing efficiency, improving our cost structure, and enabling more targeted investment in our highest-return opportunities," said Al White, CooperCompanies' President and CEO.
With a history dating back to 1958 and a portfolio spanning two distinct healthcare segments, Cooper Companies (NASDAQ:COO) develops and manufactures medical devices focused on vision care through contact lenses and women's health including fertility products and services.
Examining a company’s long-term performance can provide clues about its quality. Even a bad business can shine for one or two quarters, but a top-tier one grows for years. Thankfully, CooperCompanies’s 11% annualized revenue growth over the last five years was decent. Its growth was slightly above the average healthcare company and shows its offerings resonate with customers.
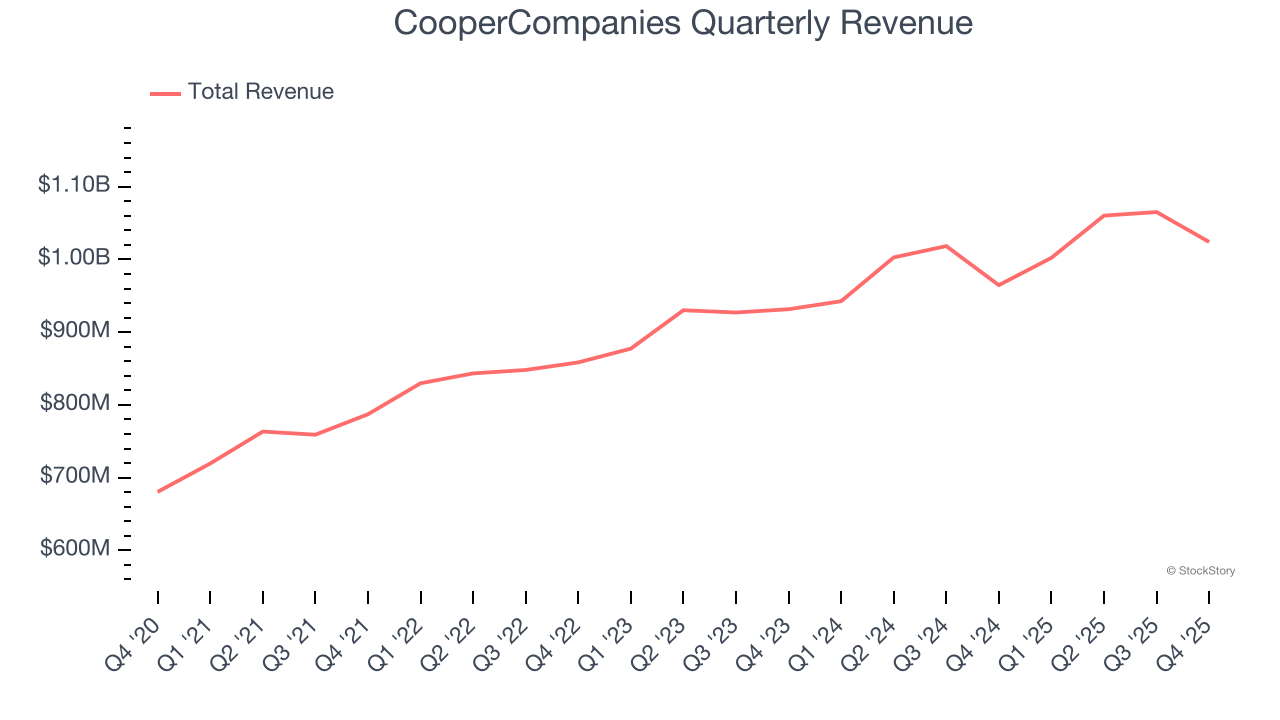
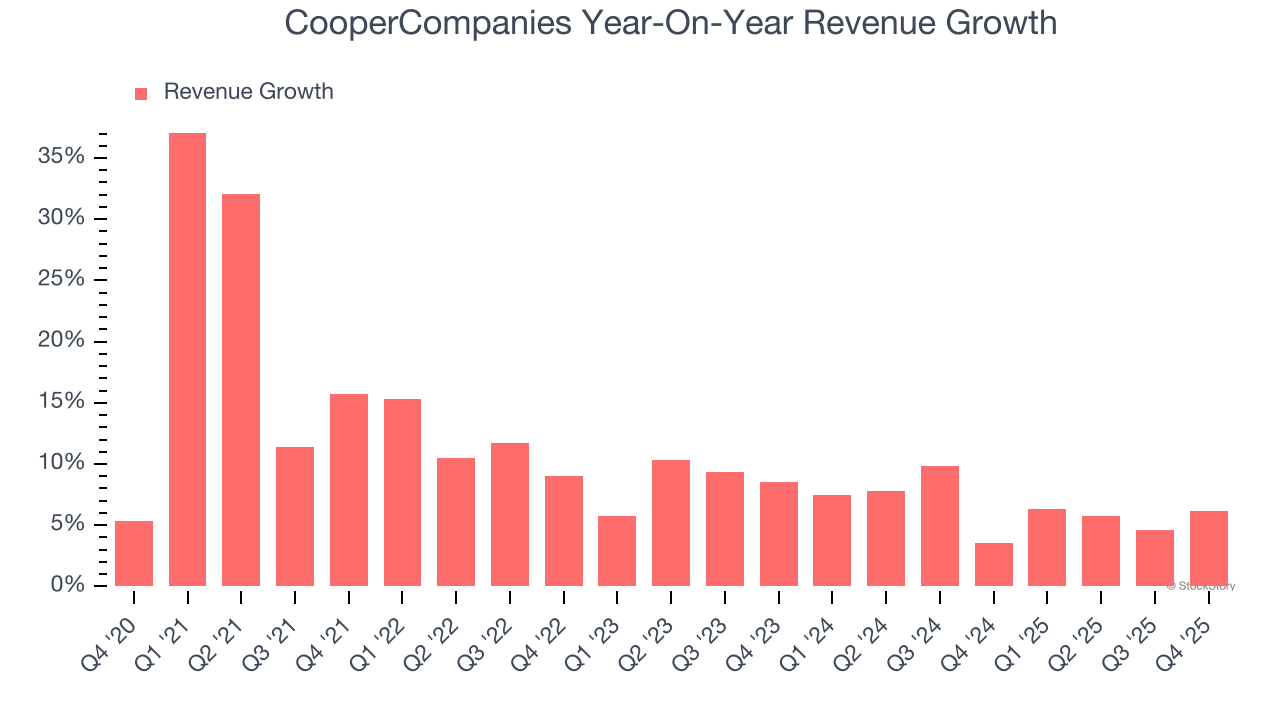
Long-term growth is the most important, but within healthcare, a half-decade historical view may miss new innovations or demand cycles. CooperCompanies’s recent performance shows its demand has slowed as its annualized revenue growth of 6.4% over the last two years was below its five-year trend. We’re wary when companies in the sector see decelerations in revenue growth, as it could signal changing consumer tastes aided by low switching costs.
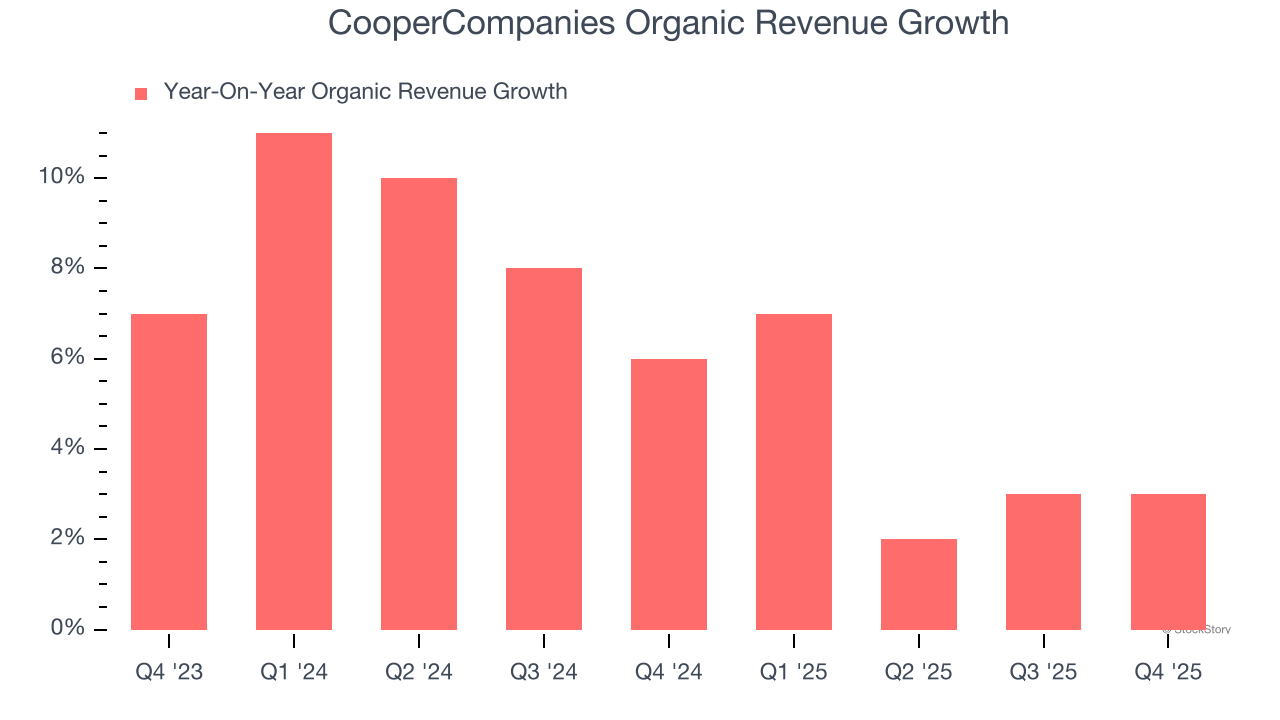
We can better understand the company’s sales dynamics by analyzing its organic revenue, which strips out one-time events like acquisitions and currency fluctuations that don’t accurately reflect its fundamentals. Over the last two years, CooperCompanies’s organic revenue averaged 6.3% year-on-year growth. Because this number aligns with its two-year revenue growth, we can see the company’s core operations (not acquisitions and divestitures) drove most of its results.
This quarter, CooperCompanies grew its revenue by 6.2% year on year, and its $1.02 billion of revenue was in line with Wall Street’s estimates.
Looking ahead, sell-side analysts expect revenue to grow 5.3% over the next 12 months, similar to its two-year rate. Still, this projection is above average for the sector and implies the market is forecasting some success for its newer products and services.
ONE MORE THING: The $21 AI Application Stock Wall Street Forgot. While Wall Street obsesses over who’s building AI, one company is already using it to print money. And nobody’s paying attention.
AI chip stocks trade at ridiculous valuations. This company processes a trillion consumer signals monthly using AI and trades at a third of the price. The gap won’t last. The institutions will figure it out. You need to see this first. Read the FREE Report Before They Notice.
Operating margin is one of the best measures of profitability because it tells us how much money a company takes home after subtracting all core expenses, like marketing and R&D.
CooperCompanies’s operating margin has generally stayed the same over the last 12 months, averaging 16.6% over the last five years. This profitability was solid for a healthcare business and shows it’s an efficient company that manages its expenses well.
Analyzing the trend in its profitability, CooperCompanies’s operating margin of 17.2% for the trailing 12 months may be around the same as five years ago, but it has increased by 2.6 percentage points over the last two years.
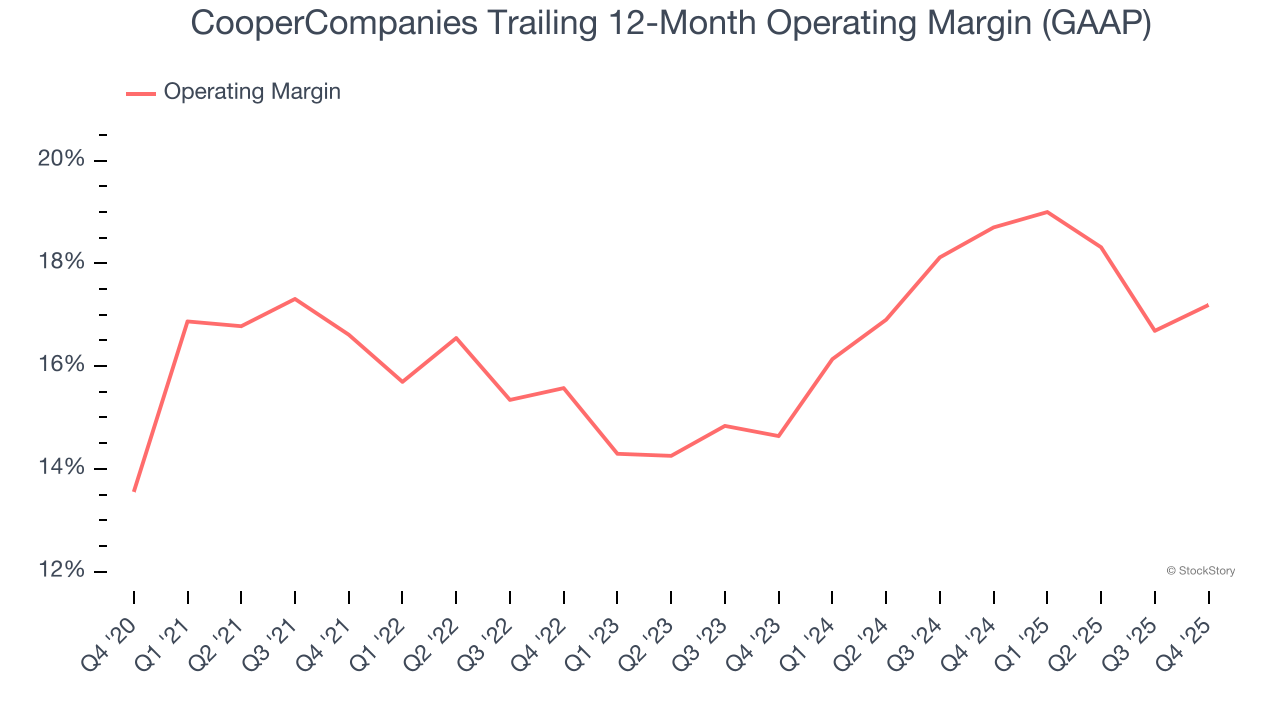
In Q4, CooperCompanies generated an operating margin profit margin of 20.8%, up 1.9 percentage points year on year. This increase was a welcome development and shows it was more efficient.
Revenue trends explain a company’s historical growth, but the long-term change in earnings per share (EPS) points to the profitability of that growth – for example, a company could inflate its sales through excessive spending on advertising and promotions.
CooperCompanies’s remarkable 11.2% annual EPS growth over the last five years aligns with its revenue performance. This tells us its incremental sales were profitable.
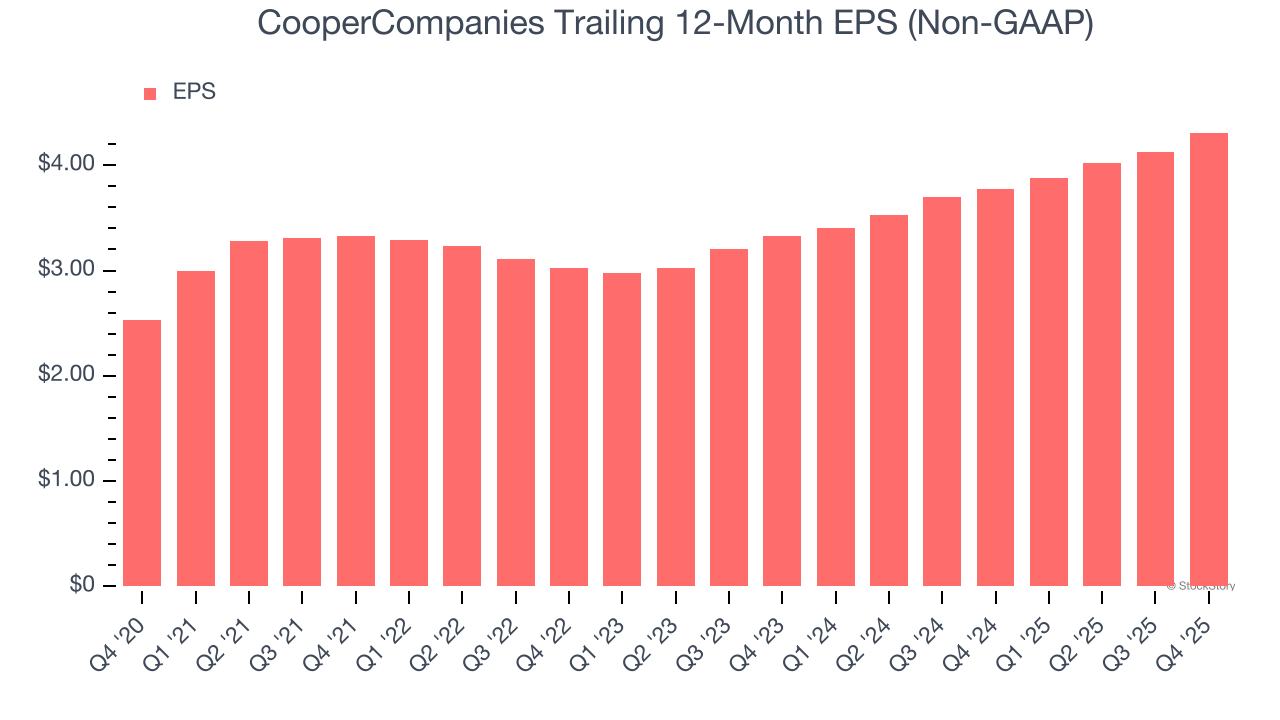
In Q4, CooperCompanies reported adjusted EPS of $1.10, up from $0.92 in the same quarter last year. This print beat analysts’ estimates by 6.9%. Over the next 12 months, Wall Street expects CooperCompanies’s full-year EPS of $4.31 to grow 6.8%.
We enjoyed seeing CooperCompanies beat analysts’ full-year EPS guidance expectations this quarter. We were also glad its EPS outperformed Wall Street’s estimates. On the other hand, its organic revenue was in line. Overall, this print had some key positives. The stock traded up 3.4% to $82.95 immediately after reporting.
Big picture, is CooperCompanies a buy here and now? The latest quarter does matter, but not nearly as much as longer-term fundamentals and valuation, when deciding if the stock is a buy. We cover that in our actionable full research report which you can read here (it’s free).
| Jun-30 | |
| Jun-05 | |
| Jun-05 | |
| Jun-04 | |
| May-29 | |
| May-13 | |
| May-04 | |
| Apr-30 | |
| Apr-09 | |
| Mar-17 | |
| Mar-13 | |
| Mar-09 | |
| Mar-09 | |
| Mar-09 | |
| Mar-07 |
Join thousands of traders who make more informed decisions with our premium features. Real-time quotes, advanced visualizations, alerts, and much more.
Learn more about Finviz Elite