Why Sentiment Favors Bulls Despite Slowing SPX Momentum
“July is one of the most bullish months of the year. In fact, based on last year’s update, July became the most bullish month on average. For readers who may not remember, or who may be new here, July has been positive 80% of the time over the last 20 years, with an average gain of 2.67%. Over the last 10 years, it has been positive 100% of the time, with an average gain of 3.51%...From a breadth standpoint, this market is actually broadening despite the major indexes chopping around to a slightly negative monthly return so far…the S&P 500 advance-decline line chart, breadth has broken out to fresh all-time high”
- Monday Morning Outlook, June 29, 2026
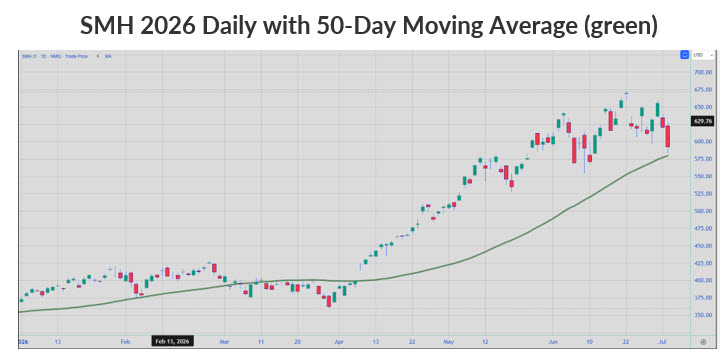
We are only two trading days into the month of July, which, as Matt observed last week, has historically bullish seasonality characteristics. If one is invested heavily in the leading semiconductor space, July did not get off to a “hot” start despite sweltering temperatures in many parts of the country.
News that Meta Platforms (META – 582.90) was going to sell excess AI capacity was alarming to some,sparking a sell-off in semiconductors, which lost 10% in the first two days of the month, as measured by the VanEck Semiconductor ETF (SMH – 592.29). News that famed investor Michael Burry is bearish semiconductors on worries of over-capacity didn’t help.
For what it is worth, the SMH comes into this week just above its rising 50-day moving average, which provided support in early February and acted as resistance in March. In April, a bullish crossover of this moving average preceded strong gains into last month’s all-time high. If there is a concern, the SMH failed to close above the round $600 level after bouncing from its 50-day moving average on Thursday.
Despite steep losses in the leadership space late last week, the broader S&P 500 Index (SPX – 7,483.24) fared much better and was essentially flat during the SMH’s slide. The broadening out in the rally as rotation continues to be a theme helped support the market. From a contrarian perspective, I find it interesting that we are more apt to hear warnings about narrowing breadth than what might be perceived as a green light when the rally expands to more stocks.
“It is anyone’s guess where sellers may finally begin to overwhelm buyers. A potential resistance area could be in the 7,500-7,530 area. The 7,500 mark is a clean round number and 7,530 is exactly 10% above last year’s close. As such, anyone anchoring to the SPX’s year-to-date gain may look to slightly reduce risk”
- Monday Morning Outlook, May 11, 2026
Momentum from the late-March low has clearly slowed. In fact, in early May I speculated that the 7,500 and 7,530 area could be a hesitation level as optimism among option buyers was hitting an extreme.
As the chart below shows, the 7,500–7,530 area was significant last week on both an intraday and closing basis. There were also signs in mid-May that this zone would matter, when the SPX briefly pulled back from this level to around 7,340. Since the index first approached 7,530 in mid-May, it has largely traded within a two-month range.
Even when the SPX briefly moved above 7,530, note how the high was at 7,613, which is another key round percentage level (20% above the late-March low). Investors tend to anchor to end-of-year closes or key lows (or highs). When doing so, profit-takers may emerge at round-number percentages relative to the anchored level, creating a pivot point or hesitation area.
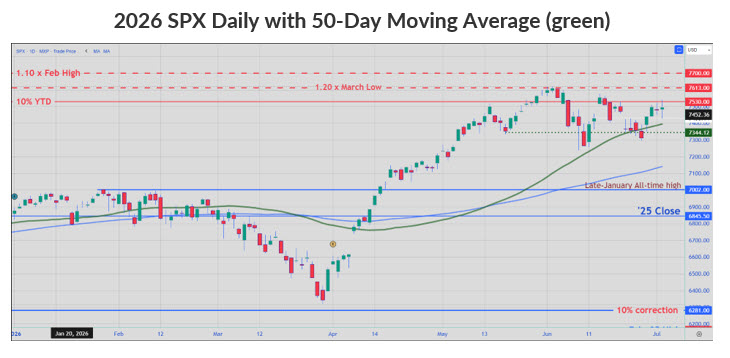
In the short term we are focusing on potential resistance overhead, ranging from 7,500 to last month's closing high of 7,620. But the market is far from broken, with the first levels of support ranging between 7,400 (its rising 50-day moving average) and 7,270, last month’s low.
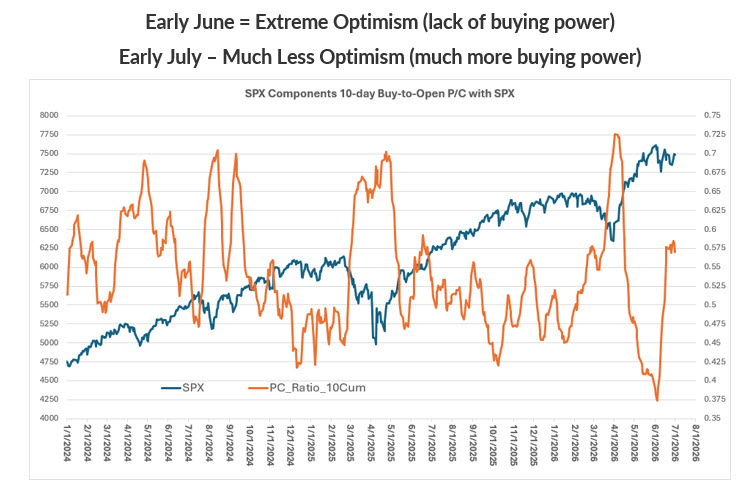
As the range has unfolded, sentiment among equity option-buyers is nowhere near the extreme optimism we were observing as the SPX was about to enter the current range. The translation is that, to the extent equity option activity represents either a lack of buying power (extreme optimism) or buying power, the ratio of put buying to call buying over the past two weeks suggests considerably more buying power to push the SPX through resistance than existed two months ago.
In other words, the sentiment and technical backdrop favor the bulls, even as the SPX has lost the impressive momentum that we saw in April and the first half of May.
Todd Salamone is Schaeffer's Senior V.P. of Research.
Continue reading:
- Indicator of the Week: Data Shows Why This Software ETF is Poised to Rally.
- The Week Ahead: June FOMC Meeting Minutes on Deck
- The Contrarian Edge: Celebrating 2026's Top Stock Picks
Mentioned In This Article
Latest News
| Oct-17 | |
| Oct-17 | |
| Oct-16 | |
| Oct-16 | |
| Oct-16 | |
| Oct-16 | |
| Oct-16 | |
| Oct-16 | |
| Oct-16 |
Dow Jones Futures: S&P 500, Nasdaq Break Key Levels As CoreWeave, Dell Dive; Tesla, SpaceX, Meta Loom
META
Investor's Business Daily
|
| Oct-16 | |
| Oct-16 | |
| Oct-16 | |
| Oct-16 | |
| Oct-16 |
Netflix, Tesla Headline Busy Earnings Calendar; Spending Plans Key To Meta's Report
META
Investor's Business Daily
|
| Oct-16 |
