Small Caps Take the Crown for First Half of 2026
The first half of 2026 was a good one for stocks, especially for the Russell 2000 Index (RUT). The small-cap benchmark gained more than 20% for its best first-half return since 1991. Since 1980, it gained over 20% in the first half just four other times. The large-cap S&P 500 Index (SPX) was no slouch as it posted a return of 9.6% through the end of June.
This week, I’ll look at what these strong first-half gains have meant historically for the market over the next quarter and rest of the year. I’ll also analyze historically the best and worst performing individual stocks from the first half to see which ones would have been better to invest in for the second half of the year.
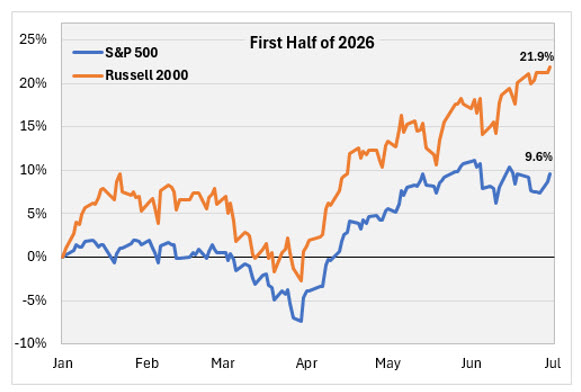
A Closer Look at Index Returns
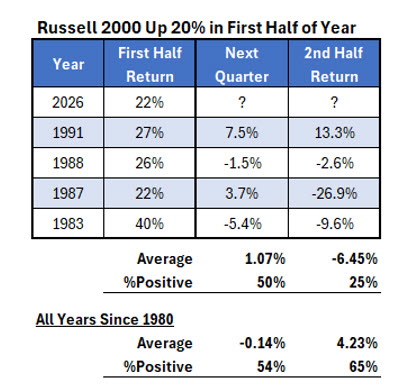
The table below shows the five times that the RUT gained at least 20% in the first half of a year. The last time was 1991 and the index continued its strong performance gaining 7.5% in the third quarter of that year and over 13% for the second half. The other three years, however, weren’t so great. The index was down all three times in the second half, including a 26.9% loss in 1987.
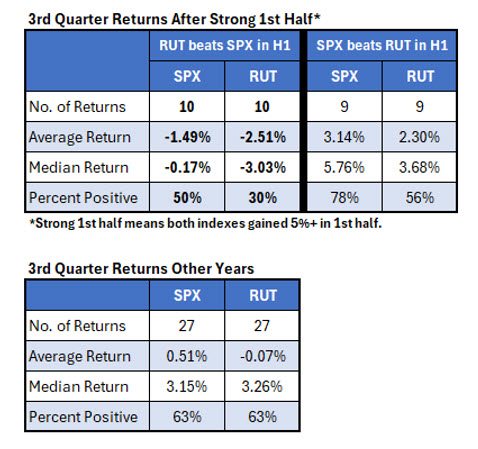
This next table summarizes third-quarter returns in years when both the SPX and RUT gained at least 5% during the first-half of the year. The third quarter performance differed dramatically depending on which index led. In years when the RUT beat the SPX in the first half, the environment we’re in now, third-quarter returns were weak. The SPX lost 1.5% on average with positive returns half the time. The RUT performed worse, averaging a loss of 2.5% and just three of 10 positive. By contrast, when the SPX beat the RUT in the first half, both indexes tended to have strong third quarters.
On the bright side, the weakness of the third quarter given our current situation has been short-lived. When you look at the returns in the whole second half of the year, the SPX has outperformed compared to other years. It averaged a return of 6.45% and positive 70% of the time. The RUT has tended to underperform it’s typical send half return but the average return of 3.3% indicates a strong fourth quarter given the weak third quarter we saw above.
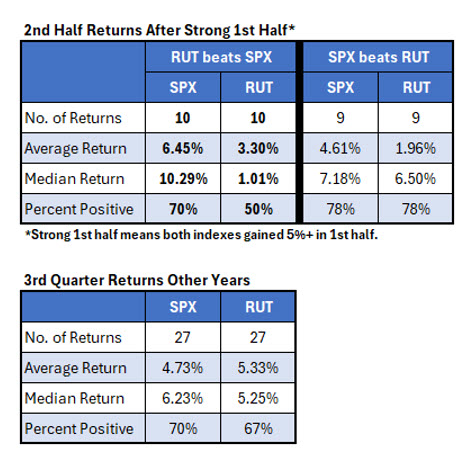
In conclusion, in strong years in which the RUT has beaten the SPX, we have 10 data points showing stocks tended to underperform in the third quarter. However, the weak quarter presented a buying opportunity as the second half of those years produced solid returns.
Best vs. Worst First Half Stocks
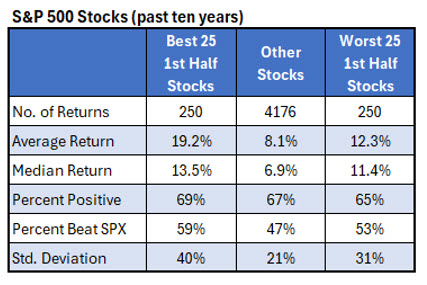
In this section, I’m determining whether it’s historically been better to buy the year’s biggest winners, betting that momentum will continue, or the biggest losers, expecting a rebound in the second half of the year. Using current S&P 500 stocks and looking back 10 years, the table below summarizes the second half returns for the 25 best performing stocks from the first half of each year, the 25 worst performing stocks, and the remaining stocks.
Investors were generally better off buying either the biggest winners or the biggest losers than the stocks in between. The best performers gained an average of about 19% during the second half of the year, while the 25 worst performers returned about 12% on average. The remaining stocks averaged a gain of 8%.
The momentum stocks were also the most likely to beat the SPX in the second half of the year. The best first half performers beat the index 59% of the time, compared with 53% of the time for the worst stocks, and 47% for the rest. While both the biggest winners and biggest losers in the first half produced stronger returns on average, they also had significantly more volatility than the other stocks.
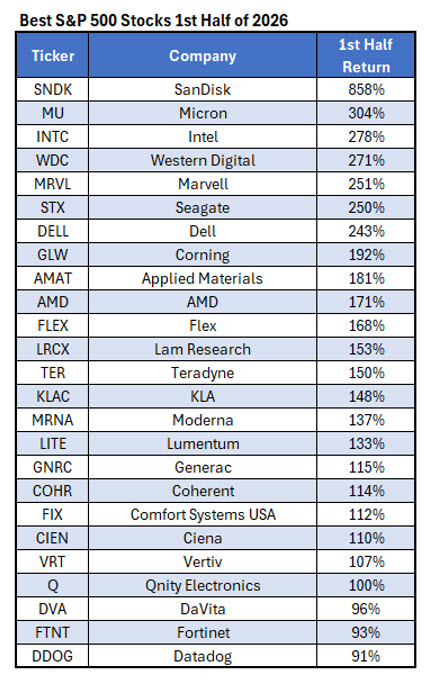
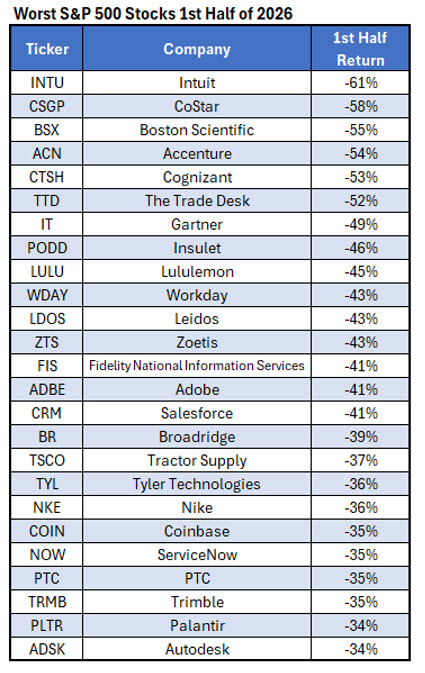
These last two tables show the best 25 S&P 500 stocks through the first half of 2026 and the worst 25 stocks. Based on the data above, stocks from these two tables tend to outperform the other 450 (or thereabouts) stocks of the index.
Mentioned In This Article
Latest News
| 56 min | |
| 1 hour | |
| 2 hours | |
| 2 hours | |
| Oct-22 | |
| Oct-22 | |
| Oct-22 | |
| Oct-22 | |
| Oct-22 | |
| Oct-22 | |
| Oct-22 | |
| Oct-22 | |
| Oct-22 | |
| Oct-22 | |
| Oct-22 |
