SoFi Reports Second Quarter 2026 with Record Net Revenue of $1.2 Billion, Record Member and Product Growth, Net Income of $157 Million
Adjusted Net Revenue up 40% to a record $1.2 billion
Adjusted EBITDA up 44% to a record $358 million
Total Loan Originations at a record $14.8 billion
Member growth up 35% to a record 15.8 million members
Product growth up 42% to a record 24.4 million products
Cross-buy accelerated, with 51% of new products opened by existing SoFi members
Increases 2026 Adjusted Net Revenue Guidance to $4.75 billion to $4.85 billion
SAN FRANCISCO--(BUSINESS WIRE)--SoFi Technologies, Inc. (NASDAQ: SOFI), a member-centric, everything app for digital financial services that helps members borrow, save, spend, invest and protect their money, reported financial results today for its second quarter ended June 30, 2026.
“2026 is shaping up to be a defining year, and our second quarter results mark a clear inflection point for SoFi,” said Anthony Noto, CEO of SoFi. “Despite continued market uncertainty, our business model continues to prove its durability. We grew members 35% year-over-year and added a record 2.2 million products, a 42% increase. For the first time, we added twice as many products as members, a major milestone that underscores the trust members place in SoFi and the power of our 'everything app'. Products like SoFi Plus and SoFi Coach are deepening member relationships and increasing lifetime value, while continued innovation across our consumer and enterprise platforms is expanding the value we deliver to members and clients.”
Consolidated Results Summary
|
|
Three Months Ended
|
| % Change |
|
Six Months Ended
|
| % Change | ||||||||||
($ in thousands, except per share amounts) |
| 2026 |
| 2025 |
|
| 2026 |
| 2025 |
| ||||||||
Consolidated – GAAP |
|
|
|
|
|
|
|
|
|
|
|
| ||||||
Total net revenue |
| $ | 1,218,676 |
| $ | 854,944 |
| 43 | % |
| $ | 2,319,044 |
| $ | 1,626,703 |
| 43 | % |
Net income |
|
| 156,592 |
|
| 97,263 |
| 61 | % |
|
| 323,323 |
|
| 168,379 |
| 92 | % |
Net income attributable to common stockholders – diluted |
|
| 156,645 |
|
| 97,614 |
| 60 | % |
|
| 323,720 |
|
| 169,069 |
| 91 | % |
Earnings per share attributable to common stockholders – diluted |
| $ | 0.12 |
| $ | 0.08 |
| 50 | % |
| $ | 0.24 |
| $ | 0.14 |
| 71 | % |
Consolidated – Non-GAAP(1) |
|
|
|
|
|
|
|
|
|
|
|
| ||||||
Adjusted net revenue |
| $ | 1,205,550 |
| $ | 858,230 |
| 40 | % |
| $ | 2,292,782 |
| $ | 1,628,950 |
| 41 | % |
Adjusted EBITDA |
|
| 357,821 |
|
| 249,083 |
| 44 | % |
|
| 697,722 |
|
| 459,420 |
| 52 | % |
Adjusted net income |
|
| 160,406 |
|
| 97,263 |
| 65 | % |
|
| 327,137 |
|
| 168,379 |
| 94 | % |
Adjusted net income attributable to common stockholders – diluted |
|
| 160,459 |
|
| 97,614 |
| 64 | % |
|
| 327,534 |
|
| 169,069 |
| 94 | % |
Adjusted earnings per share – diluted |
| $ | 0.12 |
| $ | 0.08 |
| 50 | % |
| $ | 0.24 |
| $ | 0.15 |
| 60 | % |
| ____________________ | ||
(1) | For more information and reconciliations of these non-GAAP measures to the most comparable GAAP measures, see “Non-GAAP Financial Measures” and Table 2 to the “Financial Tables” herein. | |
Product Highlights
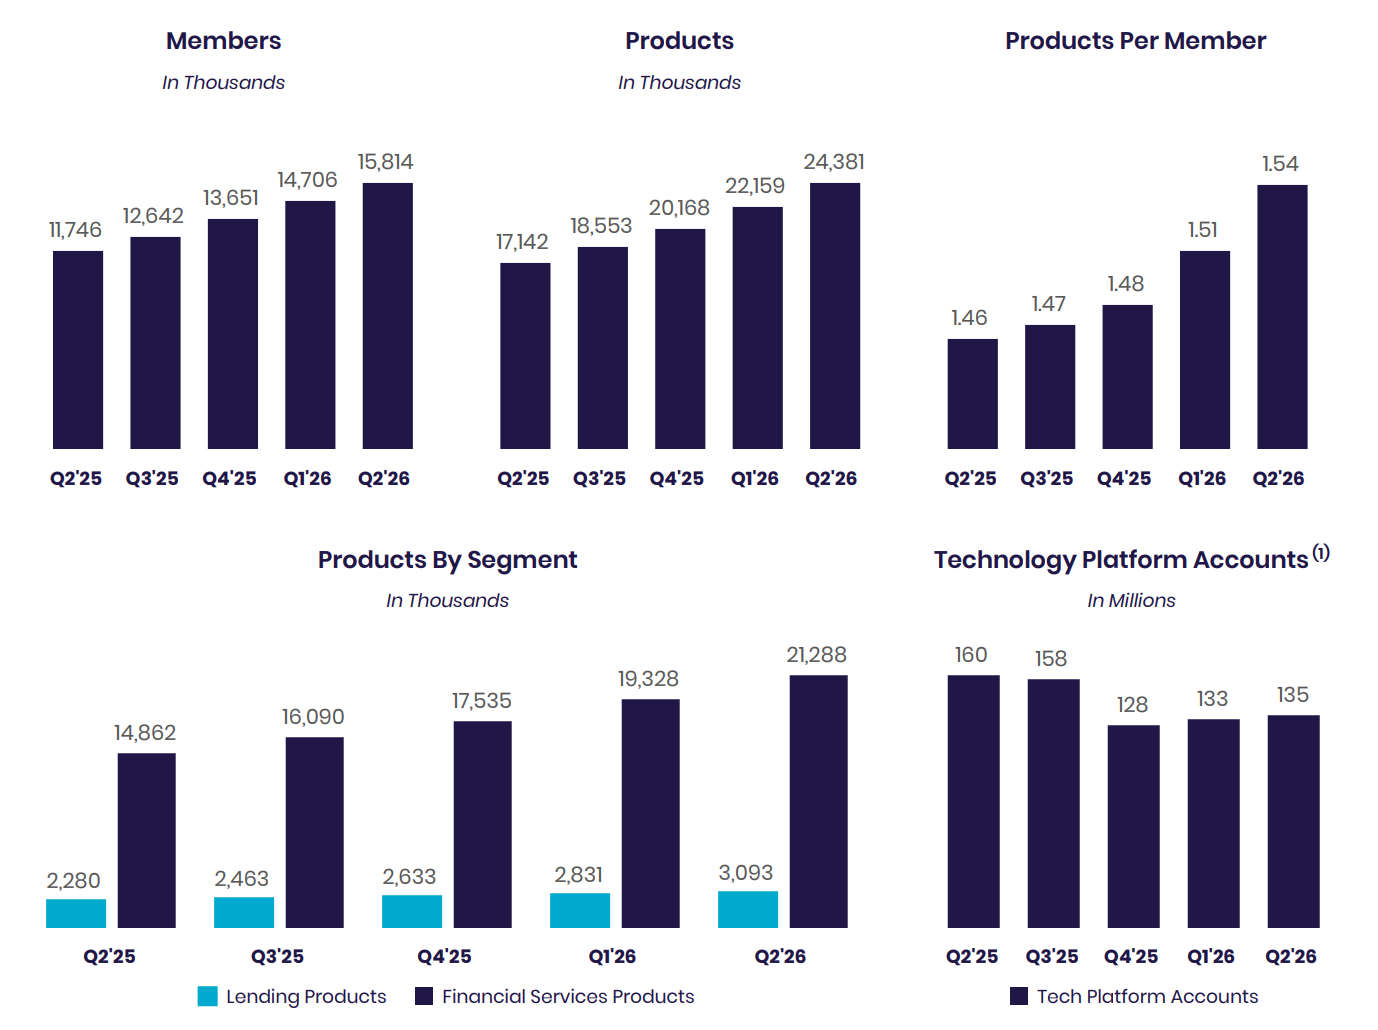
- Driving Record Member and Product Growth. SoFi grew members 35% year-over-year to 15.8 million and products 42% year-over-year to 24.4 million. The company added 1.1 million new members during the quarter, bringing total members to 15.8 million, and added a record 2.2 million new products, marking the first time SoFi added twice as many products as members in a single quarter, and reflecting the increasing engagement of existing members. Products per member reached an all-time high of 1.54.
- Accelerating Cross-Buy and Demonstrating the Financial Services Productivity Loop. Cross-buy continued to accelerate, with 51% of new products opened by existing SoFi members, up from 43% last quarter and 35% in Q2 2025. Along with record product additions, the company saw a clear inflection point in products per member, driven by SoFi Plus and the increased awareness of the breadth of SoFi's product offering. These results demonstrate the increasing effectiveness of SoFi's Financial Services Productivity Loop in driving member engagement and product adoption.
- Delivering Durable Growth and Strong Returns at Scale. SoFi delivered adjusted net revenue of $1.2 billion, up 40% year-over-year, and adjusted EBITDA of $357.8 million, up 44% year-over-year, with a 30% adjusted EBITDA margin. The quarter marked SoFi’s 19th consecutive quarter achieving the Rule of 40, with a score of 70.
- Deepening Member Relationships Through SoFi Plus and SoFi Coach. SoFi surpassed 200,000 paid SoFi Plus subscribers after relaunching the premium membership offering with enhanced benefits and transitioning it to a paid subscription model. Among existing members who signed up for SoFi Plus, 25% added another product after adding SoFi Plus. SoFi Coach became the first GenAI Smart Financial Guide launched by a financial institution and has already generated nearly half-a-million conversations with over 90% positive feedback. Together, these products are strengthening member engagement, increasing lifetime value and demonstrating the Financial Services Productivity Loop in action.
- Achieving Record Loan Originations While Maintaining Strong Credit Performance. SoFi delivered its best quarter ever for total loan originations at $14.8 billion, up more than $2.6 billion from the prior quarter, including record originations across Personal Loans, Student Loans and Home Loans. Personal Loan originations totaled $10.7 billion which included Loan Platform Business originations of $3.1 billion reflecting strong demand from Loan Platform Business partners. This diversification supports SoFi's ability to deliver a combination of highly visible net interest income and capital-light fee-based revenue. Credit performance remained strong and in line with expectations, supporting strong risk-adjusted margins.
- Expanding Innovation Across Enterprise and Consumer Financial Services. During the quarter, SoFi expanded its platform across investing, lending and enterprise financial services. Consumer innovation included the launch of Composer by SoFi, an AI-powered investing platform, Small Business Loans (“SMB”), and a redesigned Home Equity Line of Credit experience. On the enterprise side, Big Business Banking began processing transactions on the SoFi Exchange Network, enabling commercial clients to move money in real time, 24/7 through SoFiUSD, while the acquisition of Peach Finance further strengthened SoFi Tech Solutions' lending capabilities.
- Strengthening Brand Awareness and Trust. SoFi’s unaided brand awareness rose to an all-time high of 10.4%, up 190 basis points year-over-year. During the quarter, SoFi continued to build brand momentum through major cultural and sports moments, including CMA Fest presented by SoFi, FIFA World Cup matches at SoFi Stadium and a multi-year partnership with Notre Dame Athletics, making SoFi the first brand to appear on Fighting Irish jerseys.
Consolidated Results
SoFi reported a number of record financial achievements. For the second quarter of 2026, record GAAP net revenue of $1.2 billion increased 43% relative to the prior-year period's $854.9 million. Record adjusted net revenue of $1.2 billion grew 40% from the corresponding prior-year period of $858.2 million.
For the second quarter of 2026, total fee-based revenue reached $472.3 million, representing 39% of total revenue in the quarter and increasing 22% from prior quarter. This was driven by strong contributions from origination fees, SoFi Tech Solutions revenue, strong performance from our Loan Platform Business, interchange revenue, and brokerage fee revenue. Together, the Financial Services and Technology Platform segments generated $550.8 million of net revenue, an increase of 17% from the prior year period.
Net interest income of $788.2 million for the second quarter was up 52% year-over-year. This was driven by a 49% increase in average interest-earning assets and a 36 basis point decrease in cost of funds, partially offset by a 32 basis point decrease in average asset yields year-over-year. For the second quarter, net interest margin of 5.98% increased 4 basis points from the prior quarter.
During the quarter, average total deposits comprised over 90% of average total liabilities. The average rate paid on deposits in the second quarter was 156 basis points lower than that paid on warehouse facilities, which translates to approximately $712.6 million of annualized interest expense savings due to the successful remixing of our funding base.
Second quarter record adjusted EBITDA of $357.8 million increased 44% from the prior year period's $249.1 million. This represents an adjusted EBITDA margin of 30%.
For the second quarter of 2026, GAAP net income reached $156.6 million and diluted earnings per share reached $0.12.
Equity grew by $264.6 million during the quarter to $11.1 billion and $8.58 of book value per share. Tangible book value grew by $225.8 million during the quarter, ending the period at $9.5 billion. Tangible book value per share was $7.34 at quarter-end, up from $4.72 per share in the prior year period, and up 56% year-over-year.
Member and Product Growth
Continued growth in both total members and products in the second quarter is the result of our continued investments in innovation and brand building and reflects the benefits of our broad product suite and unique Financial Services Productivity Loop (FSPL) strategy.
SoFi added a record 1.1 million members in the second quarter of 2026, bringing total members to 15.8 million, up 35% from 11.7 million at the end of the same prior year period.
SoFi also achieved record product additions of 2.2 million in the second quarter of 2026, bringing total products to nearly 24.4 million, up 42% from 17.1 million at the end of the same prior year period.
Financial Services products increased by 43% year-over-year to 21.3 million, primarily driven by continued demand for our SoFi Money, Relay and Invest products, and drove 89% of our total product growth. Financial Services products account for 87% of total products.
Lending products increased by 36% year-over-year to 3.1 million, driven by continued demand for personal, student, and home loan products.
Technology Platform-enabled accounts decreased 16% year-over-year to 135 million, including the impact from a large client which fully transitioned off the platform prior to December 31, 2025. Technology Platform-enabled accounts increased 2 million from the prior quarter.
Financial Services Segment Results
For the second quarter of 2026, Financial Services segment net revenue of $466.3 million increased 29% from the prior year period. Noninterest income of $217.2 million increased 28% year-over-year. Net interest income of $249.1 million increased 29% year-over-year, primarily driven by growth in consumer deposits.
In the second quarter, SoFi's Loan Platform Business added $143.3 million to our consolidated adjusted net revenue. Of this, $140.9 million was driven by $3.1 billion of personal loans originated on behalf of third parties as well as referrals to third parties. During the second quarter, SoFi expanded its Loan Platform Business offering to include SMB Loans while also reaching an agreement with a new partner to invest in personal loans. Subsequent to quarter-end, SoFi further expanded its LPB offering to include Home Equity Loans.
In addition to our Loan Platform Business, SoFi continued to see healthy growth in interchange fee revenue and brokerage fee revenue. In the second quarter, interchange fee revenue was up 55% year-over-year, as a result of $28 billion in total annualized spend in the quarter across SoFi Money and Credit Card. Brokerage fee revenue was up nearly 2.5x year-over-year, reflecting strong member demand and increased monetization.
Contribution profit for the second quarter of 2026 reached $212.7 million, a $24.4 million improvement over the prior year period, while contribution margin declined 6 percentage points year-over-year to 46%.
Financial Services – Segment Results of Operations | ||||||||||||||||||||||
|
|
Three Months Ended
|
|
|
|
Six Months Ended
|
|
| ||||||||||||||
($ in thousands) |
| 2026 |
| 2025 |
| % Change |
| 2026 |
| 2025 |
| % Change | ||||||||||
Net interest income |
| $ | 249,052 |
|
| $ | 193,322 |
|
| 29 | % |
| $ | 476,792 |
|
| $ | 366,521 |
|
| 30 | % |
Noninterest income |
|
| 217,226 |
|
|
| 169,211 |
|
| 28 | % |
|
| 418,029 |
|
|
| 299,131 |
|
| 40 | % |
Total net revenue – Financial Services |
|
| 466,278 |
|
|
| 362,533 |
|
| 29 | % |
|
| 894,821 |
|
|
| 665,652 |
|
| 34 | % |
Provision for credit losses |
|
| (13,756 | ) |
|
| (10,031 | ) |
| 37 | % |
|
| (22,646 | ) |
|
| (15,670 | ) |
| 45 | % |
Directly attributable expenses |
|
| (239,846 | ) |
|
| (164,270 | ) |
| 46 | % |
|
| (463,915 | ) |
|
| (313,418 | ) |
| 48 | % |
Contribution profit – Financial Services |
| $ | 212,676 |
|
| $ | 188,232 |
|
| 13 | % |
| $ | 408,260 |
|
| $ | 336,564 |
|
| 21 | % |
Contribution margin – Financial Services(1) |
|
| 46 | % |
|
| 52 | % |
|
|
|
| 46 | % |
|
| 51 | % |
|
| ||
| ____________________ | ||
(1) | Contribution margin is defined for each of our reportable segments as contribution profit divided by net revenue. | |
By continuously innovating with new and relevant offerings, features and rewards for members, SoFi grew total Financial Services products by 6.4 million, or 43%, year-over-year, bringing the total to 21.3 million at quarter-end. SoFi Money reached 7.9 million products, Relay reached 8.0 million products, SoFi Invest reached 3.9 million products, Crypto reached 388 thousand products and SoFi Plus reached 206 thousand products by the end of the second quarter.
In the second quarter of 2026, total deposits grew $5.3 billion to $45.5 billion, which included strong growth in member deposits.
Financial Services – Products |
| June 30, |
|
| |||||
|
| 2026 |
| 2025 |
| % Change | |||
Money(1) |
| 7,888,387 |
| 5,887,669 |
| 34 | % | ||
Invest(2) |
| 3,931,718 |
|
| 2,853,416 |
|
| 38 | % |
Credit Card(3) |
| 509,825 |
|
| 344,469 |
|
| 48 | % |
Referred loans(4) |
| 180,443 |
|
| 122,580 |
|
| 47 | % |
Crypto(5) |
| 388,336 |
|
| — |
|
| n/m |
|
SoFi Plus(3) |
| 206,000 |
|
| — |
|
| n/m |
|
At Work |
| 189,078 |
|
| 127,224 |
|
| 49 | % |
Relay |
| 7,993,828 |
|
| 5,526,315 |
|
| 45 | % |
Total financial services products |
| 21,287,615 |
|
| 14,861,673 |
|
| 43 | % |
| ____________________ | ||
(1) | Includes checking and savings accounts held at SoFi Bank, and cash management accounts. | |
(2) | Beginning in the first quarter of 2026, we updated our SoFi Invest product metric to reflect four products. Prior to this, our SoFi Invest service was composed of two products, self-directed accounts and robo-advisory accounts. Self-directed accounts were previously referred to as active investing accounts. The impact to prior periods was determined to be immaterial, and prior periods were not recast. | |
(3) | Beginning in the second quarter of 2026, we updated our Financial Services products to include (i) SoFi Plus, which we relaunched during the quarter with significantly enhanced benefits, while fully transitioning the product to a paid subscription model; and (ii) Smart Card, our recently launched secured card (presented above within Credit Card). The impact to prior periods was determined to be immaterial, and prior periods were not recast. | |
(4) | Limited to loans wherein we provide third party fulfillment services as part of our Loan Platform Business. | |
(5) | During the fourth quarter of 2025, we returned to crypto investing with the launch of SoFi Crypto. | |
|
| |
Technology Platform Segment Results
Technology Platform segment net revenue of $84.5 million for the second quarter of 2026 increased 13% from the prior quarter. Compared to the prior year period, segment revenue decreased 23%. This includes the impact from a large client which fully transitioned off the platform prior to December 31, 2025. Contribution profit of $11.8 million reflected a contribution margin of 14%.
Technology Platform – Segment Results of Operations | ||||||||||||||||||||||
|
|
Three Months Ended
|
|
|
|
Six Months Ended
|
|
| ||||||||||||||
($ in thousands) |
| 2026 |
| 2025 |
| % Change |
| 2026 |
| 2025 |
| % Change | ||||||||||
Net interest income |
| $ | 1,022 |
|
| $ | 266 |
|
| 284 | % |
| $ | 1,377 |
|
| $ | 679 |
|
| 103 | % |
Noninterest income |
|
| 83,483 |
|
|
| 109,567 |
|
| (24 | )% |
|
| 158,214 |
|
|
| 212,581 |
|
| (26 | )% |
Total net revenue – Technology Platform |
|
| 84,505 |
|
|
| 109,833 |
|
| (23 | )% |
|
| 159,591 |
|
|
| 213,260 |
|
| (25 | )% |
Directly attributable expenses |
|
| (72,733 | ) |
|
| (76,638 | ) |
| (5 | )% |
|
| (135,820 | ) |
|
| (149,152 | ) |
| (9 | )% |
Contribution profit |
| $ | 11,772 |
|
| $ | 33,195 |
|
| (65 | )% |
| $ | 23,771 |
|
| $ | 64,108 |
|
| (63 | )% |
Contribution margin – Technology Platform(1) |
|
| 14 | % |
|
| 30 | % |
|
|
|
| 15 | % |
|
| 30 | % |
|
| ||
| ____________________ | ||
(1) | Contribution margin is defined for each of our reportable segments as contribution profit divided by net revenue. | |
Technology Platform enabled accounts increased 2 million from the prior quarter. Technology Platform-enabled accounts decreased 16% year-over-year to 135 million.
During the second quarter, SoFi launched a new unified brand, SoFi Tech Solutions, offering enterprise clients products and services across one integrated platform serving four key areas: Processing, Banking Core Ledgers & Services, Payment Hub, and Risk & Fraud. SoFi also added new platform capabilities across credit cards, lines of credit, buy now, pay later, and installment lending.
Technology Platform |
| June 30, |
|
| |||||
|
| 2026 |
| 2025 |
| % Change | |||
Total accounts |
| 134,804,238 |
| 160,046,369 |
| (16 | )% | ||
Lending Segment Results
For the second quarter of 2026, Lending segment GAAP net revenue of $724.8 million increased 63% from the prior year period, while adjusted net revenue for the segment of $711.7 million increased 59% from the prior year period.
Lending segment performance in the second quarter was driven by net interest income, which rose 54% year-over-year. The balance of the growth was primarily driven from loan origination fees which increased 64% from the prior year.
Lending segment second quarter contribution profit of $399.0 million was up 63% from $244.7 million in the corresponding prior-year period. Lending segment adjusted contribution margin was strong at 56%. This strong performance reflects our ability to capitalize on continued strong demand for our lending products.
Lending – Segment Results of Operations | ||||||||||||||||||||||
|
|
Three Months Ended
|
|
|
|
Six Months Ended
|
|
| ||||||||||||||
($ in thousands) |
| 2026 |
| 2025 |
| % Change |
| 2026 |
| 2025 |
| % Change | ||||||||||
Net interest income |
| $ | 573,298 |
|
| $ | 372,675 |
|
| 54 | % |
| $ | 1,073,529 |
|
| $ | 733,296 |
|
| 46 | % |
Noninterest income |
|
| 151,500 |
|
|
| 70,837 |
|
| 114 | % |
|
| 293,689 |
|
|
| 123,589 |
|
| 138 | % |
Total net revenue – Lending |
|
| 724,798 |
|
|
| 443,512 |
|
| 63 | % |
|
| 1,367,218 |
|
|
| 856,885 |
|
| 60 | % |
Servicing rights – change in valuation inputs or assumptions |
|
| (13,142 | ) |
|
| 3,274 |
|
| n/m |
|
|
| (26,305 | ) |
|
| 2,200 |
|
| n/m |
|
Residual interests classified as debt – change in valuation inputs or assumptions |
|
| 16 |
|
|
| 12 |
|
| 33 | % |
|
| 43 |
|
|
| 47 |
|
| (9 | )% |
Directly attributable expenses |
|
| (312,639 | ) |
|
| (202,088 | ) |
| 55 | % |
|
| (559,537 | ) |
|
| (375,487 | ) |
| 49 | % |
Contribution profit – Lending |
| $ | 399,033 |
|
| $ | 244,710 |
|
| 63 | % |
| $ | 781,419 |
|
| $ | 483,645 |
|
| 62 | % |
Contribution margin – Lending(1) |
|
| 55 | % |
|
| 55 | % |
|
|
|
| 57 | % |
|
| 56 | % |
|
| ||
|
|
|
|
|
|
|
|
|
|
|
|
| ||||||||||
Adjusted net revenue – Lending (non-GAAP)(2) |
| $ | 711,672 |
|
| $ | 446,798 |
|
| 59 | % |
| $ | 1,340,956 |
|
| $ | 859,132 |
|
| 56 | % |
Adjusted contribution margin – Lending (non-GAAP)(2) |
|
| 56 | % |
|
| 55 | % |
|
|
|
| 58 | % |
|
| 56 | % |
|
| ||
| ____________________ | ||
(1) | Contribution margin is defined for each of our reportable segments as contribution profit divided by net revenue. | |
(2) | For more information and a reconciliation of these non-GAAP financial measures to the most comparable GAAP measure, see “Non-GAAP Financial Measures” and Table 2 to the “Financial Tables” herein. | |
Lending – Loans At Fair Value |
|
|
|
|
|
|
| |||||||||
($ in thousands) | Personal Loans |
| Student Loans |
| Home Loans |
| Total | |||||||||
June 30, 2026 |
|
|
|
|
|
|
| |||||||||
Unpaid principal | $ | 26,101,759 |
|
| $ | 16,134,415 |
|
| $ | 2,067,122 |
|
| $ | 44,303,296 |
| |
Accumulated interest |
| 180,704 |
|
|
| 81,501 |
|
|
| 9,450 |
|
|
| 271,655 |
| |
Cumulative fair value adjustments(1) |
| 1,222,827 |
|
|
| 704,648 |
|
|
| 99,586 |
|
|
| 2,027,061 |
| |
Total fair value of loans(2)(3) | $ | 27,505,290 |
|
| $ | 16,920,564 |
|
| $ | 2,176,158 |
|
| $ | 46,602,012 |
| |
March 31, 2026 |
|
|
|
|
|
|
| |||||||||
Unpaid principal | $ | 22,317,947 |
|
| $ | 14,510,630 |
|
| $ | 1,562,339 |
|
| $ | 38,390,916 |
| |
Accumulated interest |
| 161,450 |
|
|
| 69,285 |
|
|
| 6,945 |
|
|
| 237,680 |
| |
Cumulative fair value adjustments(1) |
| 1,203,024 |
|
|
| 756,905 |
|
|
| 78,724 |
|
|
| 2,038,653 |
| |
Total fair value of loans(2)(3) | $ | 23,682,421 |
|
| $ | 15,336,820 |
|
| $ | 1,648,008 |
|
| $ | 40,667,249 |
| |
| ____________________ | ||
(1) | During the three months ended June 30, 2026, the cumulative fair value adjustments for personal loans were impacted by a higher unpaid principal balance, offset by a higher weighted average conditional prepayment rate, a higher weighted average discount rate, lower weighted average coupon, and a higher weighted average annual default rate. The higher discount rate was primarily driven by a 37 basis point increase in benchmark rates. The cumulative fair value adjustments for student loans were impacted by a higher unpaid principal balance and a lower weighted average conditional prepayment rate, partially offset by a lower weighted average coupon, higher weighted average discount rate, and higher weighted average default rate. | |
(2) | Each component of the fair value of loans is impacted by charge-offs during the period. Our fair value assumption for annual default rate incorporates fair value markdowns on loans beginning when they are 10 days or more delinquent, with additional markdowns at 30, 60 and 90 days past due. | |
(3) | Student loans are classified as loans held for investment, and personal loans and home loans are classified as loans held for sale. | |
The following table summarizes the significant inputs to the fair value model for personal and student loans:
| Personal Loans |
| Student Loans | |||||||||
| June 30, 2026 |
| March 31, 2026 |
| June 30, 2026 |
| March 31, 2026 | |||||
Weighted average coupon rate(1) | 12.89 | % |
| 12.96 | % |
| 5.89 | % |
| 5.91 | % | |
Weighted average annual default rate | 4.77 | % |
| 4.57 | % |
| 0.73 | % |
| 0.69 | % | |
Weighted average conditional prepayment rate | 25.77 | % |
| 25.55 | % |
| 10.99 | % |
| 11.15 | % | |
Weighted average discount rate | 4.97 | % |
| 4.61 | % |
| 4.29 | % |
| 4.05 | % | |
Benchmark rate(2) | 3.99 | % |
| 3.62 | % |
| 3.90 | % |
| 3.59 | % | |
| ____________________ | ||
(1) | Represents the average coupon rate on loans held on balance sheet, weighted by unpaid principal balance outstanding at the balance sheet date. | |
(2) | Corresponds with two-year SOFR for personal loans, and four-year SOFR for student loans. | |
For the second quarter of 2026, record origination volume of $14.8 billion increased 69% year-over-year. This was a result of continued strong member demand for personal loans, student loans and home loans as well as strong demand from capital markets partners.
Record personal loan originations of $10.7 billion in the second quarter of 2026 were up 54% year-over-year, inclusive of $3.1 billion originated on behalf of third parties through our Loan Platform Business. SoFi's multichannel strategy continues to allow us to serve more members and provide revenue diversification.
Second quarter student loan volume of $2.7 billion was up 170% year-over-year. This marked the highest quarter of student loan originations in SoFi's history.
Home loan volume was $1.4 billion, an increase of 74% year-over-year. Home equity loan originations were strong during the second quarter, accounting for one-third of total home loan volume.
Capital markets activity in the second quarter of 2026 was strong. Overall, SoFi sold, or transferred through our Loan Platform Business, more than $4.1 billion in total of personal loans and home loans. In terms of home loan sales, we closed $833.7 million at a blended execution of 101.6%.
During the quarter, SoFi executed two co-contributor securitizations of loans previously originated through our Loan Platform Business, totaling $1.4 billion. These marked the sixth and seventh securitizations of new collateral under our SoFi Consumer Loan Program (SCLP) since 2021 using collateral originated in the Loan Platform Business. Importantly, this channel provides our partners with meaningful liquidity to support their ongoing investment in the Loan Platform Business. The transaction priced at industry-leading cost-of-funds levels, with a weighted average spread of 91 basis points and 86 basis points, respectively.
Credit performance for personal loans remained strong in the second quarter, in line with expectations.
Contacts
Investors:
SoFi Investor Relations
IR@sofi.com
Media:
SoFi Media Relations
PR@sofi.com
Read full story here
Mentioned In This Article
Latest News
| 15 hours | |
| Sep-16 | |
| Sep-16 | |
| Sep-15 | |
| Sep-14 | |
| Sep-10 | |
| Sep-09 | |
| Sep-06 | |
| Sep-03 | |
| Sep-03 | |
| Sep-03 | |
| Sep-03 | |
| Sep-03 | |
| Sep-03 | |
| Sep-01 |
