Can the S&P 500 Escape Its Trading Range This Month?
“The Fed held its benchmark rate steady, in a range of 3.5% to 3.75%, in a 9-3 vote. The rate-setting panel issued the same policy statement as it did in June, when it also held rates steady. The decision left Chairman Kevin Warsh’s vow to end the run of above-target inflationto rest for a second straight meeting on words rather than action.”
-The Wall Street Journal, July 29, 2026
“The worst of the positioning washout is probably behind us,” says Lombard Odier’s Florian Ielpo
-Bloomberg, July 31, 2026
“The selloff on Wednesday was ‘completely unwarranted to be honest,’ said Vuk Vukovic, chief investment officer at Oraclum Capital. ‘There had to be something else behind it.’ Now we see what happened,’ he added.”
“Jupiter Quant Fund Plunged More Than 40% As AI Pain Spread”
Last week was chock full of “market-moving” headlines, ranging from Fed Chair Kevin Warsh’s second Federal Open Market Committee (FOMC) as Chair and earnings reports from several large-cap technology companies. But the major event, amid the deepening slump in semiconductor and other artificial intelligence (AI) names, was news that Citadel’s Ken Griffin gave Leopold Aschenbrenner’s leveraged Situational Awareness hedge fund a chance to survive by buying many of its AI-related assets at a discount amid margin calls as the AI rout deepened. This occurred as leveraged exchange-traded funds (ETFs), particularly South Korea’s ETF heavily leveraged to shares of Samsung and S.K. Hynix, experienced negative flows, further exacerbating the AI and semiconductor slide.
If there is any doubt that the AI-related trade was crowded, look no further than the excerpts above. The biggest question investors might ask is, “Are any other funds in the same boat as Jupiter and Situational Awareness?” If so, there could be more forced liquidations among those that turned greed into leverage in a situation that is reminiscent of the collapse of Long-Term Capital Management in 1998, which used leverage. Ultimately, given its size, the Federal Reserve had to engineer a rescue due to the financial risks created by its collapse.
As investors navigate margin call risk, they are also fretting about rising yields in the long end of the bond market creating higher borrowing costs, particularly for homebuyers. Rates surged as the Fed kept the Fed Funds Rate unchanged, even as inflation continues to linger above the 2% goal and oil prices remain comfortably above levels that preceded the U.S.’s attack on Iran, which continues to be an unresolved situation, or “known unknown”.
At the equity level, we saw earnings-related gaps on multiple mega-cap technology names that have the capability to move weighted-equity benchmarks such as the S&P 500 Index (SPX--7,489.72). But it was a wash, with Meta Platforms (META) and Apple (AAPL) downside gaps offset by impressive earnings-related advances in Microsoft (MSFT) and Amazon.com (AMZN).
“There have been 48 trading days since May 14, and there have been only four trading days in which the SPX’s open, high and low were above 7,530. During the other 44 trading days, there has either been a touch of 7,300 or 7,530 or full candles between these two levels. In other words, it has been a narrow 3% trading range…For clues about what may follow a breakout from this range, recent history offers a guide: over the past 10 years, the SPX has shown multiple similar two-month holding patterns. We used our pattern matching capabilities to produce forward returns…If you are a bull, the historical results aren’t that encouraging for the next month. But looking out three months, there is reason for bulls to have a ‘glass half full’ perspective.”
-Monday Morning Outlook, July 27, 2026
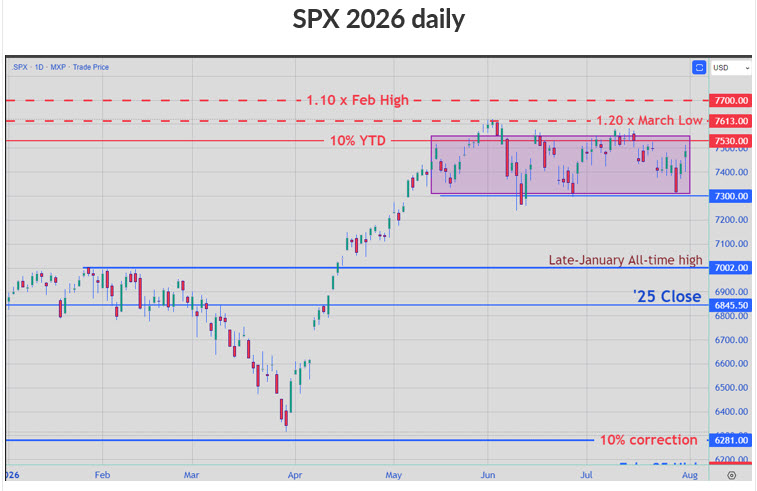
Despite the heavy news flow last week, the SPX remains in a range, weighed down by the mega-cap stocks. The index has now been in a range between 7,300 and 7,530 for 49 of the past 53 trading days, with the upper and lower boundary of the range nearly covered in the last three trading days of last week. In other words, there is plenty of daily movement stirred by headlines, but still no directional movement looking back more than two months.
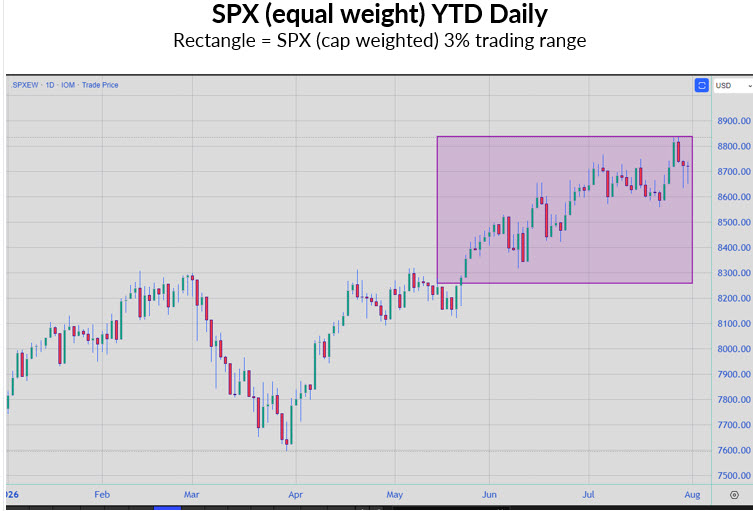
Per the chart below, the SPX Equal Weight Index (.SPXEW) broke out to an all-time high, thanks to the strong price action in financials, healthcare and a recovery in a few software stocks the past three months. In fact, during the cap-weighted SPX trading range, the .SPXEW rallied about 6%. Even though the AI and tech trade grabs the most social media and media attention, there have been opportunities elsewhere for short-term traders with an eye on playing the rotation game.
“Historically, we are heading into the most bearish two-month period of the year. Since 1975, August has been the third-worst month of the year, with the SPX averaging a return of 0.21%. September has been even weaker, the only month to average a negative return and the only month with fewer than half of the returns positive... The 8.5% year-to-date return for the SPX is the sweet spot for August. The month has been especially strong when the index has gained between 5% and 13% through the end of July. In those years, August averaged a return of 1.78%, with positive returns 77% of the time.”
-Indicator of the Week, July 29, 2026
Looking out over the next month, range patterns like the one the SPX is currently experiencing have not historically boded well for bulls. Historically, there has been roughly a coin-flip chance of upside in the month following a two-month narrow trading range, with the average loss exceeding the average gain. On the surface, seasonality is not on the side of the bulls either.
But when drilling down to the SPX’s year-to-date performance going into August, the odds shift in favor of the bulls. This is something to keep on your radar, especially if the focus in the media is heavily biased toward negative seasonality. Such sentiment could create a positive surprise for those positioned for an advance.
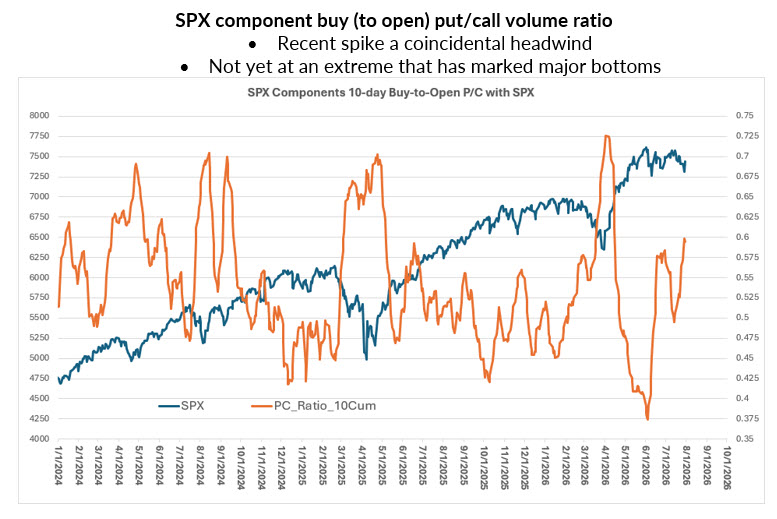
Beyond the forced selling that became known last week, additional coincidental headwinds are emerging as equity option buyers turn to more put buying and active investment managers reduce exposure to stocks after a near fully invested position two weeks ago.
If this sentiment shift persists among major trading participants, key equity benchmarks may continue displaying range action or briefly move below the range lows. But with the longer-term technical backdrop still in favor of the bulls, and a history of equity option buyers wrongly positioned ahead of major directional moves, the current shift in sentiment toward caution could ultimately be rewarding for bulls in the coming weeks or months.
Todd Salamone is Schaeffer's Senior V.P. of Research.
Continue reading:
- Indicator of the Week: Can Stocks Defy the Upcoming Bearish Seasonality?
- The Week Ahead: Jobs Data, Top 10 Earnings Reports to Watch
- The Contrarian Edge: One Stock to Watch If This is a Dead Cat Bounce
Mentioned In This Article
Latest News
| Oct-17 | |
| Oct-17 | |
| Oct-17 | |
| Oct-17 | |
| Oct-17 | |
| Oct-17 | |
| Oct-17 | |
| Oct-17 | |
| Oct-17 | |
| Oct-17 | |
| Oct-17 | |
| Oct-17 | |
| Oct-16 | |
| Oct-16 | |
| Oct-16 |
