HPE Reports Fiscal 2026 Third Quarter Results
Record results and demand drive higher outlook for fiscal 2026 and fiscal 2027
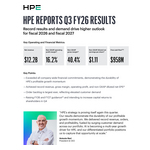
-Record revenue of $12.2 billion, up 34% year-over-year
-Record operating profit, with GAAP OP up 464% and non-GAAP OP up 155% year-over-year


HOUSTON--(BUSINESS WIRE)--HPE (NYSE: HPE) today announced financial results for the third quarter ended July 31, 2026.
“HPE’s strategy is proving itself again this quarter. Our results demonstrate the durability of our profitable growth momentum. We delivered record revenue, orders, and profitability, fueled by surging customer demand across our portfolio,” said Antonio Neri, president and CEO of HPE. “AI is becoming a multi-year growth driver for HPE, and our differentiated portfolio positions us to capture that opportunity at scale.”
“Our outstanding revenue performance and expanded profitability in the third quarter reflect robust demand across our portfolio and consistent, disciplined execution,” said Marie Myers, executive vice president and CFO of HPE. “With our Q3 results and our order backlog at a record level, we are raising our financial outlook and plan to return at least 75% of free cash flow to shareholders in Q4.”
Third Quarter Fiscal 2026 Financial Results
- Revenue: $12.2 billion, up 34% from the prior-year period
-
Gross margins:
- GAAP of 40.1%, up 1,090 basis points from the prior-year period and up 360 basis points sequentially
- Non-GAAP(1) of 40.4%, up 1,050 basis points from the prior-year period and up 350 basis points sequentially
-
Operating profit margins:
- GAAP of 11.4%, up 870 basis points from the prior-year period and up 440 basis points sequentially
- Non-GAAP(1) of 16.2%, up 770 basis points from the prior-year period and up 290 basis points sequentially
-
Diluted net earnings per share (“EPS”):
- GAAP of $1.06, up $0.85 from the prior-year period and above our outlook range of $0.84 - $0.89
- Non-GAAP(1) of $1.11, up $0.67 from the prior-year period and above our outlook range of $0.88 - $0.93
- Cash flow from operations: $1.6 billion, an increase of $0.3 billion from the prior-year period
- Free cash flow(1)(2): $1.0 billion, an increase of $0.2 billion from the prior-year period
- Capital returns to common shareholders: $324 million in the form of dividends and share repurchases
Third Quarter Fiscal 2026 Segment Results
-
Networking revenue was $2.9 billion, up 74.9% from the prior-year period, with 22.0% operating profit margin, compared to 22.1% from the prior-year period.
-
Within Networking, revenue from:
- Campus & Branch was $1.4 billion, up 31.0% from the prior-year period.
- Data Center Networking was $382 million, up 112.2% from the prior-year period.
- Security was $281 million, up 75.6% from the prior-year period.
- Routing was $788 million, up 270.0% from the prior-year period.
-
Within Networking, revenue from:
-
Cloud & AI revenue was $9.0 billion, up 25.4% from the prior-year period, with 17.0% operating profit margin, compared to 7.0% from the prior-year period.
-
Within Cloud & AI, revenue from:
- Server was $6.8 billion, up 35.3% from the prior-year period.
- Storage was $1.3 billion, up 10.2% from the prior-year period.
- Financial Services was $0.9 billion, down 0.3% from the prior-year period.
-
Within Cloud & AI, revenue from:
- Corporate Investments and Other revenue was $278 million, up 3.0% from the prior-year period, with -24.1% of operating profit margin, compared to -7.0% from the prior-year period.
Dividend
The HPE Board of Directors declared a regular cash dividend of $0.1425 per share on the company’s common stock, payable on or about October 16, 2026, to stockholders of record as of the close of business on September 17, 2026.
Fiscal 2026 Fourth Quarter Outlook
HPE estimates revenue to be in the range of $13.9 billion to $14.8 billion. HPE estimates GAAP diluted net EPS to be in the range of $1.12 to $1.22 and non-GAAP diluted net EPS(1) to be in the range of $1.20 to $1.30. Fiscal 2026 fourth quarter non-GAAP diluted net EPS estimate excludes net after-tax adjustments of approximately $0.08 per diluted share, primarily related to amortization of intangible assets, stock-based compensation expense, acquisition, disposition and other charges, and cost reduction program.
Fiscal 2026 Full Year Outlook
HPE is raising its FY26 revenue growth outlook range to 34% to 37%. HPE is raising revenue growth expectations for the Networking segment to 73% to 74%. HPE estimates GAAP operating profit growth range to be 1,070% to 1,105% and non-GAAP operating profit growth range between 100% to 105%(1)(3).
HPE is raising both GAAP diluted net EPS to be in the range of $2.93 to $3.03 and non-GAAP diluted net EPS(1) to be in the range of $3.75 to $3.85. Fiscal 2026 non-GAAP diluted net EPS estimate excludes net after-tax adjustments of approximately $0.82 per diluted share, primarily related to amortization of intangible assets, stock-based compensation expense, acquisition, disposition and other charges, cost reduction program, and adjustments related to the sale of H3C. HPE is also raising its free cash flow(1)(2)(4) guidance and now expects free cash flow to be at least $3.75 billion.
Fiscal 2027 Outlook Framework
The company is raising its growth framework for FY27. HPE is raising its revenue growth outlook range to 13% to 17%. HPE is raising expectations for non-GAAP diluted net EPS growth to be in the range of 16% to 20%(1)(4). HPE estimates non-GAAP operating margin rate to be in the range of 14% to 15%(1)(4). HPE is also raising its free cash flow guidance and now expects free cash flow to be at least $5.0 billion(1)(2)(4).
1 | A description of HPE’s use of non-GAAP financial information is provided below under “Use of non-GAAP financial information and key performance metrics.” | |
|
| |
2 | Free cash flow represents cash flow from operations, less net capital expenditures (investments in property, plant & equipment (“PP&E”) and software assets less proceeds from the sale of PP&E), and adjusted for the effect of exchange rate fluctuations on cash, cash equivalents, and restricted cash. | |
|
| |
3 | FY26 non-GAAP operating profit excludes costs of approximately $2.5 billion primarily related to amortization of intangible assets, stock-based compensation expense, acquisition, disposition and other charges, and cost reduction program. | |
|
| |
4 | HPE provides certain guidance on a non-GAAP basis. In reliance on the exception provided by Item 10(e)(1)(i)(B) of Regulation S-K, Hewlett Packard Enterprise is unable to provide a reconciliation to the most directly comparable GAAP financial measure without unreasonable efforts, as the Company cannot predict some elements that are included in such directly comparable GAAP financial measure. These elements could have a material impact on the Company’s reported GAAP results for the guidance period. Refer to the discussion of non-GAAP financial measures below for more information. |
About HPE
HPE (NYSE: HPE) is a leader in essential enterprise technology, bringing together the power of AI, cloud, and networking to help organizations achieve more. As pioneers of possibility, our innovation and expertise advance the way people live and work. We empower our customers across industries to optimize operational performance, transform data into foresight, and maximize their impact. Unlock your boldest ambitions with HPE. Discover more at www.hpe.com.
Use of non-GAAP financial information and key performance metrics
To supplement Hewlett Packard Enterprise’s condensed consolidated financial statement information presented on a generally accepted accounting principles (“GAAP”) basis, Hewlett Packard Enterprise provides financial measures, non-GAAP gross profit, non-GAAP gross profit margin, non-GAAP operating profit (non-GAAP earnings from operations), non-GAAP operating profit margin (non-GAAP earnings from operations as a percentage of net revenue), non-GAAP income tax rate, non-GAAP net earnings attributable to HPE and non-GAAP net earnings attributable to common stockholders, non-GAAP diluted net earnings per share attributable to common stockholders, and free cash flow (“FCF”). Hewlett Packard Enterprise also provides forecasts of non-GAAP operating profit growth, non-GAAP diluted net earnings per share, and FCF. Reconciliations of each of these non-GAAP financial measures to their most directly comparable GAAP measures for this quarter and prior periods are included in the tables below or elsewhere in the materials accompanying this news release. In addition an explanation of the ways in which Hewlett Packard Enterprise’s management uses these non-GAAP measures to evaluate its business, the substance behind Hewlett Packard Enterprise’s decision to use these non-GAAP measures, the material limitations associated with the use of these non-GAAP measures, the manner in which Hewlett Packard Enterprise’s management compensates for those limitations, and the substantive reasons why Hewlett Packard Enterprise’s management believes that these non-GAAP measures provide supplemental useful information to investors is included further below. This additional non-GAAP financial information is not meant to be considered in isolation or as a substitute for revenue, gross profit, gross profit margin, operating profit (earnings from operations), operating profit margin (earnings from operations as a percentage of net revenue), net earnings, diluted net earnings (loss) per share (“EPS”), and cash flow from operations prepared in accordance with GAAP.
Forward-looking statements
This press release contains forward-looking statements within the meaning of the safe harbor provisions of the Private Securities Litigation Reform Act of 1995. Such statements involve risks, uncertainties, and assumptions. If the risks or uncertainties ever materialize or the assumptions prove incorrect, the results of Hewlett Packard Enterprise Company and its consolidated subsidiaries (“Hewlett Packard Enterprise”) may differ materially from those expressed or implied by such forward-looking statements and assumptions. The words “believe”, “expect”, “anticipate”, “guide”, “optimistic”, “intend”, “aim”, “will”, “estimates”, “may”, “likely”, “could”, “should” and similar expressions are intended to identify such forward-looking statements. All statements other than statements of historical fact are statements that could be deemed forward-looking statements, including but not limited to any statements regarding the ongoing integration of Juniper Networks, Inc., and any projections, estimates, or expectations of savings or synergy realizations in connection therewith; any projections, estimations, or expectations of addressable markets and their sizes, revenue (including annualized revenue run-rate), margins, expenses (including stock-based compensation expenses), investments, effective tax rates, interest rates, the impact of tax law changes and related guidance and regulations, the impact of changes in trade policies and restrictions and the uncertainty created thereby, component costs, commodity shortage, net earnings, net earnings per share, cash flows, liquidity and capital resources, inventory, goodwill, impairment charges, hedges and derivatives and related offsets, order backlog, benefit plan funding, deferred tax assets, share repurchases, currency exchange rates, repayments of debts including our asset-backed debt securities, or other financial items; recent amendments to accounting guidance and any potential impacts on our financial reporting therefrom; any projections or estimations of orders; any projections of the amount, timing, or impact of cost saving actions and anticipated benefits to be realized if any; any statements of the plans, strategies, and objectives of management for future operations, as well as the execution and consummation of corporate transactions or contemplated acquisitions and dispositions, research and development expenditures, and any resulting benefits, cost savings, charges, or revenue or profitability improvements; any statements concerning the expected development, performance, market share, or competitive performance relating to products or services; any statements concerning technological and market trends, the pace of technological innovation, and adoption of new technologies, including quantum- and artificial intelligence-related developments and any impacts of such developments on products and services offered by Hewlett Packard Enterprise; any statements regarding current or future macroeconomic trends or events and the impacts of those trends and events on Hewlett Packard Enterprise and our financial performance, including but not limited to supply chain dynamics (including but not limited to worldwide component availability), uncertain global trade policies and/or restrictions, and demand for our products and services, and our actions to mitigate such impacts to our business; the scope and duration of geopolitical tensions, including but not limited to the ongoing conflict between Russia and Ukraine, instability and conflicts in the Middle East, and the relationship between China and the U.S., and our actions in response thereto, and their impacts on our business, operations, liquidity and capital resources, employees, customers, partners, supply chain, financial results, and the world economy; any statements regarding future regulatory trends and the resulting legal and reputational exposure, including but not limited to those relating to environmental, social, governance, cybersecurity, data privacy, and artificial intelligence issues, among others; any statements regarding pending litigation, investigations, claims, or disputes; any statements of expectation or belief, including those relating to future guidance and the financial performance of Hewlett Packard Enterprise; and any statements of assumptions underlying any of the foregoing.
Risks, uncertainties, and assumptions include the need to address the many challenges facing Hewlett Packard Enterprise’s businesses; the competitive pressures faced by Hewlett Packard Enterprise’s businesses; risks associated with executing Hewlett Packard Enterprise’s strategy; the impact of macroeconomic and geopolitical trends and events, including but not limited to those mentioned above; the need to effectively manage third-party suppliers and distribute Hewlett Packard Enterprise's products and services; the protection of Hewlett Packard Enterprise's intellectual property assets, including intellectual property licensed from third parties and intellectual property shared with its former parent; risks associated with Hewlett Packard Enterprise's international operations (including from geopolitical events and macroeconomic uncertainties); the development of and transition to new products and services and the enhancement of existing products and services to meet customer needs and respond to emerging technological trends; the execution of Hewlett Packard Enterprise’s ongoing transformation and mix shift of its portfolio of offerings; the execution and performance of contracts by Hewlett Packard Enterprise and its suppliers, customers, clients, and partners, including any impact thereon resulting from macroeconomic or geopolitical events, including inflation and rising commodity costs; the prospect of a shutdown of the U.S. federal government; the hiring and retention of key employees; the execution, integration, consummation, and other risks associated with business combination, disposition, and investment transactions, including but not limited to successful integration of Juniper Networks, Inc., including our ability to integrate and implement our plans and forecasts and realize our anticipated financial and operational benefits with respect to the consolidated business; the execution, timing, and results of any cost reduction actions, including estimates and assumptions related to the costs and anticipated benefits of implementing such actions; the impact of changes to privacy, cybersecurity, environmental, global trade, and other governmental regulations; changes in our product, lease, intellectual property, or real estate portfolio; the payment or non-payment of a dividend for any period; the efficacy of using non-GAAP, rather than GAAP, financial measures in business projections and planning; the judgments required in connection with determining certain financial metrics; utility of segment realignments; allowances for recovery of receivables and warranty obligations; provisions for, and resolution of, pending litigation investigations, claims, and disputes; the impacts of tax law changes and related guidance or regulations; and other risks that are described herein, including but not limited to the items discussed in “Risk Factors” in Item 1A of Part I of the Annual Report on Form 10-K for the fiscal year ended October 31, 2025 and that are otherwise described or updated from time to time in Hewlett Packard Enterprise's subsequent Quarterly Reports on Form 10-Q, Current Reports on Form 8-K, and in other filings made with the Securities and Exchange Commission. Hewlett Packard Enterprise assumes no obligation and does not intend to update these forward-looking statements, except as required by applicable law.
As in prior periods, the financial information set forth in this press release, including tax-related items, reflects estimates based on information available at this time. While Hewlett Packard Enterprise believes these estimates to be reasonable, these amounts could differ materially from reported amounts in the filings made by Hewlett Packard Enterprise from time to time with the Securities and Exchange Commission. Hewlett Packard Enterprise assumes no obligation and does not intend to update these forward-looking statements, except as required by applicable law.
HEWLETT PACKARD ENTERPRISE COMPANY AND SUBSIDIARIES | ||||||||||||
Condensed Consolidated Statements of Earnings | ||||||||||||
(Unaudited) | ||||||||||||
|
| |||||||||||
| For the three months ended | |||||||||||
| July 31, 2026 |
| April 30, 2026 |
| July 31, 2025 | |||||||
| In millions, except per share amounts | |||||||||||
Net revenue | $ | 12,213 |
|
| $ | 10,678 |
|
| $ | 9,136 |
| |
Costs and Expenses: |
|
|
|
|
| |||||||
Cost of sales (exclusive of amortization shown separately below) |
| 7,314 |
|
|
| 6,778 |
|
|
| 6,464 |
| |
Research and development |
| 1,158 |
|
|
| 922 |
|
|
| 622 |
| |
Selling, general and administrative |
| 1,962 |
|
|
| 1,830 |
|
|
| 1,496 |
| |
Amortization of intangible assets |
| 315 |
|
|
| 323 |
|
|
| 126 |
| |
Acquisition, disposition and other charges |
| 71 |
|
|
| 78 |
|
|
| 181 |
| |
Total costs and expenses |
| 10,820 |
|
|
| 9,931 |
|
|
| 8,889 |
| |
Earnings from operations |
| 1,393 |
|
|
| 747 |
|
|
| 247 |
| |
Interest and other, net(1) |
| (75 | ) |
|
| (73 | ) |
|
| 8 |
| |
Gain on sale of equity interest |
| 444 |
|
|
| — |
|
|
| — |
| |
Gain on sale of a business |
| — |
|
|
| — |
|
|
| 1 |
| |
Earnings from equity interests |
| — |
|
|
| 25 |
|
|
| 32 |
| |
Earnings before provision for taxes |
| 1,762 |
|
|
| 699 |
|
|
| 288 |
| |
(Provision) benefit for taxes |
| (222 | ) |
|
| (75 | ) |
|
| 17 |
| |
Net earnings attributable to HPE |
| 1,540 |
|
|
| 624 |
|
|
| 305 |
| |
Preferred stock dividends |
| (29 | ) |
|
| (29 | ) |
|
| (29 | ) | |
Net earnings attributable to common stockholders | $ | 1,511 |
|
| $ | 595 |
|
| $ | 276 |
| |
Net Earnings Per Share Attributable to Common Stockholders: |
|
|
|
|
| |||||||
Basic | $ | 1.13 |
|
| $ | 0.45 |
|
| $ | 0.21 |
| |
Diluted |
| 1.06 |
|
|
| 0.44 |
|
|
| 0.21 |
| |
Cash dividends declared per share |
| 0.1425 |
|
|
| 0.1425 |
|
|
| 0.1300 |
| |
Cash dividends accrued per preferred share | $ | 0.9531 |
|
| $ | 0.9531 |
|
| $ | 0.9531 |
| |
Weighted-average Shares Used to Compute Net Earnings Per Share: |
|
|
|
|
| |||||||
Basic |
| 1,336 |
|
|
| 1,335 |
|
|
| 1,325 |
| |
Diluted |
| 1,449 |
|
|
| 1,432 |
|
|
| 1,421 |
| |
HEWLETT PACKARD ENTERPRISE COMPANY AND SUBSIDIARIES | ||||||||
Condensed Consolidated Statements of Earnings | ||||||||
(Unaudited) | ||||||||
|
| |||||||
| For the nine months ended | |||||||
| July 31, 2026 |
| July 31, 2025 | |||||
| In millions, except per share amounts | |||||||
Net revenue | $ | 32,192 |
|
| $ | 24,617 |
| |
Costs and Expenses: |
|
|
| |||||
Cost of sales (exclusive of amortization shown separately below) |
| 20,053 |
|
|
| 17,481 |
| |
Research and development |
| 2,824 |
|
|
| 1,637 |
| |
Selling, general and administrative |
| 5,490 |
|
|
| 4,062 |
| |
Amortization of intangible assets |
| 949 |
|
|
| 201 |
| |
Impairment charges |
| — |
|
|
| 1,361 |
| |
Acquisition, disposition and other charges |
| 266 |
|
|
| 304 |
| |
Total costs and expenses |
| 29,582 |
|
|
| 25,046 |
| |
Earnings (loss) from operations |
| 2,610 |
|
|
| (429 | ) | |
Interest and other, net(1) |
| (202 | ) |
|
| 86 |
| |
Gain on sale of equity interest |
| 444 |
|
|
| — |
| |
Gain on sale of a business |
| — |
|
|
| 245 |
| |
Earnings from equity interests |
| 42 |
|
|
| 74 |
| |
Earnings (loss) before provision for taxes |
| 2,894 |
|
|
| (24 | ) | |
Provision for taxes |
| (278 | ) |
|
| (94 | ) | |
Net earnings (loss) attributable to HPE |
| 2,616 |
|
|
| (118 | ) | |
Preferred stock dividends |
| (87 | ) |
|
| (87 | ) | |
Net earnings (loss) attributable to common stockholders | $ | 2,529 |
|
| $ | (205 | ) | |
Net Earnings (Loss) Per Share Attributable to Common Stockholders: |
|
|
| |||||
Basic | $ | 1.89 |
|
| $ | (0.16 | ) | |
Diluted |
| 1.82 |
|
|
| (0.16 | ) | |
Cash dividends declared per share |
| 0.4275 |
|
|
| 0.3900 |
| |
Cash dividends accrued per preferred share | $ | 2.8594 |
|
| $ | 2.8594 |
| |
Weighted-average Shares Used to Compute Net Earnings (Loss) Per Share: |
|
|
| |||||
Basic |
| 1,335 |
|
|
| 1,321 |
| |
Diluted |
| 1,441 |
|
|
| 1,321 |
| |
HEWLETT PACKARD ENTERPRISE COMPANY AND SUBSIDIARIES | ||||||||||||
Reconciliation of GAAP to Non-GAAP measures | ||||||||||||
(Unaudited) | ||||||||||||
|
|
|
|
|
|
| ||||||
|
| For the three months ended | ||||||||||
|
| July 31, 2026 |
| April 30, 2026 |
| July 31, 2025 | ||||||
|
| Dollars in millions | ||||||||||
GAAP net revenue | $ | 12,213 |
|
| $ | 10,678 |
|
| $ | 9,136 |
| |
GAAP cost of sales |
| 7,314 |
|
|
| 6,778 |
|
|
| 6,464 |
| |
GAAP gross profit |
| 4,899 |
|
|
| 3,900 |
|
|
| 2,672 |
| |
Non-GAAP Adjustments |
|
|
|
|
| |||||||
Stock-based compensation expense |
| 18 |
|
|
| 23 |
|
|
| 10 |
| |
Acquisition, disposition and other charges(2) |
| (3 | ) |
|
| 6 |
|
|
| 50 |
| |
Cost reduction program |
| 14 |
|
|
| 8 |
|
|
| — |
| |
Non-GAAP gross profit | $ | 4,928 |
|
| $ | 3,937 |
|
| $ | 2,732 |
| |
|
|
|
|
|
| |||||||
GAAP gross profit margin |
| 40.1 | % |
|
| 36.5 | % |
|
| 29.2 | % | |
Non-GAAP adjustments |
| 0.3 | % |
|
| 0.4 | % |
|
| 0.7 | % | |
Non-GAAP gross profit margin |
| 40.4 | % |
|
| 36.9 | % |
|
| 29.9 | % | |
| For the nine months ended | |||||||
| July 31, 2026 |
| July 31, 2025 | |||||
| Dollars in millions | |||||||
GAAP net revenue | $ | 32,192 |
|
| $ | 24,617 |
| |
GAAP cost of sales |
| 20,053 |
|
|
| 17,481 |
| |
GAAP gross profit |
| 12,139 |
|
|
| 7,136 |
| |
Non-GAAP Adjustments |
|
|
| |||||
Stock-based compensation expense |
| 65 |
|
|
| 40 |
| |
Acquisition, disposition and other charges(2) |
| 37 |
|
|
| 47 |
| |
Cost reduction program |
| 27 |
|
|
| 46 |
| |
H3C divestiture related severance costs |
| — |
|
|
| 17 |
| |
Non-GAAP gross profit | $ | 12,268 |
|
| $ | 7,286 |
| |
|
|
|
| |||||
GAAP gross profit margin |
| 37.7 | % |
|
| 29.0 | % | |
Non-GAAP adjustments |
| 0.4 | % |
|
| 0.6 | % | |
Non-GAAP gross profit margin |
| 38.1 | % |
|
| 29.6 | % | |
| For the three months ended | |||||||||||
| July 31, 2026 |
| April 30, 2026 |
| July 31, 2025 | |||||||
| Dollars in millions | |||||||||||
GAAP earnings from operations | $ | 1,393 |
|
| $ | 747 |
|
| $ | 247 |
| |
Non-GAAP Adjustments |
|
|
|
|
| |||||||
Amortization of intangible assets |
| 315 |
|
|
| 323 |
|
|
| 126 |
| |
Stock-based compensation expense |
| 165 |
|
|
| 218 |
|
|
| 177 |
| |
Cost reduction program |
| 31 |
|
|
| 30 |
|
|
| 2 |
| |
Acquisition, disposition and other charges(2) |
| 75 |
|
|
| 105 |
|
|
| 225 |
| |
Non-GAAP earnings from operations | $ | 1,979 |
|
| $ | 1,423 |
|
| $ | 777 |
| |
|
|
|
|
|
| |||||||
GAAP operating profit margin |
| 11.4 | % |
|
| 7.0 | % |
|
| 2.7 | % | |
Non-GAAP adjustments |
| 4.8 | % |
|
| 6.3 | % |
|
| 5.8 | % | |
Non-GAAP operating profit margin |
| 16.2 | % |
|
| 13.3 | % |
|
| 8.5 | % | |
| For the nine months ended | |||||||
| July 31, 2026 |
| July 31, 2025 | |||||
| Dollars in millions | |||||||
GAAP earnings (loss) from operations | $ | 2,610 |
|
| $ | (429 | ) | |
Non-GAAP Adjustments |
|
|
| |||||
Amortization of intangible assets |
| 949 |
|
|
| 201 |
| |
Impairment charges |
| — |
|
|
| 1,361 |
| |
Stock-based compensation expense |
| 599 |
|
|
| 447 |
| |
H3C divestiture related severance costs |
| — |
|
|
| 97 |
| |
Cost reduction program |
| 84 |
|
|
| 148 |
| |
Acquisition, disposition and other charges(2) |
| 342 |
|
|
| 345 |
| |
Non-GAAP earnings from operations | $ | 4,584 |
|
| $ | 2,170 |
| |
|
|
|
| |||||
GAAP operating profit margin |
| 8.1 | % |
|
| (1.7 | %) | |
Non-GAAP adjustments |
| 6.1 | % |
|
| 10.5 | % | |
Non-GAAP operating profit margin |
| 14.2 | % |
|
| 8.8 | % | |
HEWLETT PACKARD ENTERPRISE COMPANY AND SUBSIDIARIES | ||||||||||||||||||||||||
Reconciliation of GAAP to Non-GAAP measures | ||||||||||||||||||||||||
(Unaudited) | ||||||||||||||||||||||||
|
|
| ||||||||||||||||||||||
|
| For the three months ended | ||||||||||||||||||||||
|
|
July 31,
|
| Diluted Net EPS |
|
April 30,
|
| Diluted Net EPS |
|
July 31,
|
| Diluted Net EPS | ||||||||||||
|
| Dollars in millions, except per share amounts | ||||||||||||||||||||||
GAAP net earnings attributable to common stockholders | $ | 1,511 |
|
|
|
| $ | 595 |
|
|
|
| $ | 276 |
|
|
| |||||||
Preferred stock dividends |
| 29 |
|
|
|
|
| 29 |
|
|
|
|
| 29 |
|
|
| |||||||
GAAP net earnings attributable to HPE | $ | 1,540 |
|
| $ | 1.06 |
|
| $ | 624 |
|
| $ | 0.44 |
|
| $ | 305 |
|
| $ | 0.21 |
| |
Non-GAAP adjustments: |
|
|
|
|
|
|
|
|
|
|
| |||||||||||||
Amortization of intangible assets |
| 315 |
|
|
| 0.22 |
|
|
| 323 |
|
|
| 0.23 |
|
|
| 126 |
|
|
| 0.09 |
| |
Stock-based compensation expense |
| 165 |
|
|
| 0.11 |
|
|
| 218 |
|
|
| 0.15 |
|
|
| 177 |
|
|
| 0.12 |
| |
Gain on sale of a business |
| — |
|
|
| — |
|
|
| — |
|
|
| — |
|
|
| (1 | ) |
|
| — |
| |
Cost reduction program |
| 31 |
|
|
| 0.02 |
|
|
| 30 |
|
|
| 0.02 |
|
|
| 2 |
|
|
| — |
| |
Acquisition, disposition and other charges(2) |
| 75 |
|
|
| 0.05 |
|
|
| 105 |
|
|
| 0.08 |
|
|
| 225 |
|
|
| 0.17 |
| |
Gain on sale of equity interest |
| (444 | ) |
|
| (0.31 | ) |
|
| — |
|
|
| — |
|
|
| — |
|
|
| — |
| |
Adjustments for equity interests |
| — |
|
|
| — |
|
|
| (25 | ) |
|
| (0.02 | ) |
|
| — |
|
|
| — |
| |
Litigation judgment |
| — |
|
|
| — |
|
|
| — |
|
|
| — |
|
|
| (52 | ) |
|
| (0.04 | ) | |
Loss on equity investments, net |
| — |
|
|
| — |
|
|
| 3 |
|
|
| — |
|
|
| 1 |
|
|
| — |
| |
Adjustments for taxes |
| (40 | ) |
|
| (0.02 | ) |
|
| (110 | ) |
|
| (0.07 | ) |
|
| (128 | ) |
|
| (0.09 | ) | |
Other adjustments(3) |
| (32 | ) |
|
| (0.02 | ) |
|
| (32 | ) |
|
| (0.04 | ) |
|
| (24 | ) |
|
| (0.02 | ) | |
Non-GAAP net earnings attributable to HPE(4) |
| 1,610 |
|
| $ | 1.11 |
|
|
| 1,136 |
|
| $ | 0.79 |
|
|
| 631 |
|
| $ | 0.44 |
| |
Preferred stock dividends |
| (29 | ) |
|
|
|
| (29 | ) |
|
|
|
| (29 | ) |
|
| |||||||
Non-GAAP net earnings attributable to common stockholders | $ | 1,581 |
|
|
|
| $ | 1,107 |
|
|
|
| $ | 602 |
|
|
| |||||||
Contacts
Media Contact:
Laura Keller
Laura.Keller@hpe.com
Investor Contact:
Shannon Cross
investor.relations@hpe.com
Read full story here
Mentioned In This Article
Latest News
| Oct-16 | |
| Oct-16 | |
| Oct-16 | |
| Oct-16 | |
| Oct-15 | |
| Oct-15 | |
| Oct-15 | |
| Oct-15 | |
| Oct-15 | |
| Oct-15 | |
| Oct-14 | |
| Oct-14 | |
| Oct-14 | |
| Oct-14 | |
| Oct-14 |
